Energy
Which Companies Are Responsible For the Most Carbon Emissions?
20 Companies Responsible For the Most Carbon Emissions?
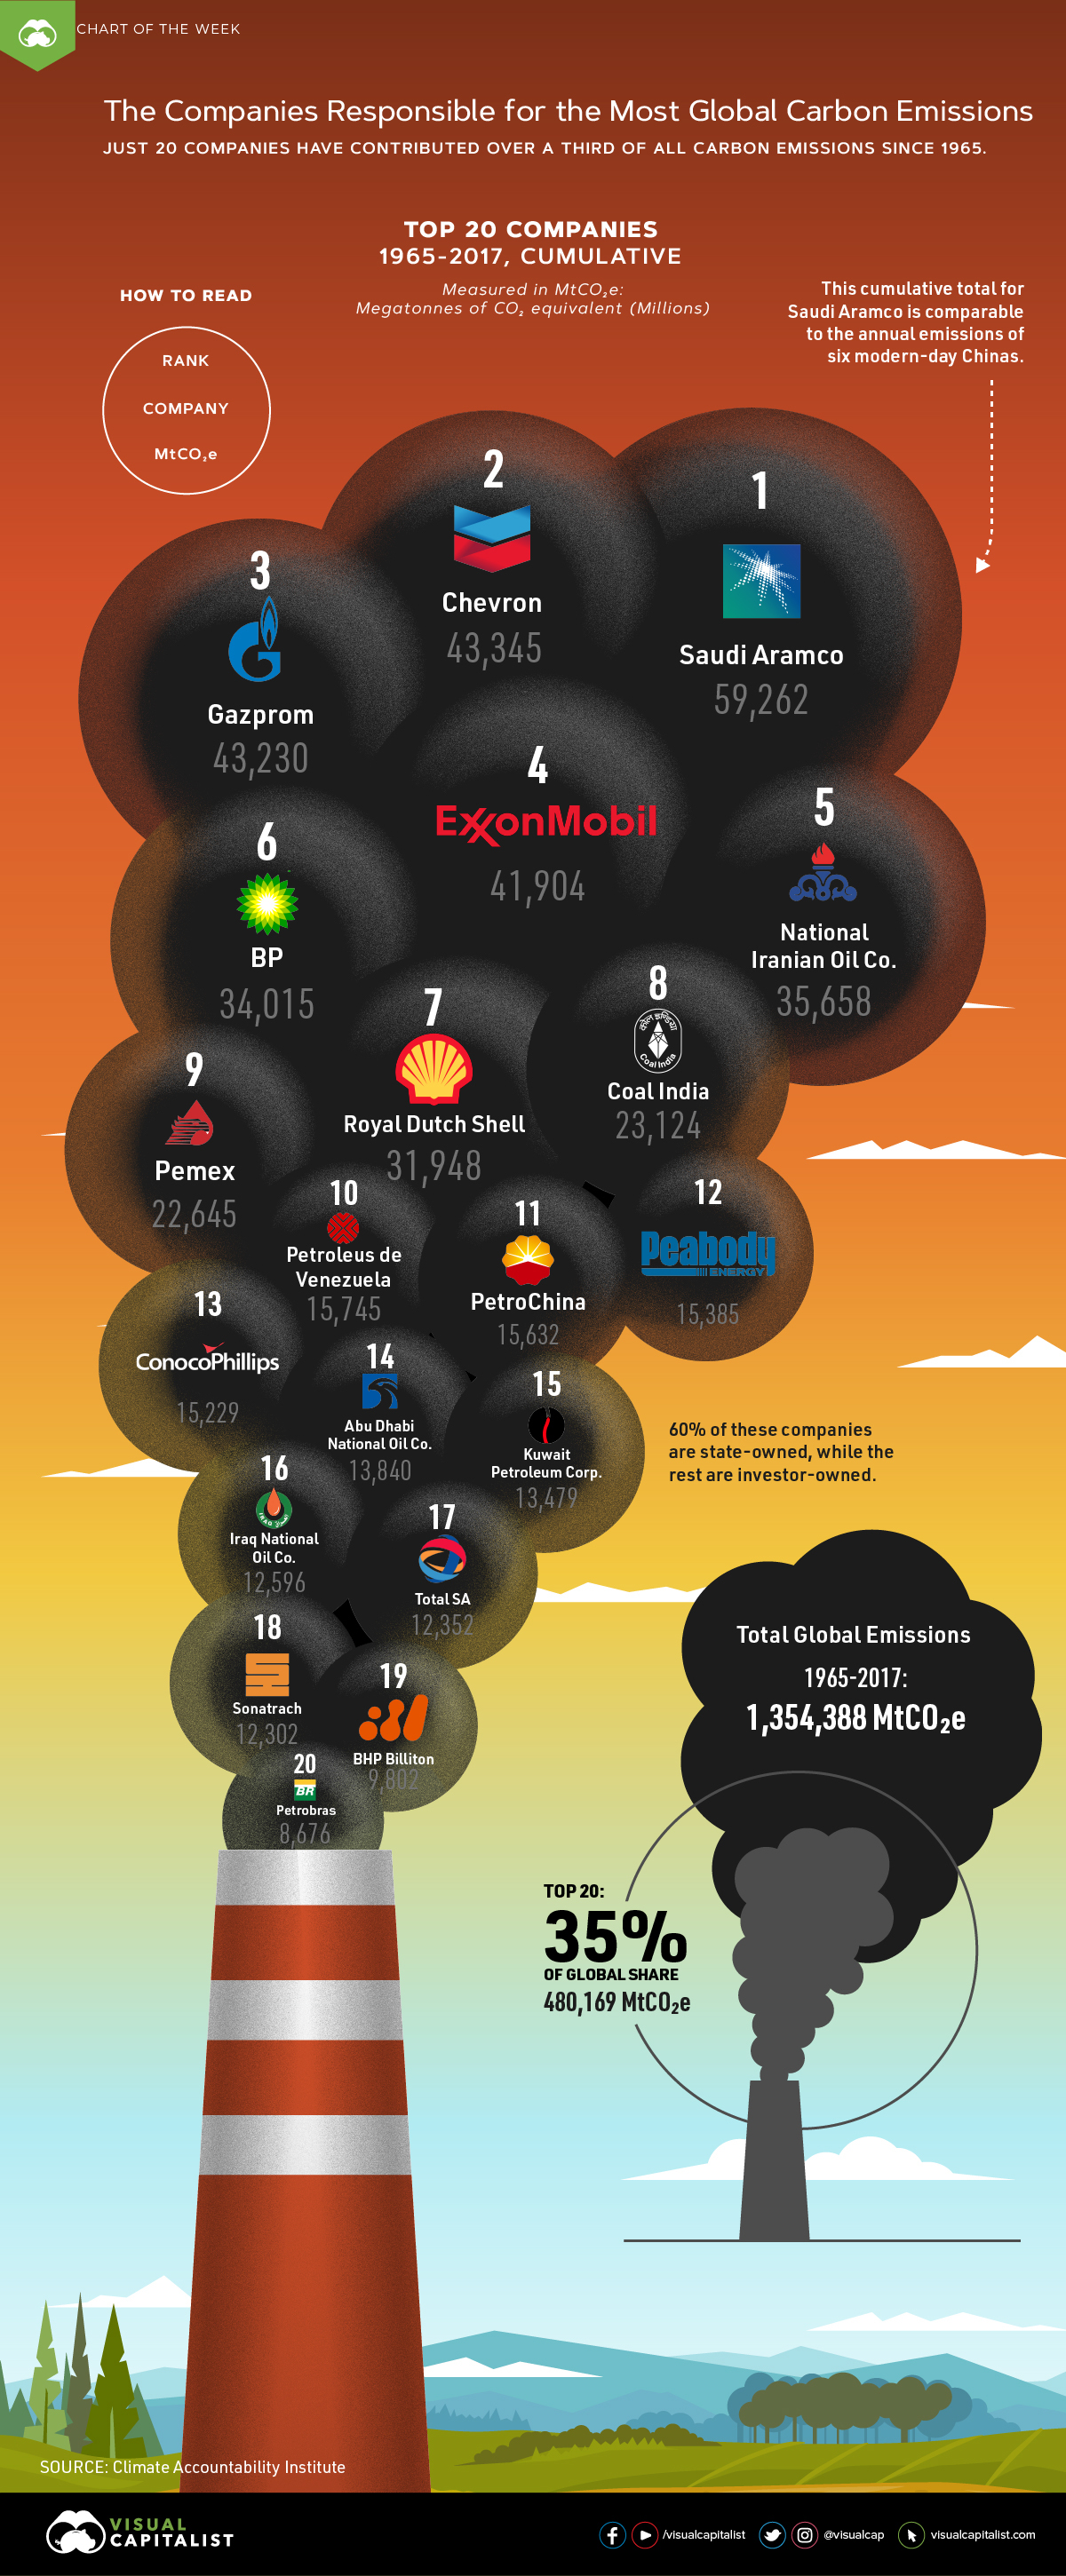
Since 1965, it’s estimated over 1.35 trillion metric tons of greenhouse gases have been released into the atmosphere—and over a third can be traced back to just 20 companies.
This week’s chart draws on a dataset from the Climate Accountability Institute, and highlights the companies which have been responsible for the most carbon emissions in the past half-century.
Note: Carbon emissions are measured in MtCO₂e: Megatonnes of CO₂ equivalent (Millions).
The Sum of their Carbon Emissions
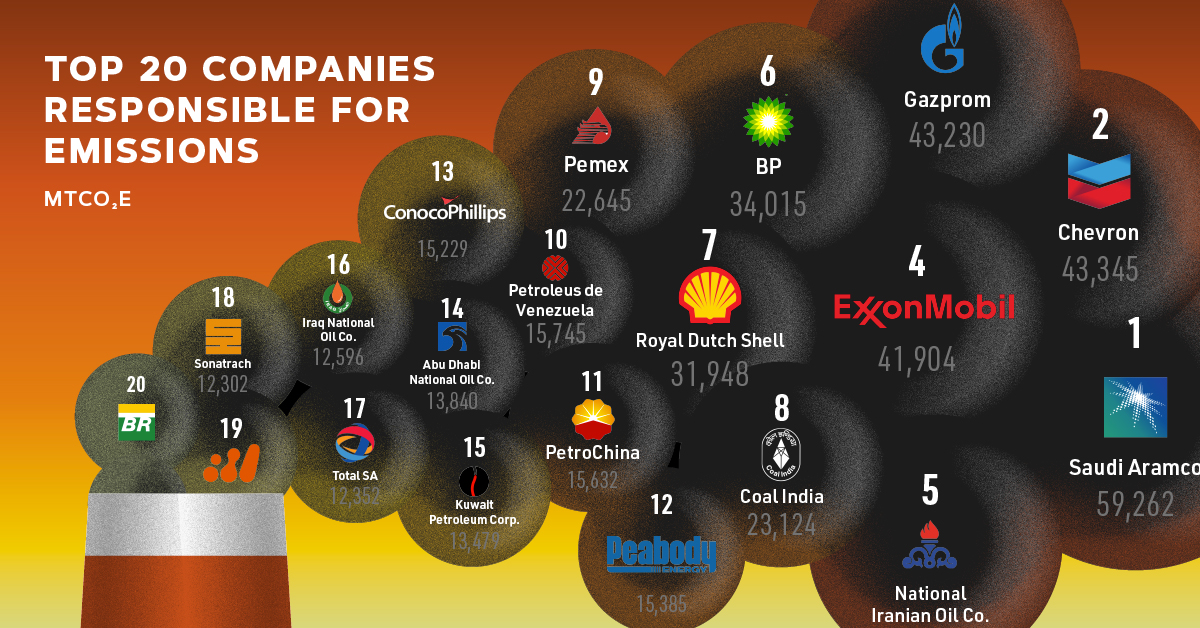
Between 1965-2017, the top 20 companies have contributed 480,169 MtCO₂e in total carbon emissions, or 35% of cumulative global emissions. This whopping amount is mostly from the combustion of their products—each company on this chart deals in fossil fuels.
The largest contributor? Saudi Aramco, the national petroleum and natural gas company of Saudi Arabia. Saudi Aramco actually comes in first on another list as well—it’s the most profitable company, making over $304 million daily.
However, this financial gain came at a significant cost: the state-owned giant’s operations have resulted in 59,262 MtCO₂e in carbon emissions since 1965. To put that into perspective, this total is more than six times China’s emissions in 2017 alone (9,838 MtCO₂e).
Explore the full list of companies by location, who owns them, and their total 1965–2017 emissions count below:
| Company | Country | Ownership | All Emissions, MtCO₂e |
|---|---|---|---|
| Saudi Aramco | 🇸🇦 Saudi Arabia | State-owned | 59,262 |
| Chevron | 🇺🇸 U.S. | Investor-owned | 43,345 |
| Gazprom | 🇷🇺 Russia | State-owned | 43,230 |
| Exxon Mobil | 🇺🇸 U.S. | Investor-owned | 41,904 |
| National Iranian Oil Co. | 🇮🇷 Iran | State-owned | 35,658 |
| BP | 🇬🇧 UK | Investor-owned | 34,015 |
| Royal Dutch Shell | 🇳🇱 Netherlands | Investor-owned | 31,948 |
| Coal India | 🇮🇳 India | State-owned | 23,124 |
| Pemex | 🇲🇽 Mexico | State-owned | 22,645 |
| Petroleus de Venezuela | 🇻🇪 Venezuela | State-owned | 15,745 |
| PetroChina | 🇨🇳 China | State-owned | 15,632 |
| Peabody Energy | 🇺🇸 U.S. | Investor-owned | 15,385 |
| ConocoPhillips | 🇺🇸 U.S. | Investor-owned | 15,229 |
| Abu Dhabi National Oil Co. | 🇦🇪 UAE | State-owned | 13,840 |
| Kuwait Petroleum Corp. | 🇰🇼 Kuwait | State-owned | 13,479 |
| Iraq National Oil Co. | 🇮🇶 Iraq | State-owned | 12,596 |
| Total SA | 🇫🇷 France | Investor-owned | 12,352 |
| Sonatrach | 🇩🇿 Algeria | State-owned | 12,302 |
| BHP Billiton | 🇦🇺 Australia | Investor-owned | 9,802 |
| Petrobras | 🇧🇷 Brazil | State-owned | 8,676 |
| Total Emissions | 480,169 MtCO₂e |
A Greener Business Model?
According to the researchers, all the companies that show up in today’s chart bear some responsibility for knowingly accelerating the climate crisis even after proven scientific evidence.
In fact, U.S.-based Exxon Mobil is currently on trial for misleading investors: the company downplayed the effect of climate change on its profitability, while internal calculations proved to be much larger. It also sowed public doubt on the immense impacts of rising greenhouse gas levels on the planet.
Growing sustainability and environmental concerns threaten the viability of old business models for these corporations, causing many to pivot away from the fossil fuel focus. Take BP for example—originally named British Petroleum, the company embraced “Beyond Petroleum” as its new rallying cry. More recently, it launched a carbon footprint calculator and is committed to keeping its carbon emissions flat into 2025.
The first step to reducing your emissions is to know where you stand. Find out your #carbonfootprint with our new calculator & share your pledge today!
— BP (@BP_plc) October 22, 2019
However, the Climate Accountability Institute argues that more can still be done, with the researchers calling for these companies to reduce their fossil fuel production in the near future.
Continued pressure on these “Big Oil” companies to peak their carbon emissions, and urgently increase their renewable energy investment, may help curb the climate crisis before it’s too late.
Correction: A previous version of this article mistakenly reported the total cumulative value of carbon emissions in millions instead of trillions. Both the article and graphic have been updated to reflect the changes accurately.


Who’s Building the Most Solar Energy?
This was originally posted on our Voronoi app. Download the app for free on iOS or Android and discover incredible data-driven charts from a variety of trusted sources.
In 2023, solar energy accounted for three-quarters of renewable capacity additions worldwide. Most of this growth occurred in Asia, the EU, and the U.S., continuing a trend observed over the past decade.
In this graphic, we illustrate the rise in installed solar photovoltaic (PV) capacity in China, the EU, and the U.S. between 2010 and 2022, measured in gigawatts (GW). Bruegel compiled the data..
Chinese Dominance
As of 2022, China’s total installed capacity stands at 393 GW, nearly double that of the EU’s 205 GW and surpassing the USA’s total of 113 GW by more than threefold in absolute terms.
| Installed solar capacity (GW) | China | EU27 | U.S. |
|---|---|---|---|
| 2022 | 393.0 | 205.5 | 113.0 |
| 2021 | 307.0 | 162.7 | 95.4 |
| 2020 | 254.0 | 136.9 | 76.4 |
| 2019 | 205.0 | 120.1 | 61.6 |
| 2018 | 175.3 | 104.0 | 52.0 |
| 2017 | 130.8 | 96.2 | 43.8 |
| 2016 | 77.8 | 91.5 | 35.4 |
| 2015 | 43.6 | 87.7 | 24.2 |
| 2014 | 28.4 | 83.6 | 18.1 |
| 2013 | 17.8 | 79.7 | 13.3 |
| 2012 | 6.7 | 71.1 | 8.6 |
| 2011 | 3.1 | 53.3 | 5.6 |
| 2010 | 1.0 | 30.6 | 3.4 |
Since 2017, China has shown a compound annual growth rate (CAGR) of approximately 25% in installed PV capacity, while the USA has seen a CAGR of 21%, and the EU of 16%.
Additionally, China dominates the production of solar power components, currently controlling around 80% of the world’s solar panel supply chain.
In 2022, China’s solar industry employed 2.76 million individuals, with manufacturing roles representing approximately 1.8 million and the remaining 918,000 jobs in construction, installation, and operations and maintenance.
The EU industry employed 648,000 individuals, while the U.S. reached 264,000 jobs.
According to the IEA, China accounts for almost 60% of new renewable capacity expected to become operational globally by 2028.
Despite the phasing out of national subsidies in 2020 and 2021, deployment of solar PV in China is accelerating. The country is expected to reach its national 2030 target for wind and solar PV installations in 2024, six years ahead of schedule.

-

 Wealth6 days ago
Charted: What Frustrates Americans About the Tax System
-

 Mining2 weeks ago
Visualizing Global Gold Production in 2023
-

 Markets2 weeks ago
Visualized: Interest Rate Forecasts for Advanced Economies
-

 Economy2 weeks ago
The Most Valuable Companies in Major EU Economies
-

 Markets1 week ago
The World’s Fastest Growing Emerging Markets (2024-2029 Forecast)
-

 Markets1 week ago
Visualizing Global Inflation Forecasts (2024-2026)
-

 Misc1 week ago
Charted: What Southeast Asia Thinks About China & the U.S.
-

 Misc1 week ago
The Evolution of U.S. Beer Logos