Project management reports are not fresh for project managers and projects stakeholders. It is a helpful tool for the project manager to exercise control over progress, performance, quality, etc. However, it is also a very burdensome thing. How can we improve the efficiency of creating project management reports? Or how to improve its structure? In this post, I want to share some experience on how to prepare a better project management report.
Contents
What is Project Management Report?
A project management report (or project management dashboard) is a high-level overview of the current status of a project. In another word, it is a formal and regular record of a project state at a given time.
Why is project management report critical?
To be more explicit about the importance of project management reports, let’s see what they can bring to companies:
- Monitor what’s working to encourage the explanation and focus
- Uncover what’s not working to facilitate reflection and modification
In short, project reporting provides project stakeholders with a window into what’s happening and what to do about it for the entire team. Otherwise, the project team and project stakeholders end up being in the dark.
Depending on the project’s size and complexity, the project management reporting content and frequency may vary. Usually, the project management reports are delivered weekly or monthly.

Next, we offer some basic guidelines to follow to write a project management report. To make it easier for you to understand, we also provide many excellent demos made with FineReport.
Project Management Report Structure
Regardless of which business is and who the potential readers are, some core elements and key sections are necessary for all project reports:
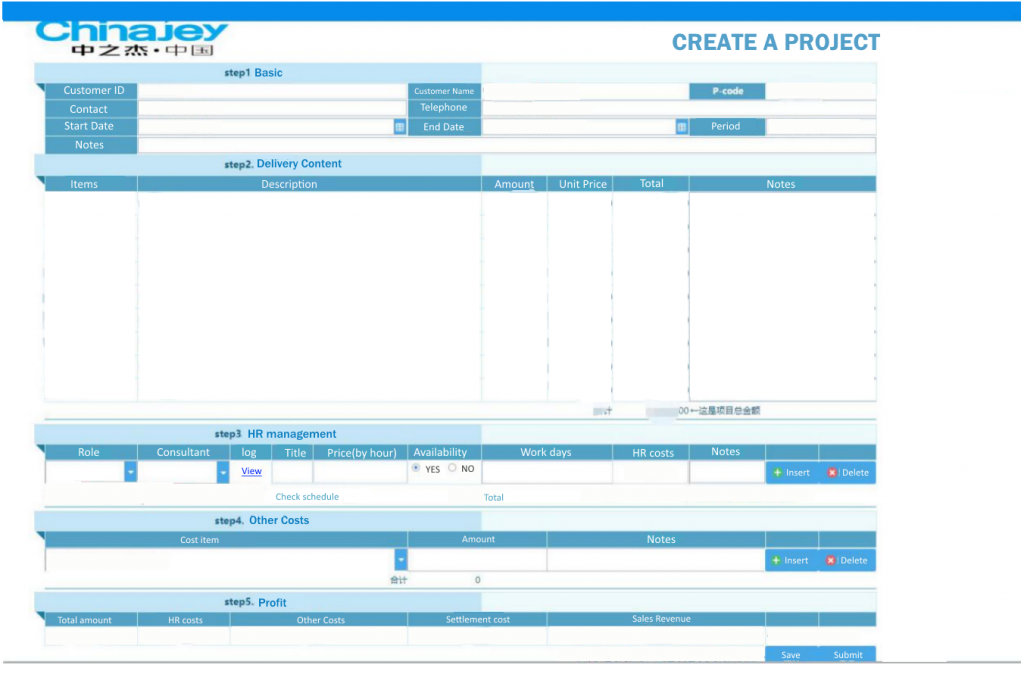
- Basic Project Info. Project name and ID, manager’s or sponsor’s name, start date and (expected) end date, client description, and the reporting date are the necessary information that every project management report should include.
- Summary. The summary gives the reader a quick overview of the key information they should take away.
- Progress. This section should consist of a planned schedule, milestones, and achievements.
- Expense and Budget. Stakeholders should be informed of the actual and predicted expenses and whether the project is over or under budget.
- Resources. Document all the resources: financial, personnel, and other resources required to reach project goals. Check their status: availability, missing, under or over allocation.
- Risk management. Here, project managers should summarize all predicted risks so that stakeholders can obtain a clear risk assessment and prepare plan B.
- Quality. Report any quality testing and any issues found.
- Schedule and timeline. Establishing a realistic schedule is essential because it affects workload scheduling and helps other stakeholders stay on track.
What should be included in the project management dashboard?
Well, after knowing the main content in project management reports, you might also be interested in the structure of the project management dashboard. You can understand the project management dashboard as a visual way to outline the key content in a project management report.
Normally, to make a qualified project management dashboard, you need to cover the following widgets.
- Activity tracking
- Progress
- Team status
- Milestones
- Resources
If you are not sure what these widgets do, let’s look at some examples and templates to understand their roles in practice.
Best Project Management Reporting Examples & Templates
Let’s dive into the scenario and catch sight of the useful examples that help you efficiently deal with project management.
Progress Bar
A progress report outlines the activities and the tasks completed, and the milestones reached against the project plan.
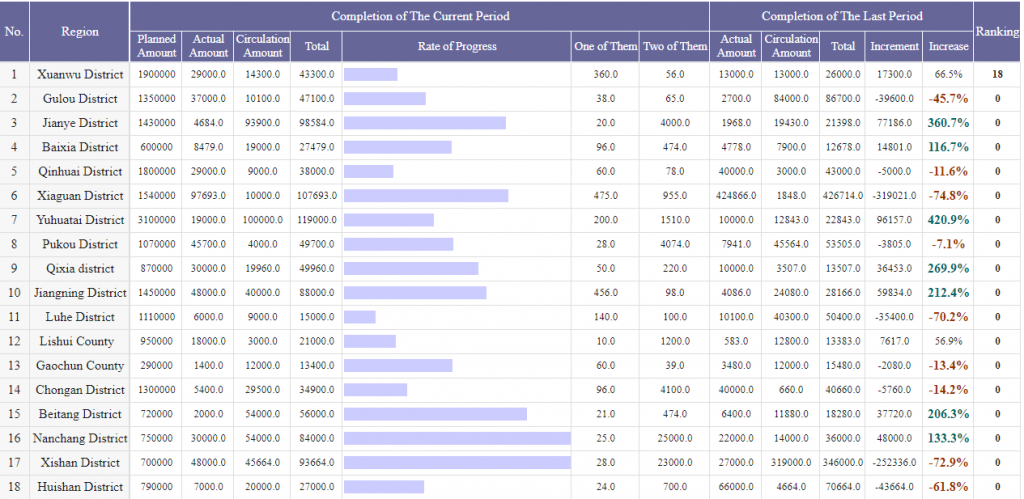
Most importantly, this well-designed template is in-built, so you can direly put in your data with FineReport.
Gantt Chart
Gantt chart is a popular application of bar charts that illustrate the schedule of projects. Through the Gantt chart, managers can monitor the progress of the current tasks of the project.
If you want to know more about example of gantt chart and how to quickly create a professional and visually appealing Gantt chart, you can check out this article: Top Gnatt Chart Examples in 2023>>>
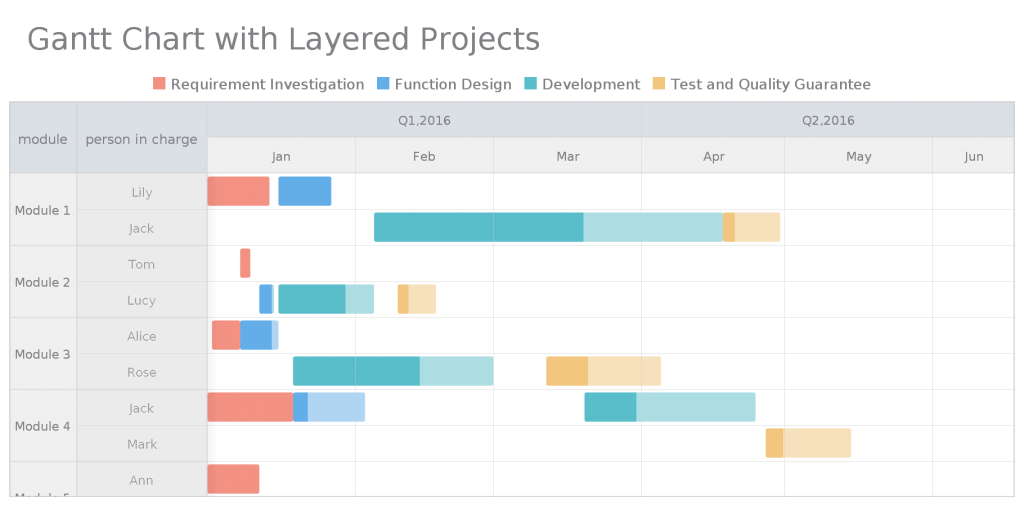
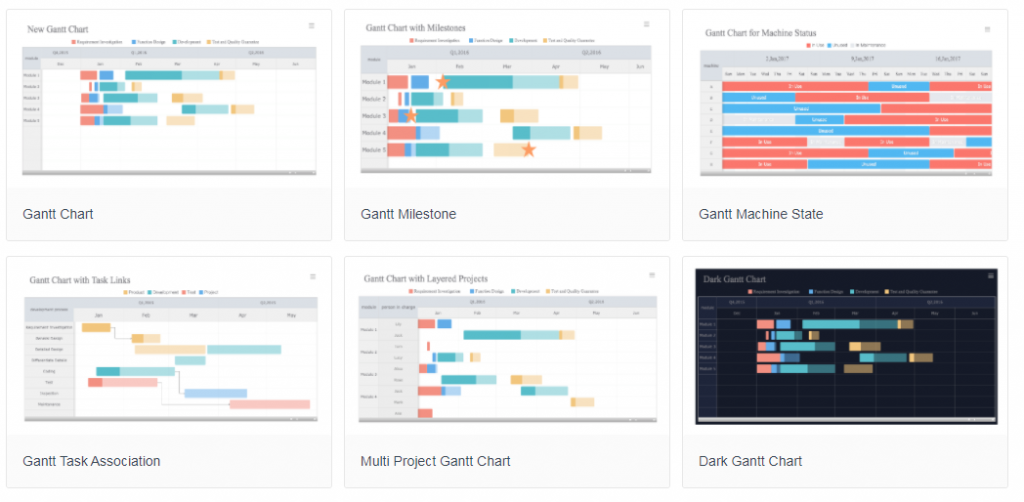
Gantt charts can derive multiple variants according to the purpose, such as marking milestones or displaying the progress of multiple simultaneous tasks. We have created six templates and built them in FineReport for your free application.
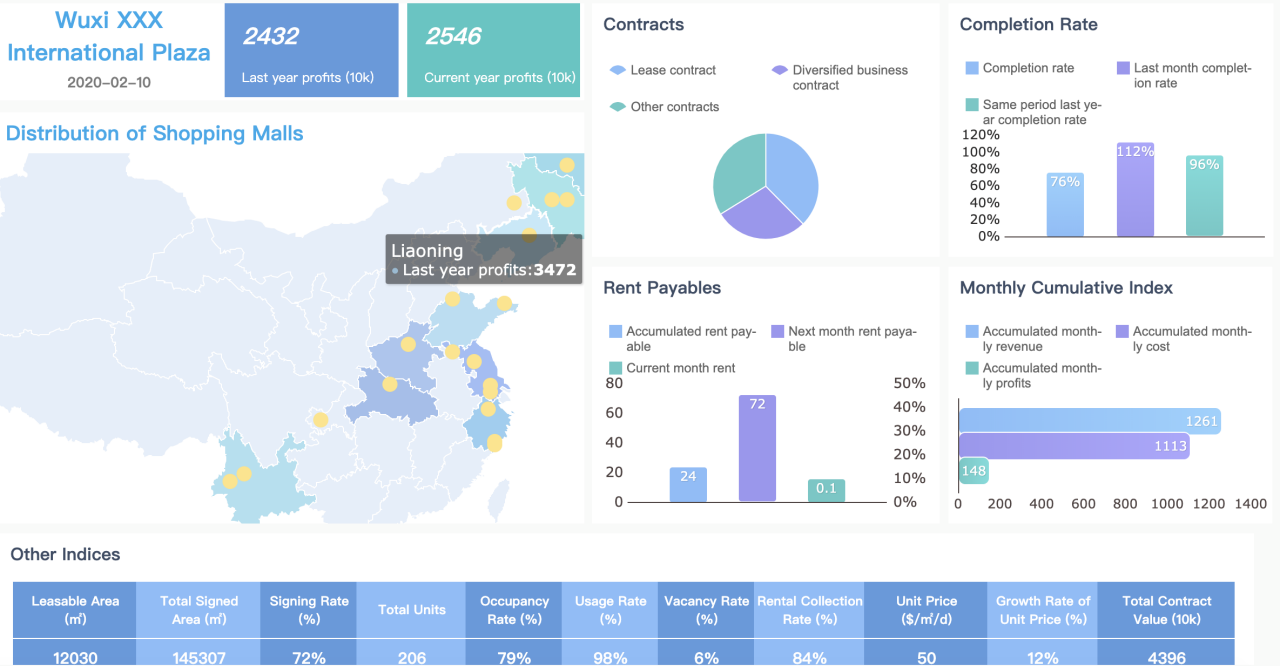
Project Management Dashboard
A project dashboard offers a high-level view of the critical data about your project’s current status. Viewers can track key information such as progress, costs, quality, and risks at a glance.
Optimizing Project Management: Effective Tools
Project management is never a simple task. For instance, absent standards and metrics, asymmetric information, and inefficient data management methods are always the big problems managers face. Many companies are still struggling to tackle project management and wasting money and resources every year.
In response to these problems, we put forward some solutions and suggestions extracted from FineReport‘s years of project management experience. If you want to improve the efficiency of project management, you might as well start from the following aspects.
Multi-source data integration
Gather pertinent project information from dependable sources, including project management software, time-tracking tools, and financial records. Ensure the accuracy, currency, and structured organization of the data to enable smooth integration into the dashboard.
To address this concern, FineReport’s automated reporting system offers a primary feature that establishes a direct connection between the dashboard platform and various databases. FineReport constructs a data center supported by databases, allowing centralized data storage within the system. This data is managed through business data packages and updated in real-time based on the fields in the database.
Consequently, when creating a project management dashboard, you can directly retrieve data from the database. Furthermore, FineReport enables integration with other systems like OA or ERP systems, simplifying the process of locating and extracting data for report generation whenever needed.
Efficiently collaborate with your team
After generating reports templates locally, they can be published, edited, and shared without location constrain. As a result, all stakeholders can access project information.
If the reporting frequency gets scheduled, then every week/month/quarter, the system’s latest information will be automatically structured as a report and sent to the relevant persons’ mailbox.
Worried about someone missing a message? FineReport has a built-in SMS function, as a stronger reminder, which greatly facilitates task communication.
Amazing data visualization of your ideas
FineReport provides 19 categories and over 50 self-developed HTML5 charts, with cool 3D and dynamic effects.
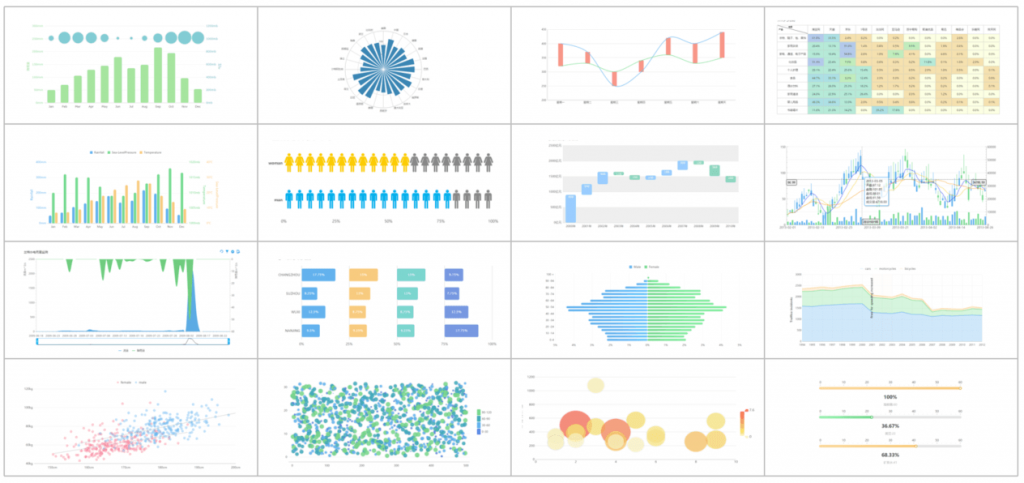
In addition, FineReport has developed chart plug-ins for large screens with a dedicated designer to create dashboards for multi-dimensional data analysis. Various visualization effects, such as auto-play and 3D animation, can be realized simply by drag-and-drop.
Permission management solutions can subdivide into units
Data permission control can ensure data security when collaborating with team members. With permission management, the system assigns permissions to users by different departments, positions, and roles and authorizes them with varying information blocks.
Conclusion
To sum up, as a formal and regular record of a project’s state at a given time, a project management report or dashboard is essential for project management. Although the objectives may vary, some key sections are applicable to all project management reports.
However, manually filling these reports can be onerous for project managers. With the accumulation of practices and experience over the past few years, FineReport has tailored professional solutions and helped companies achieve a more agile management fashion.
Try FineReport to find out how to drive better projects in a simpler, smarter way.
Feel free to make an appointment for a live demo with our product experts. We will be more clear about your needs and see how FineBI can help you and your organization transform data into value.