Markets
Chart: The World’s Largest 10 Economies in 2030
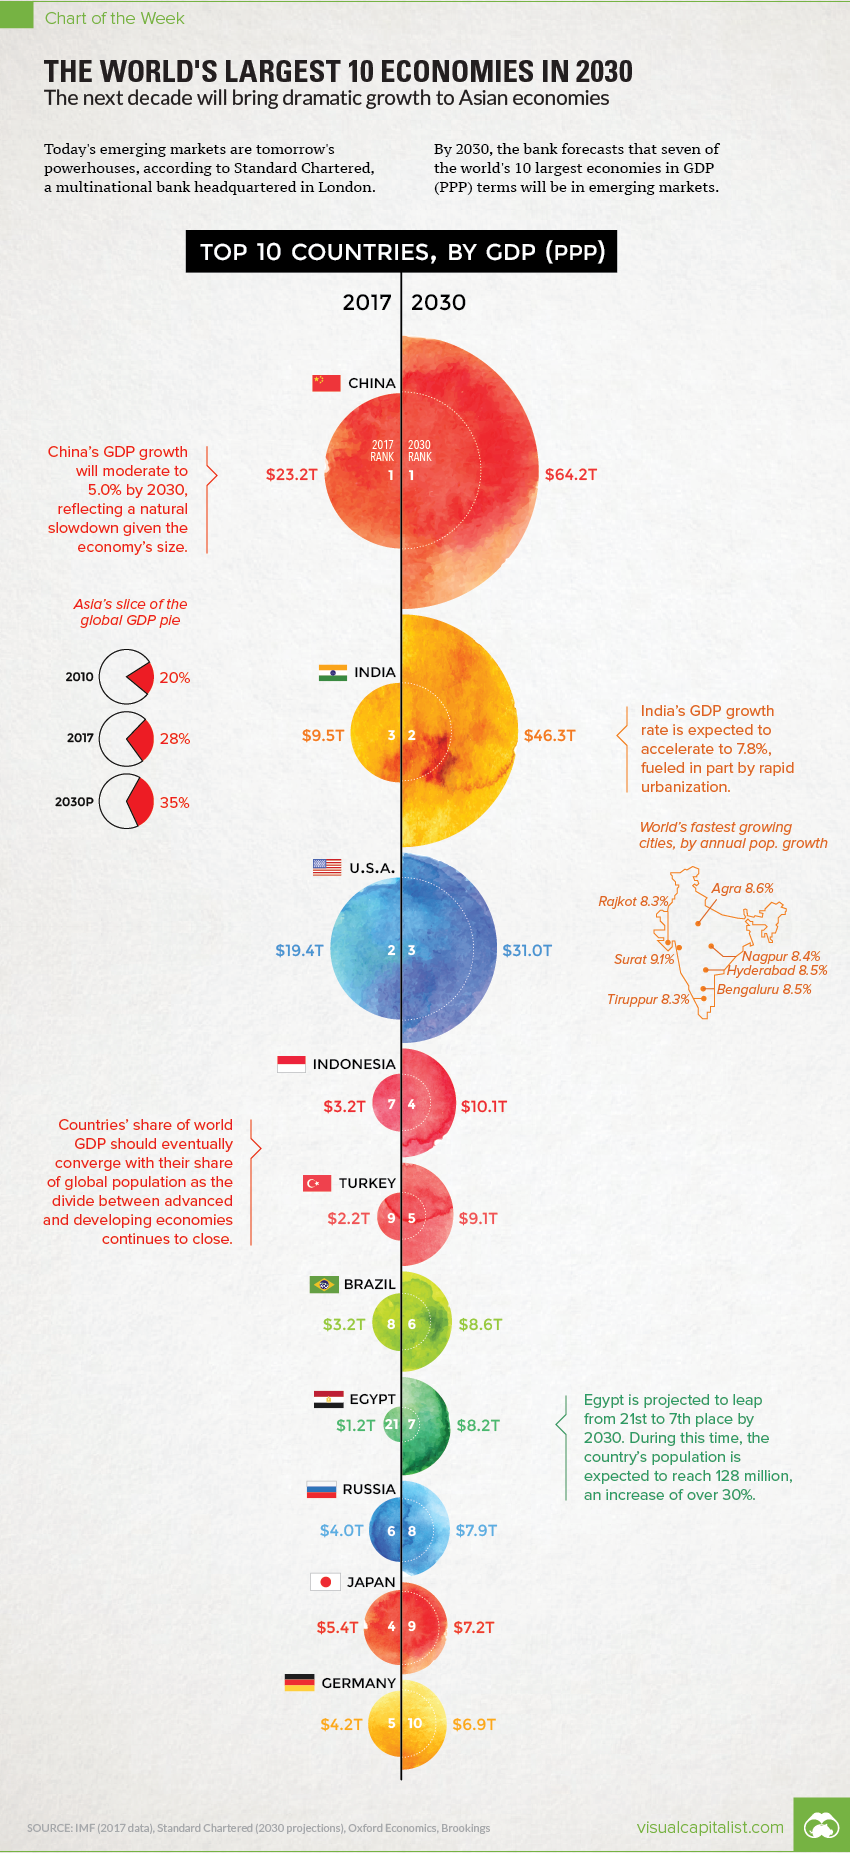
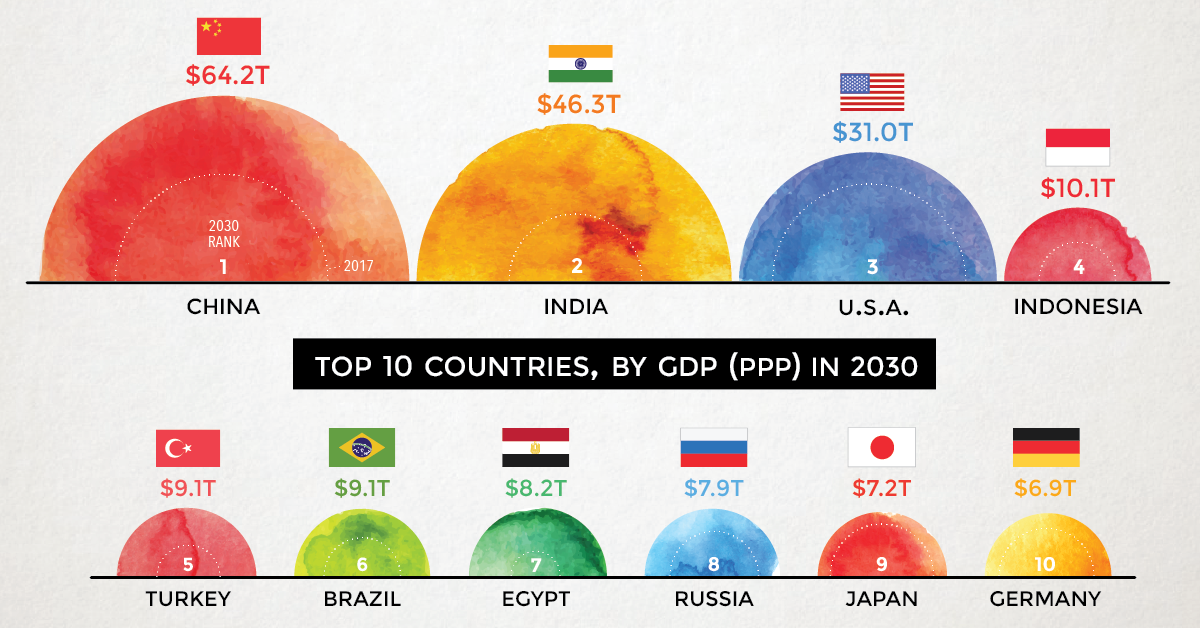
World’s Largest Economies in 2030
The Chart of the Week is a weekly Visual Capitalist feature on Fridays.
Today’s emerging markets are tomorrow’s powerhouses, according to a recent forecast from Standard Chartered, a multinational bank headquartered in London.
The bank sees developing economies like Indonesia, Turkey, Brazil, and Egypt all moving up the ladder – and by 2030, it estimates that seven of the world’s largest 10 economies by GDP (PPP) will be located in emerging markets.
Comparing 2017 vs. 2030
To create some additional context, we’ve compared these projections to the IMF’s most recent data on GDP (PPP) for 2017. We’ve also added in potential % change for each country, if comparing these two data sets directly.
Here’s how the numbers change:
| Rank | Country | Proj. GDP (2030, PPP) | GDP (2017, PPP) | % change |
|---|---|---|---|---|
| #1 | China | $64.2 trillion | $23.2 trillion | +177% |
| #2 | India | $46.3 trillion | $9.5 trillion | +387% |
| #3 | United States | $31.0 trillion | $19.4 trillion | +60% |
| #4 | Indonesia | $10.1 trillion | $3.2 trillion | +216% |
| #5 | Turkey | $9.1 trillion | $2.2 trillion | +314% |
| #6 | Brazil | $8.6 trillion | $3.2 trillion | +169% |
| #7 | Egypt | $8.2 trillion | $1.2 trillion | +583% |
| #8 | Russia | $7.9 trillion | $4.0 trillion | +98% |
| #9 | Japan | $7.2 trillion | $5.4 trillion | +33% |
| #10 | Germany | $6.9 trillion | $4.2 trillion | +64% |
Possibly the biggest surprise on the list is Egypt, a country that Standard Chartered sees growing at a torrid pace over this timeframe.
If comparing using the 2017 IMF figures, the difference between the two numbers is an astonishing 583%. This makes such a projection quite ambitious, especially considering that organizations such as the IMF see Egypt averaging closer to 8% in annual GDP growth (PPP) over the next few years.
The Ascent of Emerging Markets
Egypt aside, it’s likely that the ascent of emerging markets will continue to be a theme in future projections by other banks and international organizations.
By 2030, India will be the second largest economy in PPP terms according to many different models – and by then, it will also be the most populous country in the world as well. (It’s expected to pass China in 2026)
With the divide between emerging and developed economies closing at a seemingly faster rate than ever before, this should be seen as an interesting opportunity for all investors taking a long-term view.


Markets
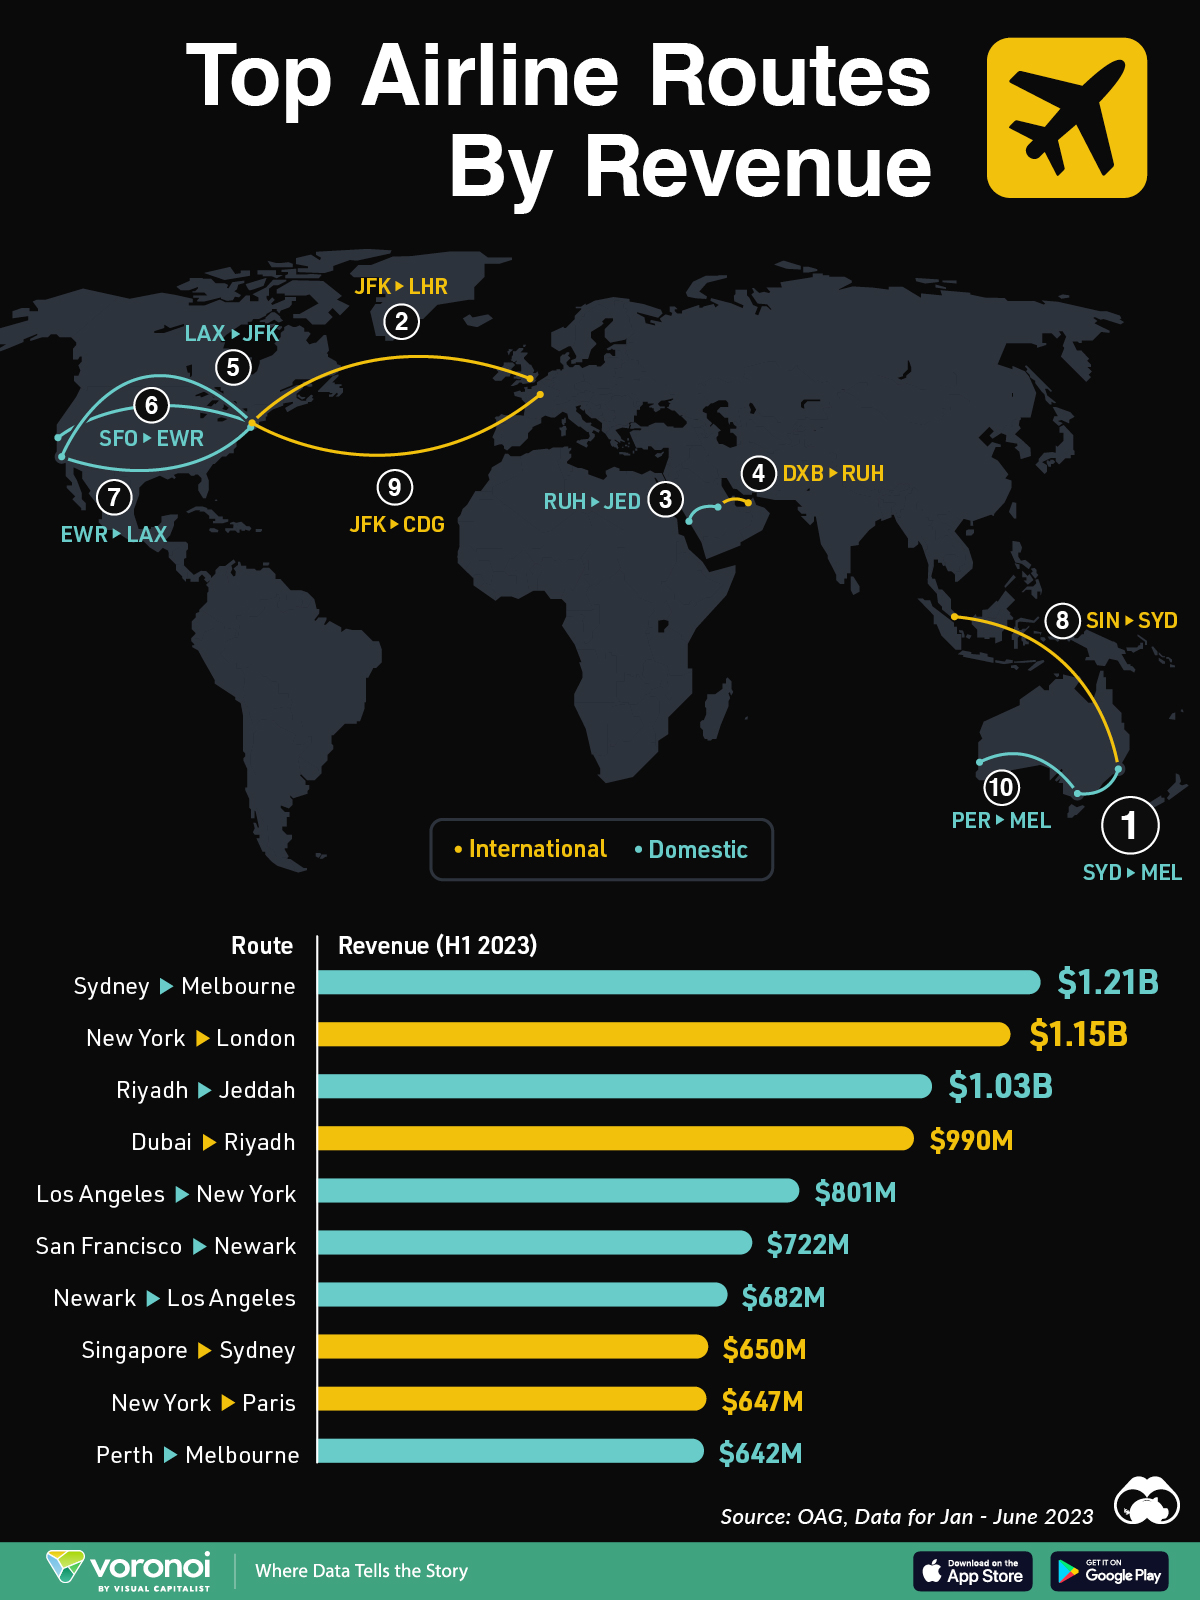
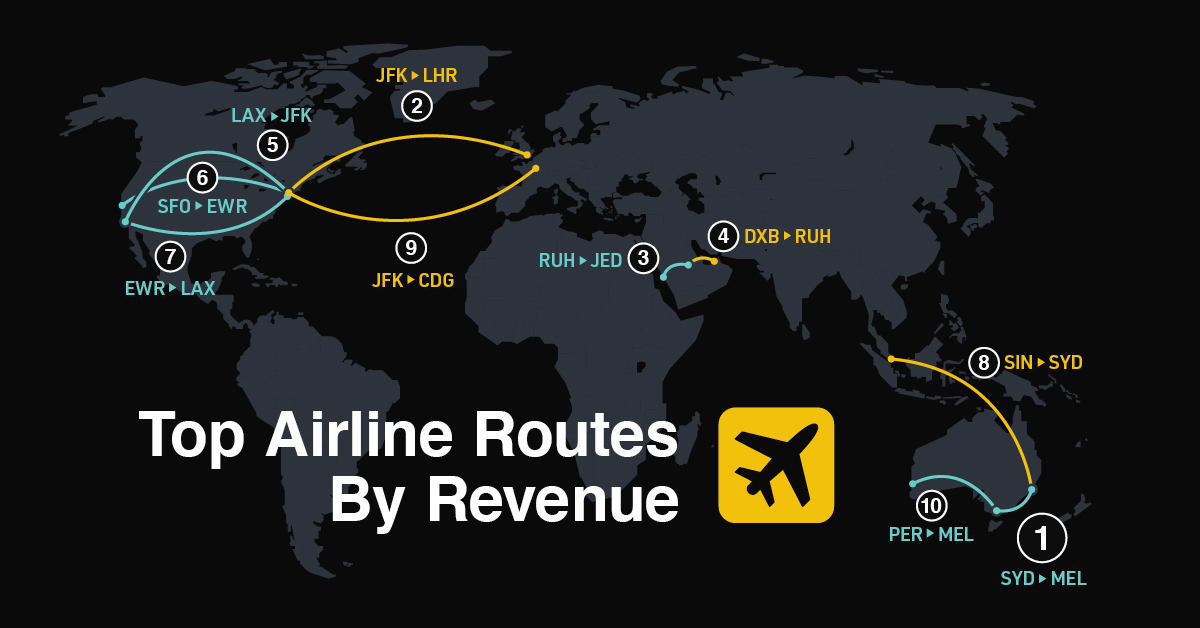
Ranked: The World’s Top Flight Routes, by Revenue
In this graphic, we show the highest earning flight routes globally as air travel continued to rebound in 2023.
The World’s Top Flight Routes, by Revenue
This was originally posted on our Voronoi app. Download the app for free on iOS or Android and discover incredible data-driven charts from a variety of trusted sources.
In 2024, a record 4.7 billion people are projected to travel by air—200 million more than in 2019.
While revenues surged to an estimated $896 billion globally last year, airlines face extremely slim margins. On average, they made just $5.44 in net profit per passenger in 2023. Today, the industry faces pressures from high interest rates, supply chain woes, and steep infrastructure costs.
This graphic shows the highest earning flight routes worldwide, based on data from OAG.
The Top Revenue-Generating Routes in 2023
Below, we show the airline routes with the highest revenues in the first half of 2023:
| Route | Airport Codes | Revenue H1 2023 |
|---|---|---|
| Sydney to Melbourne | SYD-MEL | $1.21B |
| New York to London | JFK-LHR | $1.15B |
| Riyadh to Jeddah | RUH-JED | $1.03B |
| Dubai to Riyadh | DXB-RUH | $990M |
| Los Angeles to New York | LAX-JFK | $801M |
| San Francisco to Newark | SFO-EWR | $722M |
| Newark to Los Angeles | EWR-LAX | $682M |
| Singapore to Sydney | SIN-SYD | $650M |
| New York to Paris | JFK-CDG | $647M |
| Perth to Melbourne | PER-MEL | $642M |
As we can see, domestic flights comprised six of the 10 largest revenue-generating flights, with Sydney to Melbourne ranking first overall, at $1.21 billion.
In fact, this route is earning more than twice that of pre-pandemic levels, even as the number of passengers declined. The flight route is largely dominated by Qantas and Virgin Australia, with Qantas achieving record-breaking domestic earnings margins of 18% in the fiscal year ending in June 2023. Lower fuel costs and soaring ticket prices were key factors in driving revenues.
Furthermore, Qantas and Virgin Australia are major carriers for flights between Melbourne and Perth, another top-earning route.
New York to London, one of the busiest and most profitable routes globally, generated $1.15 billion in revenues, representing a 37% increase compared to the same period in 2019. Overall, the flight route had 3.88 million scheduled airline seats for the full year of 2023.
The highest revenue increase over this period was for flights from Dubai to Riyadh, with revenues surging 416% year-over-year. This two-hour flight, a highly lucrative route between major financial centers, is one of the busiest in the Middle East.

-

 Best of2 weeks ago
Best Visualizations of March on the Voronoi App
-

 Markets1 week ago
Top Emerging Markets for Investment in 2024
-

 Money1 week ago
The Largest Gender Pay Gaps in OECD Countries
-

 Wealth1 week ago
Charted: Donald Trump’s Net Worth (2014-2024)
-

 Technology1 week ago
Visualizing Nvidia’s Revenue, by Product Line (2019-2024)
-

 Finance1 week ago
Visualizing the Revenue of the Big Four Accounting Firms
-

 Misc2 weeks ago
Which U.S. College Major is the Worst for Finding a Job?
-

 Culture2 weeks ago
Ranked: America’s Most Popular Beers, by Generation