- Dow Jones index has bounced up from lows, returning to the session opening level on afternoon trading.
- Market concerns about the Fed’s “higher for longer” stance keep weighing on risk appetite.
- Technical picture remains bearish with DJIA retreating from historic highs reached in March.
The Dow Jones Industrial Average (DJIA) has been trading back and forth around the opening level on Wednesday. Market sentiment remains frail following hawkish comments by Federal Reserve (Fed) Chair Jerome Powell on Tuesday and a string of downbeat quarterly earrings have soured market sentiment.
Powell observed the lack of progress on inflation on Tuesday and resumed the “higher for longer” monetary policy outlook, which is acting to dampen investors’ appetite for risk.
Quarterly earnings data disappointed on Wednesday with Travelers Companies (TRV) reporting profits below estimates, while US Bancorp’s (USB) net interest income fell by 14% in Q1. On the other hand, news that Microsoft is avoiding a formal EU probe over a $13 billion Open AI deal has soothed investors' sentiment.
The main Wall Street indices are still in the red but coming up from session lows. The NASDAQ is leading losses with a 0.63% decline to 15,769, followed by the S&P 500, down 0.32% to 5,035, while the Dow Jones, trades flat, at 37,790.
Dow Jones news
The Technology sector is the worst performer on Wednesday, dropping 1.1%, weighed down by the outlook of high rates for a longer time. Industrials are following on Wednesday with a 0.61% decline. On the positive side, Utilities are up 1.76%, while Financials appreciate 0.34%.
Travelers Companies (TRV) plunges 7.61% to $206.25 following downbeat quarterly earnings. Intel (INTC) is next with a 1.6% drop to $35.67. United Health is the best performer, with a 3.1% rally to $483.78, followed by Goldman Sachs (GS) with a 1.92% gain to $404.5.
Dow Jones technical outlook
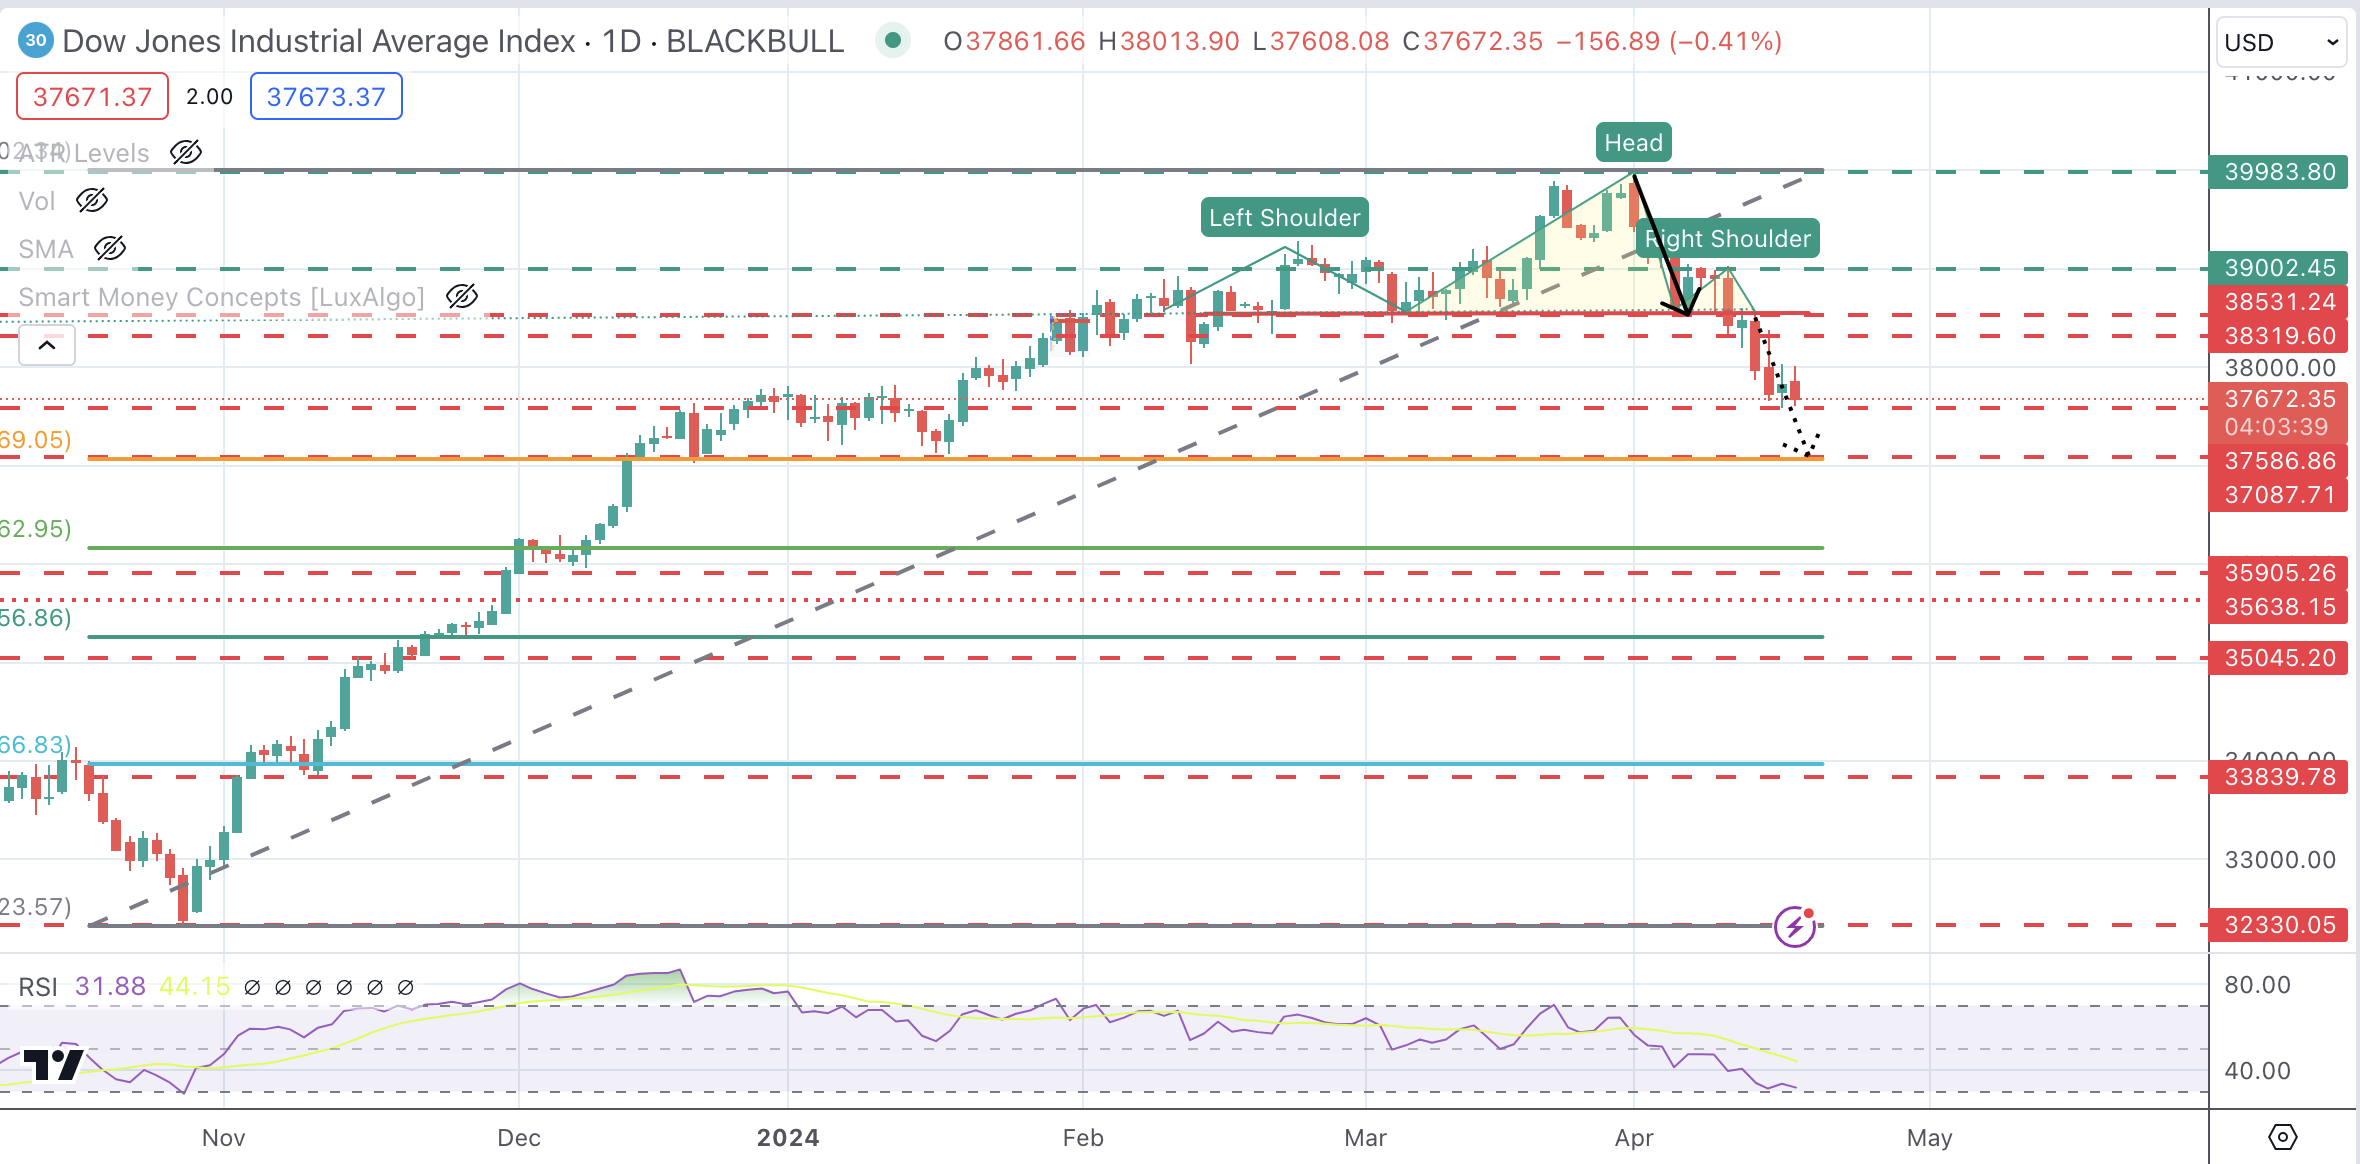
The DJIA index has reversed earlier gains and maintains an overall bearish picture intact. The move below 38,560 has activated a Head & Shoulders pattern that points toward a sharper decline.
Immediate support is 37,586, followed by the measured target of the H&S pattern, which meets the mid-January low and 38.6% Fibonacci retracement at 37,087. A bullish reaction might find resistance at the 38,531 previous support ahead of the 39,000 region (order block).
Dow Jones Index Daily Chart
Dow Jones FAQs
The Dow Jones Industrial Average, one of the oldest stock market indices in the world, is compiled of the 30 most traded stocks in the US. The index is price-weighted rather than weighted by capitalization. It is calculated by summing the prices of the constituent stocks and dividing them by a factor, currently 0.152. The index was founded by Charles Dow, who also founded the Wall Street Journal. In later years it has been criticized for not being broadly representative enough because it only tracks 30 conglomerates, unlike broader indices such as the S&P 500.
Many different factors drive the Dow Jones Industrial Average (DJIA). The aggregate performance of the component companies revealed in quarterly company earnings reports is the main one. US and global macroeconomic data also contributes as it impacts on investor sentiment. The level of interest rates, set by the Federal Reserve (Fed), also influences the DJIA as it affects the cost of credit, on which many corporations are heavily reliant. Therefore, inflation can be a major driver as well as other metrics which impact the Fed decisions.
Dow Theory is a method for identifying the primary trend of the stock market developed by Charles Dow. A key step is to compare the direction of the Dow Jones Industrial Average (DJIA) and the Dow Jones Transportation Average (DJTA) and only follow trends where both are moving in the same direction. Volume is a confirmatory criteria. The theory uses elements of peak and trough analysis. Dow’s theory posits three trend phases: accumulation, when smart money starts buying or selling; public participation, when the wider public joins in; and distribution, when the smart money exits.
There are a number of ways to trade the DJIA. One is to use ETFs which allow investors to trade the DJIA as a single security, rather than having to buy shares in all 30 constituent companies. A leading example is the SPDR Dow Jones Industrial Average ETF (DIA). DJIA futures contracts enable traders to speculate on the future value of the index and Options provide the right, but not the obligation, to buy or sell the index at a predetermined price in the future. Mutual funds enable investors to buy a share of a diversified portfolio of DJIA stocks thus providing exposure to the overall index.
Information on these pages contains forward-looking statements that involve risks and uncertainties. Markets and instruments profiled on this page are for informational purposes only and should not in any way come across as a recommendation to buy or sell in these assets. You should do your own thorough research before making any investment decisions. FXStreet does not in any way guarantee that this information is free from mistakes, errors, or material misstatements. It also does not guarantee that this information is of a timely nature. Investing in Open Markets involves a great deal of risk, including the loss of all or a portion of your investment, as well as emotional distress. All risks, losses and costs associated with investing, including total loss of principal, are your responsibility. The views and opinions expressed in this article are those of the authors and do not necessarily reflect the official policy or position of FXStreet nor its advertisers. The author will not be held responsible for information that is found at the end of links posted on this page.
If not otherwise explicitly mentioned in the body of the article, at the time of writing, the author has no position in any stock mentioned in this article and no business relationship with any company mentioned. The author has not received compensation for writing this article, other than from FXStreet.
FXStreet and the author do not provide personalized recommendations. The author makes no representations as to the accuracy, completeness, or suitability of this information. FXStreet and the author will not be liable for any errors, omissions or any losses, injuries or damages arising from this information and its display or use. Errors and omissions excepted.
The author and FXStreet are not registered investment advisors and nothing in this article is intended to be investment advice.
Recommended content
Editors’ Picks
EUR/USD retreats to 1.0700 after US data

EUR/USD lost its traction and turned negative on the day near 1.0700 in the American session on Tuesday. The data from the US showed that Employment Cost Index rose more than expected in Q1 and provided a boost to the USD.
GBP/USD declines toward 1.2500 on renewed USD strength

GBP/USD turned south and dropped toward 1.2500 in the second half of the day. The US Dollar gathers strength following the strong wage inflation data, forcing the pair to stay on the back foot.
Gold extends daily slide toward $2,300 after US data

Gold stays under bearish pressure and declines toward $2,300 on Tuesday. The benchmark 10-year US Treasury bond yield stays in positive territory above 4.6% after US Employment Cost Index data, weighing on XAU/USD.
XRP hovers above $0.51 as Ripple motion to strike new expert materials receives SEC response

Ripple (XRP) trades broadly sideways on Tuesday after closing above $0.51 on Monday as the payment firm’s legal battle against the US Securities and Exchange Commission (SEC) persists.
Eurozone inflation stable as the outlook on prices gets increasingly muddied

Eurozone headline inflation remains stable at 2.4%. With higher energy prices and improving domestic demand, questions about the direction of inflation become louder.