39 Top Instagram Statistics For 2024 (Users, Market Share, Growth)


Want the latest Instagram statistics?
Instagram is one of the world’s most popular social media platforms.
In this post, we share top Instagram statistics, including general statistics, usage statistics, stats for demographics and more.
Editor’s top picks – Instagram statistics
These are the top Instagram stats from this post:
- Instagram’s market share is 9.78% worldwide. (StatCounter)
- Instagram’s parent company Meta, who also own Facebook, received $134.9 billion in revenue in 2023. (Meta)
- Instagram receives over 2 billion active users every month. (We Are Social)
- On average, users spend 15 hours and 50 minutes on Instagram every month. (We Are Social)
- 12.56% of referrals on Instagram originate from Linktree alone. (Similarweb)
General Instagram statistics
1. Instagram has a global market share of 9.78%
According to data collected by StatCounter, Instagram has the second largest market share in the world out of all social media sites.
This platform has a market share of 9.78%.
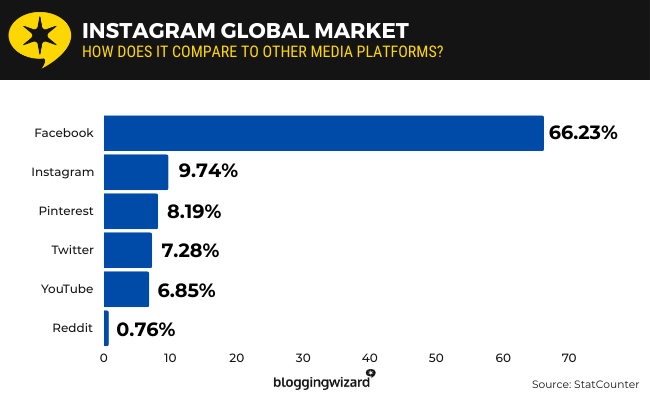
It’s only bested by its sister platform Facebook, which has a huge market share of 66.23%.
Source: StatCounter
2. Meta’s revenue was $134.9 billion in 2023
Facebook’s parent company Meta owns a few popular social media apps, Instagram included.
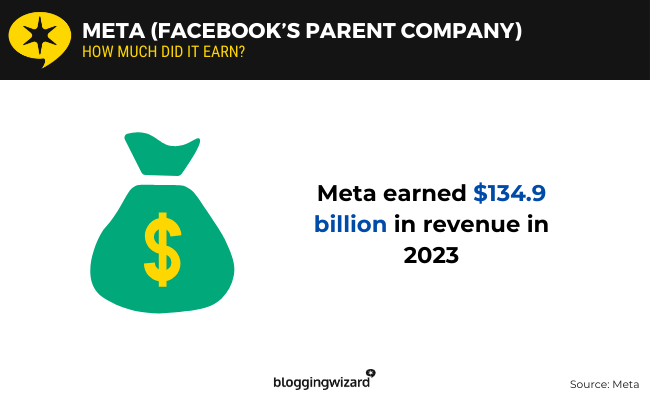
In the company’s fourth quarter financial report for 2023, they stated they earned $134,902 million, or $134.9 billion, in revenue in 2023.
This is a 15.69% increase from 2022’s revenue of $116,609 million.
Source: Meta
3. Instagram is the world’s most favorite social media platform
In We Are Social’s latest report on social media use, they discovered that the majority of internet users, or 16.5%, say Instagram is their preferred social media platform.
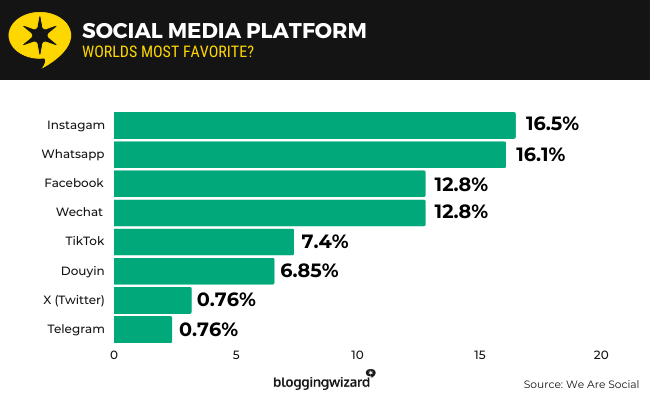
16.1% say WhatsApp, and 12.8% say Facebook.
Source: We Are Social
4. 97.81% of Meta’s revenue in 2023 came from advertising
A large majority of Meta’s revenue comes from advertising through platforms like Facebook and Instagram.
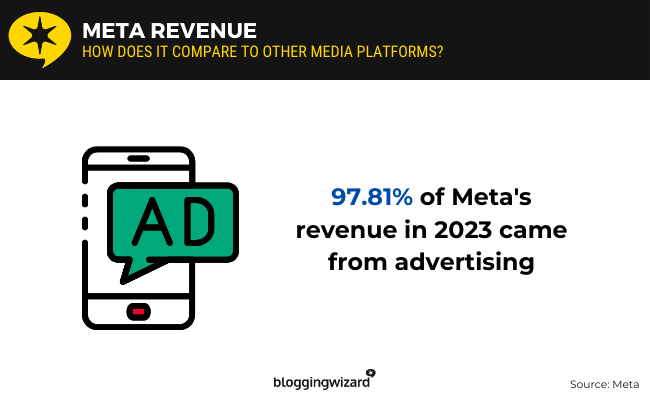
In 2023, $131,948 million of the $134,902 million in revenue Meta earned in 2023 came from advertising alone.
Source: Meta
5. 70.4% of Instagram users use the platform to share or post photos and videos
Most Instagram users, or 70.4%, use Instagram to post or share photos and videos.
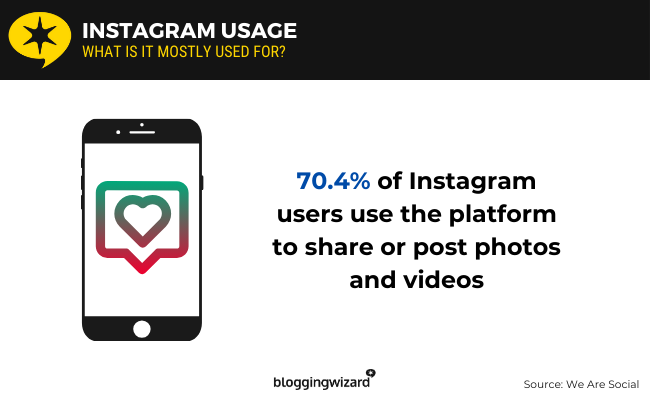
When asked what they mostly use Instagram for, here’s how social media users responded:
- Post or share photos or videos – 70.4% voted for this option
- Looking for funny or entertaining content – 64.8%
- Follow or research brands and products – 62.7%
- Message friends and family – 58.3%
- Keep up to date with news and current events – 52.5%
Source: We Are Social
6. 62.7% of consumers choose Instagram over other social media platforms for brand research
Although 83.1% of respondents chose “any of these eight platforms” when asked about the social media platforms they use to conduct brand research, 62.7% chose Instagram.
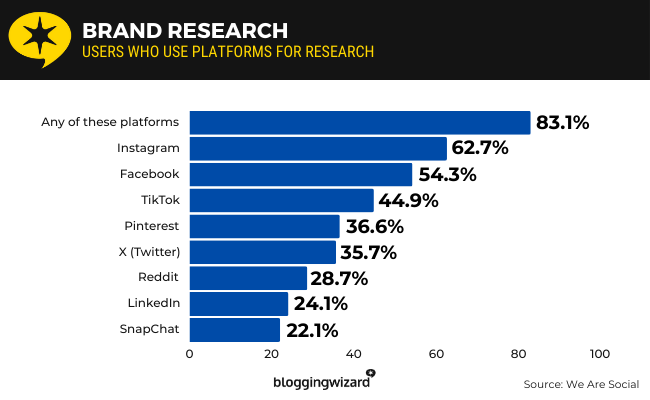
This is more votes than any other platform received:
- Instagram – 62.7% of respondents chose this social media platform
- Facebook – 54.3%
- TikTok – 44.9%
- Pinterest – 36.6%
- X (Twitter) – 35.7%
- Reddit – 28.7%
- LinkedIn – 24.1%
- Snapchat – 22.1%
Unfortunately, YouTube was not an option in this survey despite it being a popular source for video-based product reviews.
Source: We Are Social
7. Cristiano Ronaldo is the most followed account on Instagram with more than 617.5 million followers
According to We Are Social’s latest digital report, Cristiano Ronaldo, who goes by @Cristiano on Instagram, is the most followed account on the platform with more than 617.5 million followers.
This is when you don’t factor in the official Instagram account, which has 666.8 million followers.
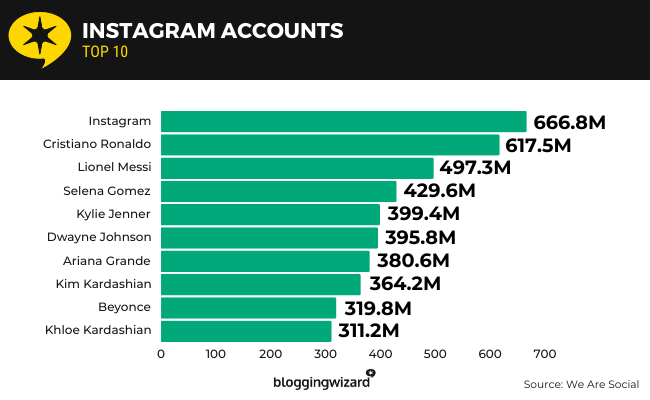
Here are the top 10 most followed accounts on Instagram, excluding Instagram itself:
- Cristiano Ronaldo – 617.5 million followers
- Lionel Messi – 497.3 million
- Selena Gomez – 429.6 million
- Kylie Jenner – 399.4 million
- Dwayne Johnson – 395.8 million
- Ariana Grande – 380.6 million
- Kim Kardashian – 364.2 million
- Beyoncé – 319.8 million
- Khloé – 311.2 million
- Nike – 306.6 million
Source: We Are Social
8. Lionel Messi’s World Cup final post is the most liked Instagram post with over 75 million likes
According to Guinness World Records, the post Lionel Messi published following Argentina’s 2022 World Cup final win is the most liked post on Instagram.
The post has 75,509,256 likes.
In fact, Lionel Messi’s posts make up eight of the top 20 most liked Instagram posts.
Source: Guinness World Records, Wikipedia, Instagram
9. #love is the most used hashtag on Instagram with more than 2.15 billion posts
According to data collected in We Are Social’s latest digital report, the #love hashtag is the most used hashtag on the platform. This hashtag has been included in over 2.15 billion posts on the platform.
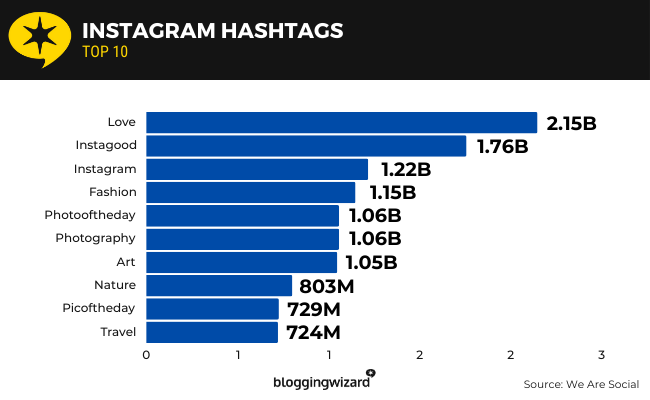
Here are the top 10 hashtags on Instagram by number of posts:
- #love – 2.15 billion posts
- #instagood – 1.76 billion
- #instagram – 1.22 billion
- #fashion – 1.15 billion
- #photooftheday – 1.06 billion
- #photography – 1.06 billion
- #art – 1.05 billion
- #nature – 803 million
- #picoftheday – 729 million
- #travel – 724 million
Source: We Are Social
10. Instagram’s Threads app surpassed over 100 million users within five days of launch
Instagram’s text-based social media app launched on July 5, 2023 and surpassed more than 100 million users by July 10.
However, the growth slowed significantly shortly after as the app only has over 130 million users as of February 2024.
Source: The Verge, Statista
Instagram usage statistics
11. Instagram has 2 billion monthly active users
Instagram is tied in third place with WhatsApp on the list for the most used social media apps in the world.
Instagram has 2 billion monthly active users.
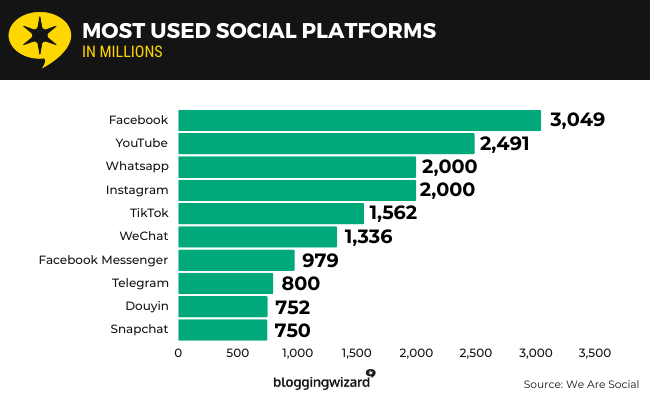
It’s behind Facebook, who has 3.05 billion monthly active users, and YouTube, who has 2.49 billion.
Source: We Are Social
12. Instagram.com receives 6.81 billion visits per month
According to Similarweb, Instagram.com receives 6.81 billion visits per month on average.
The site ranks #4 globally on Similarweb’s list and #7 on Semrush’s.
Source: Similarweb, Semrush
13. 10.03% of web traffic referrals originate from Instagram
Although the majority of web traffic referrals, or 64.79%, come from Facebook, 10.03% originate from Instagram.
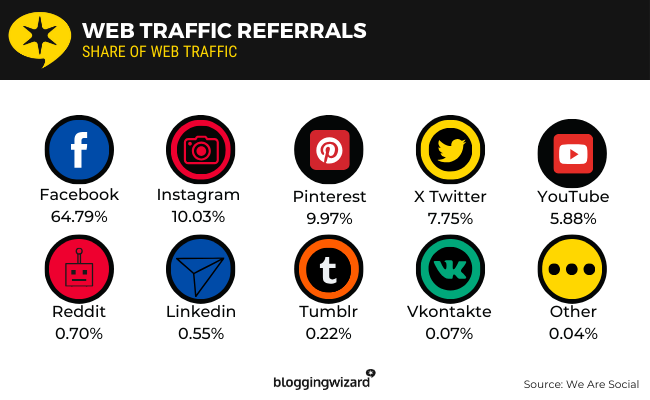
This makes Instagram the second largest source of all referrals on the internet.
Source: We Are Social
14. Instagram users spend 15 hours and 50 minutes on the platform every month
On average, internet users spend 15 hours and 50 minutes on Instagram per month.
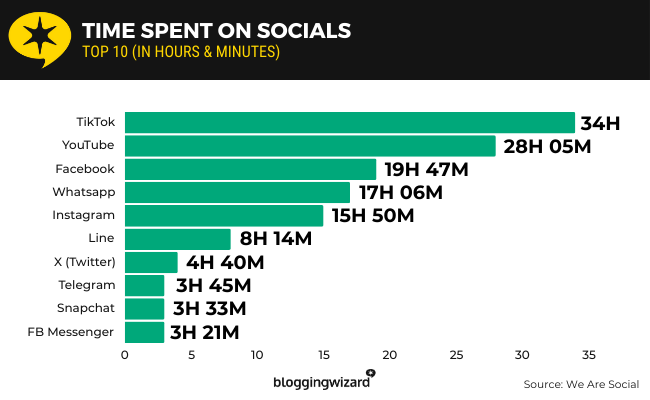
This makes Instagram the fifth most-used platform in terms of time spent.
Source: We Are Social
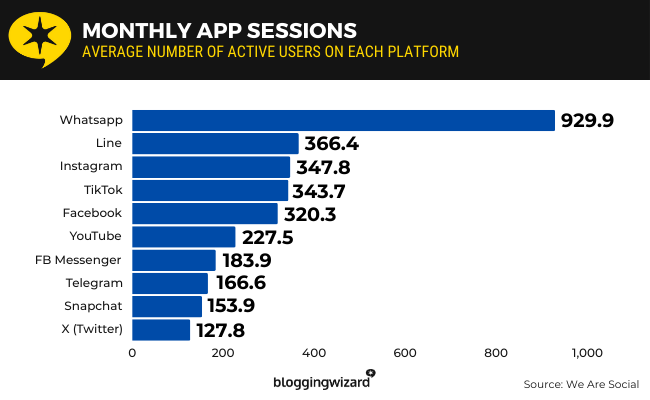
15. Instagram users open the Instagram app 347.8 times per month
We Are Social states that Instagram comes in third in terms of platforms with the most number of sessions per month per user.
On average, Instagram users open the app 347.8 times every month.
Source: We Are Social
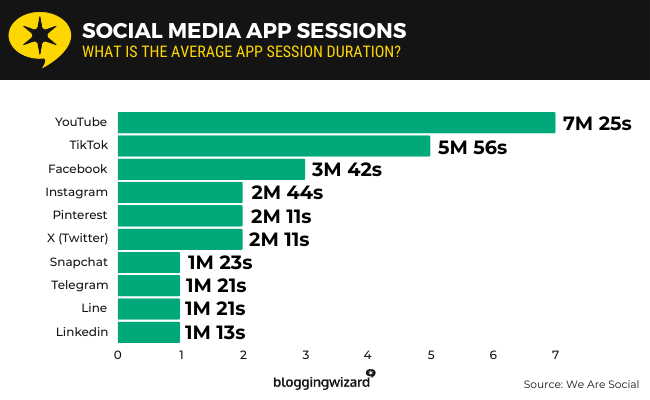
16. Instagram users spend 2 minutes and 44 seconds in the app per session
According to We Are Social’s data, Instagram comes in fourth place in terms of time spent per app session.
Instagram users spend two minutes and 44 seconds in the app per session on average.
Source: We Are Social
17. 80.8% of Instagram’s users are also Facebook users
According to We Are Social’s data, 80.8% of Instagram’s user base are also Facebook users.
77.4% are YouTube users, and 76.7% use WhatsApp.
Source: We Are Social
18. Instagram’s bounce rate is 35.38%
Similarweb’s data on Instagram’s website performance goes on to say that the site’s bounce rate is 35.38%.
Visitors remain on the site for an average of eight minutes and 21 seconds per session and visit an average of 11.52 pages each time.
Source: Similarweb
19. 60.55% of Instagram’s traffic is direct
Because Instagram is so universally known, the majority of its traffic, or 60.55%, is direct while most websites rely on organic traffic.
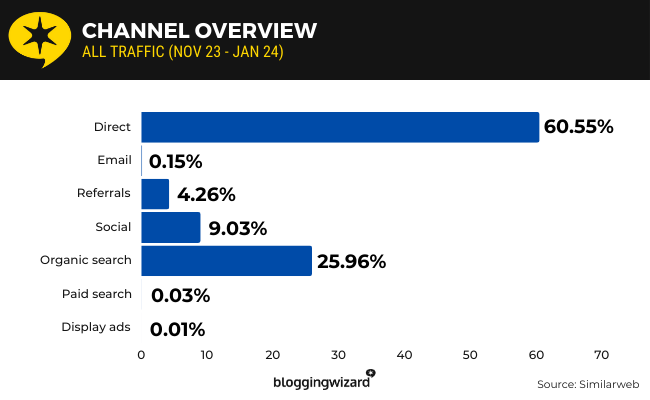
25.95% of Instagram’s traffic is organic, 9.03% comes from social media and 4.26% comes from referrals.
Source: Similarweb
20. 12.56% of Instagram’s referrals originate from Linktree referrals
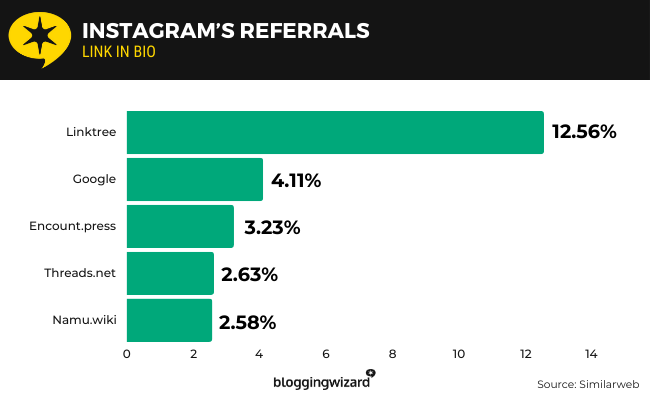
Because Instagram doesn’t allow you to insert links in posts and only allows you to assign one link to your profile bio, many users create splash pages filled with many links and assign that web page to their bios.
Tools that allow you to do this are called link in bio tools, and Linktree is one of the most popular options for Instagram users.
In fact, the majority of Instagram’s referrals, or 12.56%, come from Linktree alone.
Source: Similarweb
Related Reading: The Top LinkTree Alternatives Compared.
21. 41.20% of Instagram’s referrals from social media originate from Facebook
According to Similarweb, the majority of Instagram’s social traffic, or 41.20%, comes from Facebook.
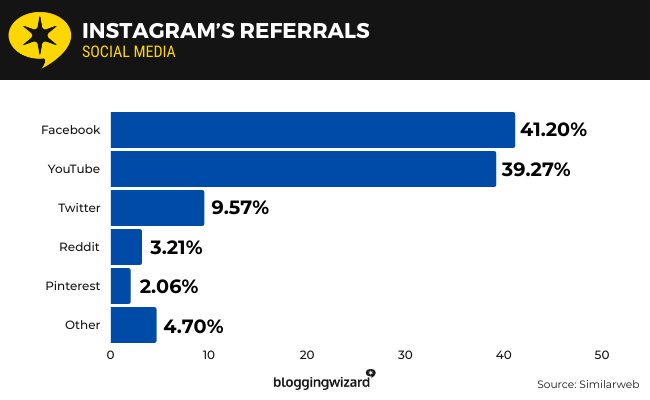
39.27% comes from YouTube while 9.57% comes from X (Twitter).
Source: Similarweb
Instagram demographics statistics
22. 17.08% of Instagram’s visitors originate from the United States
According to Similarweb’s data, the majority of Instagram’s visitors, or 17.08%, are from the United States.
11.37% are from India, and 10.29% are from Brazil.
Source: Similarweb
23. 53.84% of Instagram’s visitors are male
Similarweb’s data states that 53.84% of Instagram’s visitors are male.
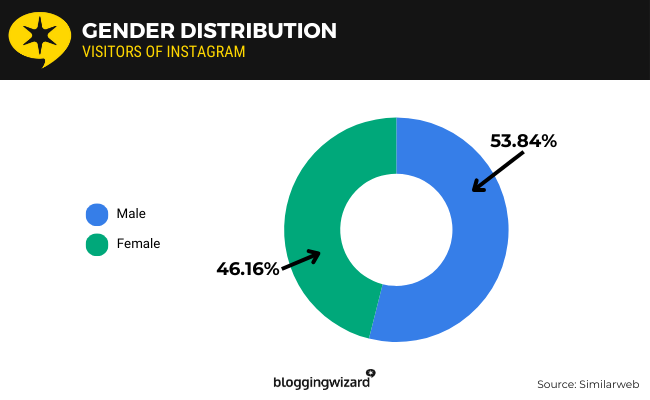
46.16% are female.
Source: Similarweb
24. 31.22% of Instagram’s visitors are between the ages of 25 and 34
The majority of Instagram’s visitors are in the 25 to 34 age demographic.
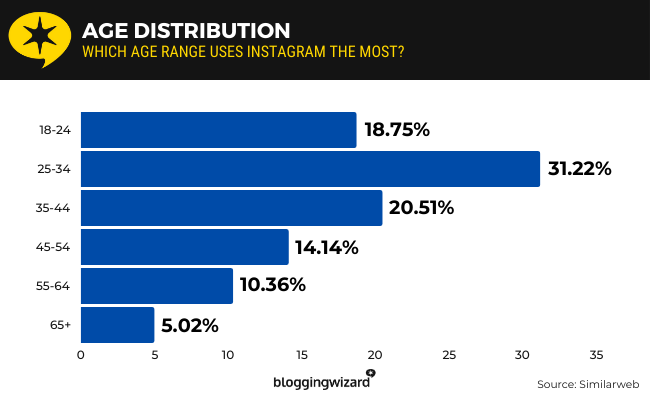
20.51% are 35 to 44 while 18.75% are 18 to 24.
Source: Similarweb
25. 25.85% of internet users between the ages of 16 and 24 say Instagram is their favorite social media platform
Instagram is mostly preferred by younger generations.
According to We Are Social’s data, 25.85% of internet users in the 16 to 24 age demographic name Instagram as their favorite social media platform:
- 16 to 24 – 25.85% of internet users in this age demographic say Instagram is their favorite social media platform
- 25 to 34 – 18.8%
- 35 to 44 – 13.35%
- 45 to 54 – 10.05%
- 55 to 64 – 7.95%
Source: We Are Social
Instagram video statistics
26. Instagram Reels receive as much as 67% more engagement than videos
This statistic comes from a study conducted by Conviva and published on Startup Bonsai.
Conviva examined the performance of Instagram Reels published by four North American sports leagues: Major League Baseball (MLB), National Football League (NFL), National Basketball Association (NBA) and National Hockey League (NHL).
They discovered that when teams from these leagues published more Instagram Reels, their engagement per reel would increase in comparison to the engagement rates they received from individual Instagram videos.
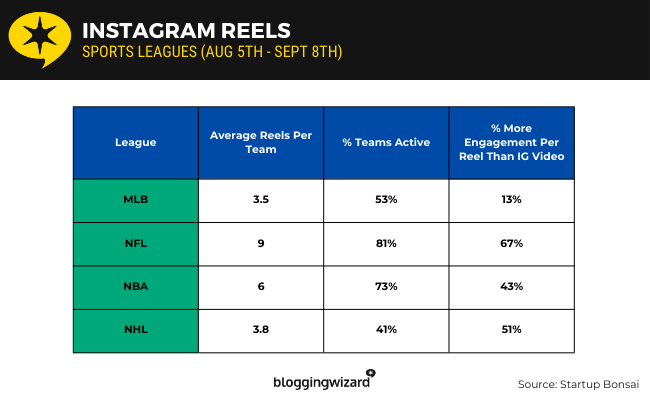
The biggest increase came from the NFL, which saw a per-reel engagement rate that was 67% higher than the average engagement rate teams from this league received from a single Instagram video.
You can view engagement rates for your own account by checking out your Instagram analytics via the Instagram app, or a third-party tool.
Source: Startup Bonsai2
Instagram statistics for business accounts
27. The average growth rate of Instagram Business accounts is +1.09% per month
According to We Are Social’s report, the average monthly growth in follower counts for Instagram Business accounts is +1.09%.
Source: We Are Social
28. Instagram Business accounts publish 1.32 posts to their main feed per day
We Are Social’s data states that professional Instagram accounts publish an average of 1.32 posts to their main feed per day.
Source: We Are Social
29. Brands publish 10 Instagram stories per month on average
According to a study by Rival IQ and published by Startup Bonsai, brands publish around 10 Instagram stories per month on average.
However, the top 25% of brands publish 16.1 stories per month on average while the bottom 25% only publish six.
Publishing stories used to be somewhat time consuming. However, most Instagram schedulers can now publish stories to Instagram.
Source: Startup Bonsai3
30. 39.8% of Instagram Business accounts’ main feed posts are photos
The majority of main feed posts, or 39.8%, published by Instagram Business accounts are photos.
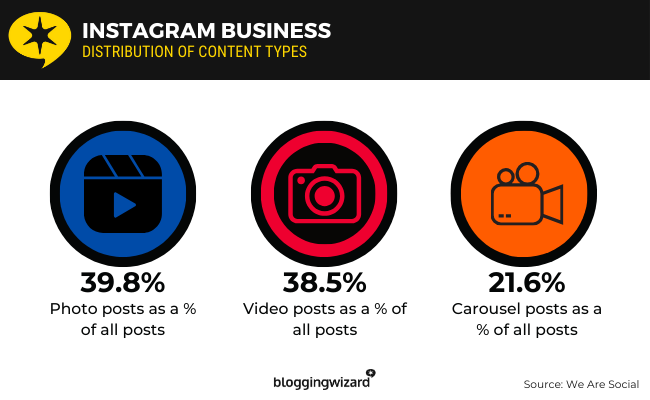
38.5% are videos while 21.6% are carousel posts.
Source: We Are Social
31. The average Instagram engagement rate is 5.77% for all post types
When We Are Social looked at the engagement rates Instagram Business accounts receive by post reach, they discovered that these types of accounts received an average engagement rate of 5.77% on all post types.
Source: We Are Social
32. Instagram Business accounts receive an average engagement rate of 6.17% on photo posts
When looking at post reach, Instagram Business Accounts receive the majority of their engagements from image posts.
These types of accounts receive an average engagement rate of 6.17% from this post type.
They receive an average engagement rate of 5.58% from reels and 5.2% from carousel posts.
Source: We Are Social
33. The average engagement rate Instagram Business accounts receive from followers on all post types is 1.89%
Instagram Business accounts receive an average engagement rate of 1.89% from followers on all post types, according to data from We Are Social.
Source: We Are Social
34. Instagram Business accounts receive an average engagement rate of 3.38% from followers on photo posts
Instagram Business Accounts receive the majority of their engagements from followers from photos posts.
They receive an average engagement rate of 3.38% from followers on this post type.
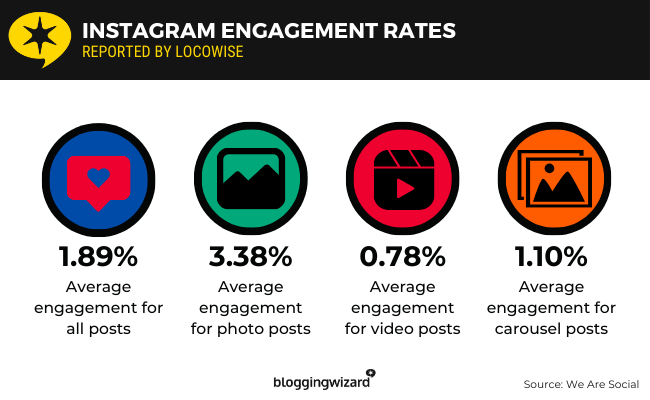
Video posts have an average engagement rate of 0.78% and carousel posts have an average engagement rate of 1.1%.
Source: We Are Social
Instagram advertising statistics
35. Instagram’s advertising audience is made up of 1.32 billion users
This is the number of Instagram users worldwide who can be served ads.
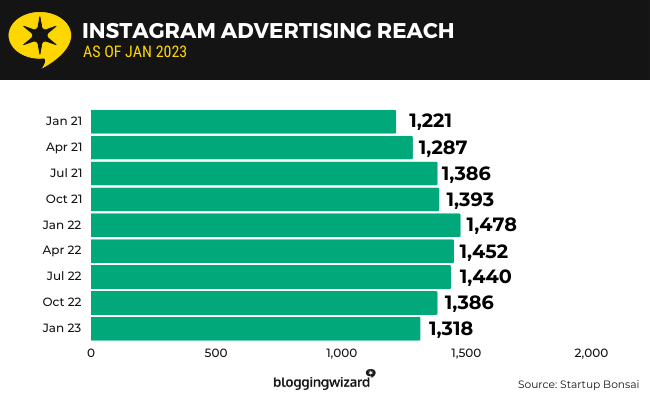
As of January 2023, that number is 1,318 million, or 1.32 billion, users.
Source: Startup Bonsai3
36. India has the largest advertising audience on Instagram with a total reach of 362.9 million users
According to We Are Social’s data, India has the largest advertising audience on Instagram. The country has a total reach of 362.9 million users.
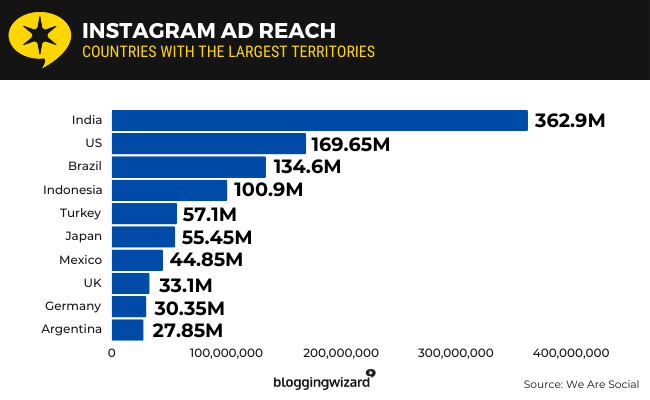
Other large advertising audiences for Instagram include the United States with 169.65 million users, Brazil with 134.6 million and Indonesia with 100.9 million.
Source: We Are Social
37. The cost per click of an Instagram ad is between $0.40 and $0.70
According to Wordstream, Instagram cost per click (CPC) is anywhere between $0.40 and $0.70.
They clarify that this takes all click types into account, including clicks on the ad itself but also clicks that originate from likes, comments and shares.
If the ad has a destination URL, cost per click is much higher. Specifically, ads of this type have a CPC between $0.50 and $0.95.
Source: Wordstream
38. Cost per engagement on Instagram is between $0.01 and $0.05
Wordstream states that cost per engagement is significantly lower than CPC.
Cost per engagement on Instagram falls between $0.01 and $0.05.
Source: Wordstream
39. Cost per 1,000 impressions on Instagram is between $2.50 and $3.50
Wordstream states that cost per 1,000 impressions (CPM) on Instagram ads is between $2.50 and $3.50.
However, this data comes from ads that perform well.
Source: Wordstream
Sources
- StatCounter
- Meta
- We Are Social
- Guinness
- Wikipedia
- The Verge
- Statista
- Semrush
- Startup Bonsai1
- Startup Bonsai2
- Startup Bonsai3
- Wordstream
Final thoughts
That concludes our list of the top Instagram statistics.
Instagram remains to be one of the world’s most favorite social media platforms, especially among younger generations.
If you’re a brand on Instagram, consider putting more thought into your Instagram marketing strategy by dabbling in influencer marketing or at least uploading one Instagram story per day.
Read our post on Instagram tools if you want to manage your Instagram strategy more efficiently.