Markets
Animation: The Largest Public Companies by Market Cap (2000–2022)
Article/Editing:
The Largest Public Companies by Market Cap (2000–2022)
The 10 largest public companies in the world had a combined market capitalization of nearly $12 trillion as of July 2022.
But two decades ago, the players that made up the list of the largest companies by market capitalization were radically different—and as the years ticked by, emerging megatrends and market sentiment have worked to shuffle the deck multiple times.
This racing bar chart by Truman Du shows how the ranking of the top 10 largest public companies has changed from 2000 to 2022.
Market Cap vs. Market Value
Before diving in, it’s worth noting that market capitalization is just one of many metrics that can be used to help value a company.
Simply put, a company’s market cap measures the combined price of a company’s outstanding shares—in other words, it’s the price someone would pay if they wanted to purchase the company outright at current stock prices (theoretically speaking).
But while a market cap provides insight into what equity is worth at a given time, calculating the market value is far more complicated and nuanced. After all, a price paid might not reflect the actual value of a business. To get a measure of value, other metrics like a company’s price-to-sales (P/S) ratio, price-to-earnings (P/E) ratio, or return-on-equity (ROE) may be considered.
The Largest Public Companies by Market Cap (2000–2022)
Over the last two decades, investor sentiment has shifted as different trends have played out, and the types of companies buoyed up by the market have changed as well.
For instance, tech and telecom companies were big in the very early 2000s, as investors got excited about the seemingly endless potential of the newly-introduced World Wide Web.
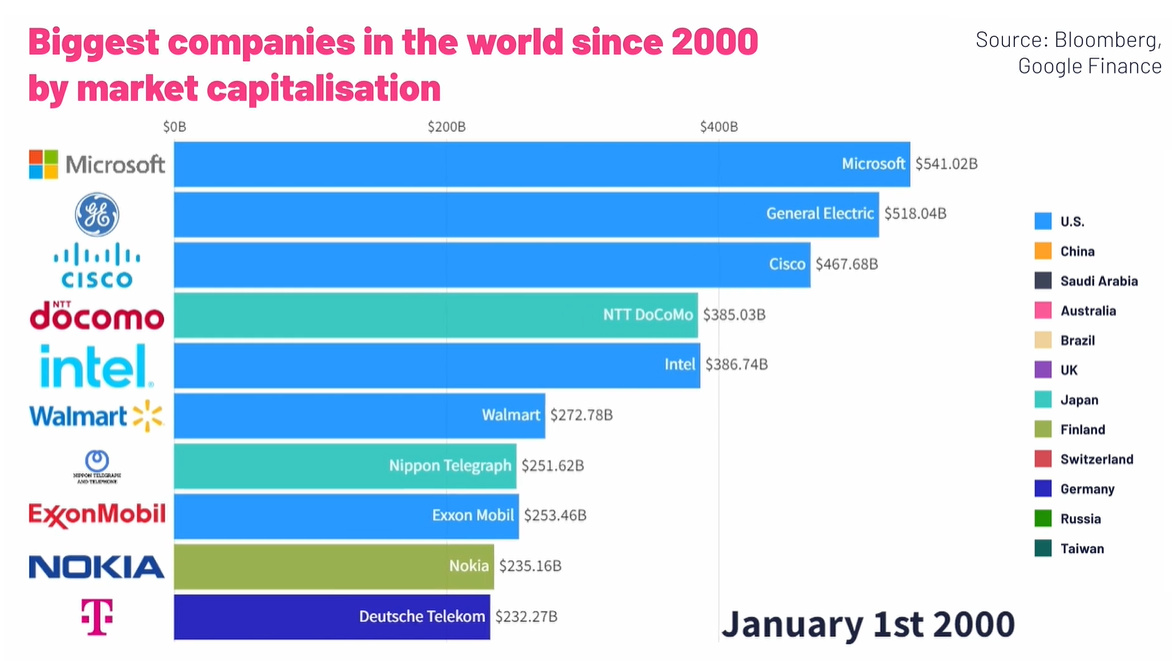
Largest Companies by Market Cap (January 1, 2000)
| Rank | Company | Market Cap (Jan 1, 2000) |
|---|---|---|
| #1 | 🇺🇸 Microsoft | $606 billion |
| #2 | 🇺🇸 General Electric | $508 billion |
| #3 | 🇯🇵 NTT Docomo | $367 billion |
| #4 | 🇺🇸 Cisco | $352 billion |
| #5 | 🇺🇸 Walmart | $302 billion |
| #6 | 🇺🇸 Intel | $280 billion |
| #7 | 🇯🇵 Nippon Telegraph | $271 billion |
| #8 | 🇫🇮 Nokia | $219 billion |
| #9 | 🇺🇸 Pfizer | $206 billion |
| #10 | 🇩🇪 Deutsche Telekom | $197 billion |
In the middle of the Dotcom bubble, investors were pouring money into internet-related tech startups. As PC and internet adoption picked up, investors hoped to “get in early” before these companies started to really turn a profit. This overzealous sentiment is reflected in the market capitalizations of public companies at the time, especially in the tech or telecom companies that were seen as benefitting from the internet boom.
Of course, the Dotcom bubble was not meant to last, and by January 2004 the top 10 list was looking much more diverse. At this time, Microsoft had lost the top spot to General Electric, which had a market cap of $309 billion. Then in the late 2000s, energy companies such as ExxonMobil, PetroChina, Gazprom, and BP took over the list as oil prices spiked well over $100 per barrel.
But fast forward to 2022, and we’ve come full circle, with Big Tech back in the limelight again.
Largest Companies by Market Cap (July 1, 2022)
| Rank | Company | Market Cap (Jul 1, 2022) |
|---|---|---|
| #1 | 🇸🇦 Saudi Aramco | $2.27 trillion |
| #2 | 🇺🇸 Apple | $2.25 trillion |
| #3 | 🇺🇸 Microsoft | $1.94 trillion |
| #4 | 🇺🇸 Alphabet | $1.43 trillion |
| #5 | 🇺🇸 Amazon | $1.11 trillion |
| #6 | 🇺🇸 Tesla | $707 billion |
| #7 | 🇺🇸 Berkshire Hathaway | $612 billion |
| #8 | 🇺🇸 United Health Group | $485 billion |
| #9 | 🇺🇸 Johnson & Johnson | $472 billion |
| #10 | 🇨🇳 Tencent | $435 billion |
Four of the five largest companies are in tech, and Tencent also cracks the list. Meanwhile, Tesla is classified as an automotive company, but it is thought of as an “internet of cars” company by many investors.
Big Picture Trends in the Top 10 by Market Cap List
| Year | Description | Top Company (Market Cap USD) | Top 10 Description |
|---|---|---|---|
| 2000 | Dotcom Bubble | Microsoft ($606B) | Multiple tech/telecom companies in the mix |
| 2004 | Post-Bubble | GE ($309B) | Diverse mix of companies by industry |
| 2009 | Financial Crisis | PetroChina ($367B) | Six non-U.S. companies make the list |
| 2014 | $100 Oil | Apple ($560B) | Last year of oil-dominated list; tech starts ascending |
| 2022 | Big Tech Era | Aramco ($2,270B)* | Tech accounts for 80% of Top 5 companies |
*As of July 1, 2022. Since then, Saudi Aramco has been re-surpassed by Apple due to a reversal in oil prices.
Trending Downwards?
Amidst rising interest rates, crippling inflation, and political issues like the ongoing conflict in Ukraine, signs point towards a potential global recession. Tech companies fared well during the COVID-19 pandemic, but will likely not be immune to the impacts of a generalized economic slowdown.
It’ll be interesting to see how things pan out in 2023, and which companies (if any) will manage to stay on top throughout the turmoil.

This article was published as a part of Visual Capitalist's Creator Program, which features data-driven visuals from some of our favorite Creators around the world.


Markets
Ranked: The Most Valuable Housing Markets in America
The U.S. residential real estate market is worth a staggering $47.5 trillion. Here are the most valuable housing markets in the country.
The Most Valuable Housing Markets in America
This was originally posted on our Voronoi app. Download the app for free on iOS or Android and discover incredible data-driven charts from a variety of trusted sources.
The residential real estate market in the U.S. stands as one of the largest asset classes in the country, worth $47.5 trillion in 2023.
Despite a slowdown in home sales, the total value of homes increased $2.4 trillion last year as low inventory levels pushed up prices. Affordable metropolitan areas saw steady price growth, while expensive metros experienced slower price appreciation.
This graphic shows America’s most valuable housing markets, using data from Redfin.
Top U.S. Residential Real Estate Markets
To calculate the largest U.S. housing markets, Redfin analyzed 90 million properties covering single-family homes, townhouses, condos, and two-to four-unit multifamily properties.
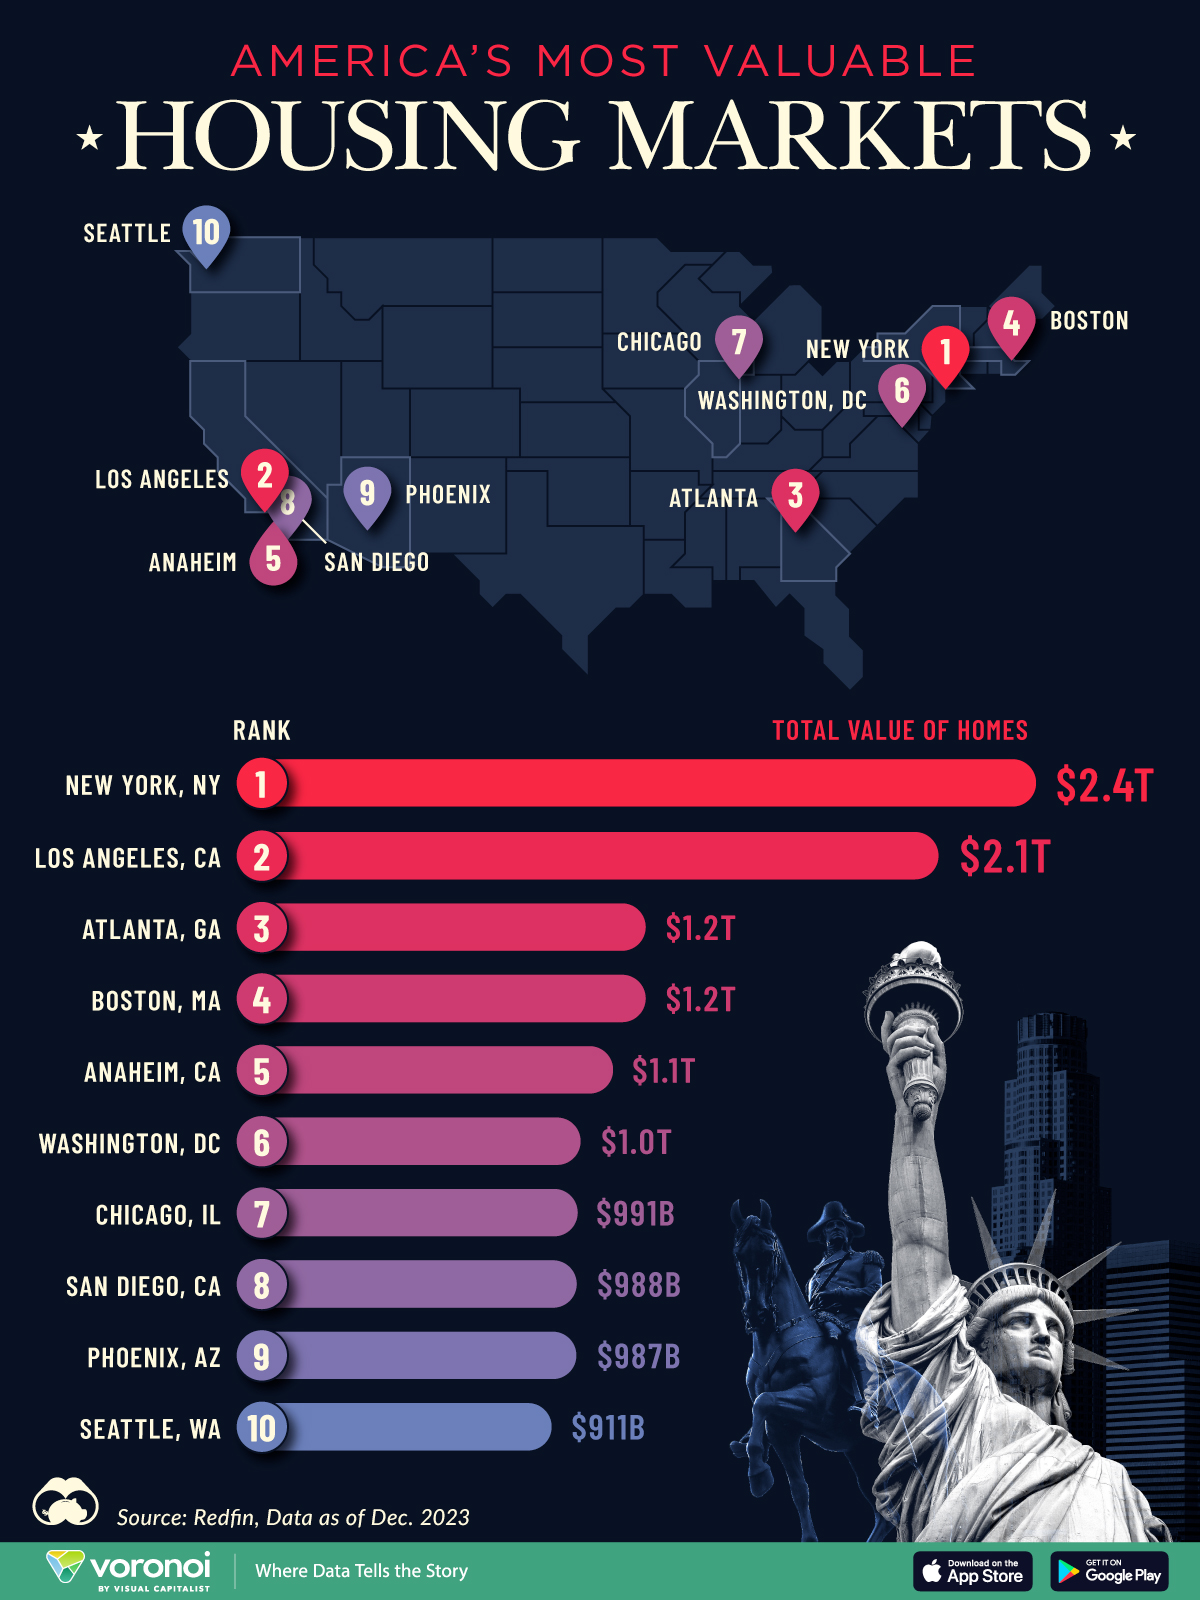
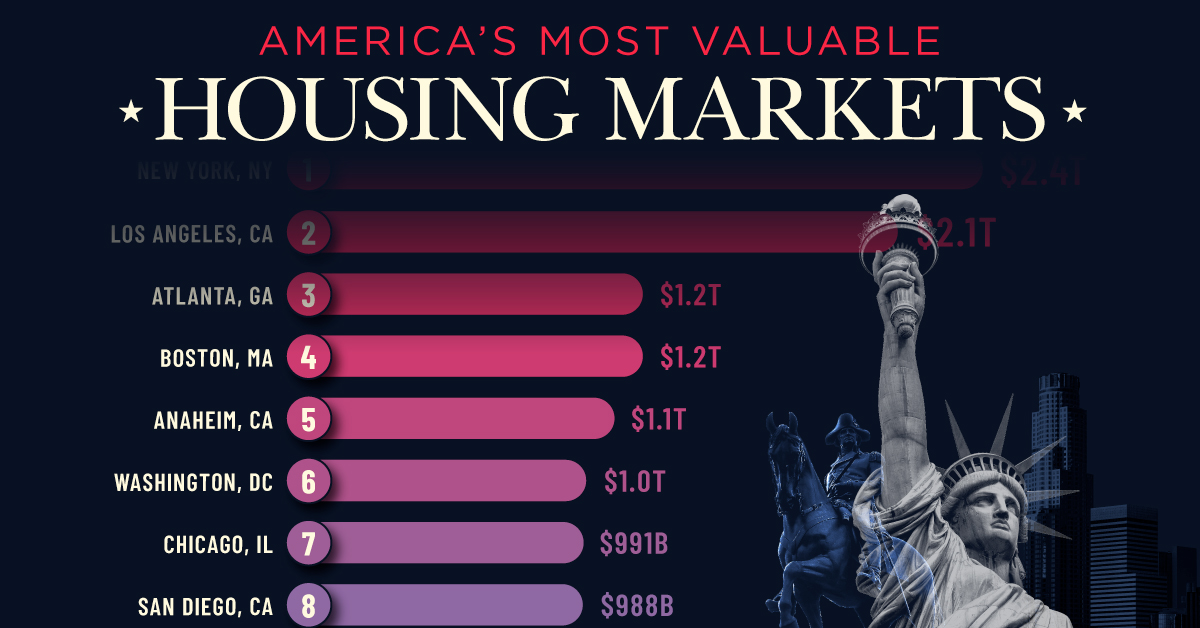
Below, we show the most valuable residential markets as of December 2023:
| Rank | U.S. Metro | Total Value of Homes | Total Value of Homes YoY Change |
|---|---|---|---|
| 1 | New York, NY | $2.4T | -1.0% |
| 2 | Los Angeles, CA | $2.1T | +4.3% |
| 3 | Atlanta, GA | $1.2T | +6.2% |
| 4 | Boston, MA | $1.2T | +8.3% |
| 5 | Anaheim, CA | $1.1T | +8.0% |
| 6 | Washington, DC | $1.0T | +6.2% |
| 7 | Chicago, IL | $991B | +7.4% |
| 8 | San Diego, CA | $988B | +9.4% |
| 9 | Phoenix, AZ | $987B | +4.2% |
| 10 | Seattle, WA | $911B | +4.6% |
With a housing market worth $2.4 trillion, New York, NY tops the list.
Unlike the majority of large U.S. cities, the aggregate value of homes declined as buyers became increasingly priced out of the market. At the same time, homeowners hesitated to sell in order to lock in low mortgage rates. In fact, more than 80% of mortgage holders in New York City have interest rates that are 5% or lower.
Los Angeles, CA falls in second, with a residential real estate market worth $2.0 trillion. Last year, existing home sales tumbled 24.8%, falling to the lowest point since 2007. However, the housing shortage led prices to increase amid high demand. The median sale price climbed to $975,000 in February 2024, a 5.9% jump compared to the same time last year.
Atlanta, GA ranks third and is the most overpriced housing market in the country according to one countrywide analysis. Homes have been selling for 41.7% more than their worth as of the February 2024 data update.
People are flocking to the city for many reasons. General housing affordability is a major driver, along with its thriving tech center. Along with this, state tax credits have increasingly made it a hub for the TV and film industries, earning it the moniker “Y’allywood”. Another factor in Atlanta’s inflating housing market are large investment firms, which own a huge footprint of homes in the city.
Editor’s note: For those wondering about the Bay Area, the data groups cities like San Francisco ($657 billion), San Jose ($821 billion), and Oakland ($881 billion) as individual entities, which puts them outside the cutoff. See the Redfin data for the full list of cities.

-
 Crime2 weeks ago
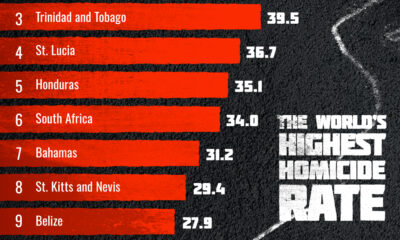
Visualizing the Most Dangerous Countries in the World
-

 Money1 week ago
The Largest Gender Pay Gaps in OECD Countries
-

 Wealth1 week ago
Charted: Donald Trump’s Net Worth (2014-2024)
-

 Technology1 week ago
Visualizing Nvidia’s Revenue, by Product Line (2019-2024)
-
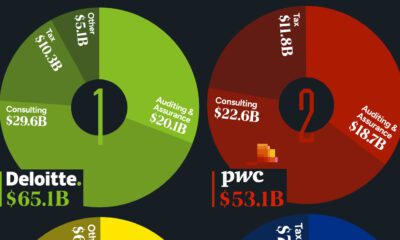
 Business1 week ago
Visualizing the Revenue of the Big Four Accounting Firms
-

 Misc1 week ago
Which U.S. College Major is the Worst for Finding a Job?
-

 Culture1 week ago
Ranked: America’s Most Popular Beers, by Generation
-

 Science2 weeks ago
What Are the 10 Most Common Primates in the World?