Interactive Map: U.S. Nuclear Power Sites
Data regarding the U.S’ nuclear facilities, compiled by the American Security Project, demonstrates a shift in reliance upon nuclear energy. For nearly four decades, Americans’ support of nuclear energy’s potential to carry the U.S. into the future has diminished. This, coupled with the wide availability of fossil fuels, influx of cheap natural gas, and low cost of renewables such as solar and wind energy, have rendered nuclear energy less economically viable. Despite wavering support, the United States continues to supply nuclear subsidies such as: direct expenditures, favorable tax expenditures, and research and development subsidies. Supporting nuclear energy is vital for both our current and future energy security.
In the aftermath of the U.S.’ withdrawal from the Paris Agreement on June 1, investing in cleaner energy is paramount. The U.S. continues to rely heavily on coal, oil, and natural gas, and our climate continues to become increasingly unpredictable.In an era determined by a threshold of two degrees Celsius, the U.S. simply cannot afford to dissolve its commitment to nuclear energy. The U.S. is second only to China in the amount of CO2 produced. However, if the United States is reluctant to act and utilize the carbon free energy nuclear provides, the U.S. will become the world’s greatest contributor to climate change by 2020.
This map accounts for the megawatts, or MWt, of nuclear energy produced per state, and displays each nuclear generating facility’s contribution toward each state’s total nuclear output. Of the 4 trillion kWhs of electricity produced by the U.S. every year, only 20% is generated by nuclear facilities. Although the U.S. is in fact the world’s largest nuclear energy producer, an astounding 65% of its energy is still attributable to fossil fuels. This leaves an opportunity for increasing the production of nuclear energy to lower that reliance on fossil fuels. It’s estimated that if reliance upon nuclear energy continues to decline, global greenhouse gas emissions will release 80-240 gigatonnes (Gt) CO2 into the atmosphere over the next forty years. By increasing reliance on nuclear energy and continuing to support subsidies, nuclear energy will reduce this amount by 16-48%.
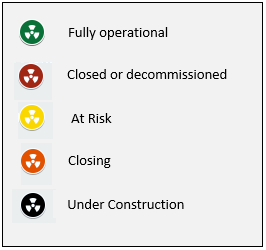
This map portrays the trend we already know is occurring; nuclear plants are slowly closing and going offline. If we fail to support nuclear energy now, we miss out on an opportunity for greater resiliency and energy security in the future. To do this, we need to build public awareness around the safety and multitude of benefits by investing in nuclear. In addition, there needs to be further support for research around nuclear fusion and fission technology to keep America competitive in a rapidly expanding and developing energy field. By investing in nuclear now, we will build a stronger, more energy secure tomorrow for the U.S.

Legend For Nuclear Map


