Get a monitor and contributor to air quality data in your city.

1.8M people follow this city


AIR QUALITY DATA CONTRIBUTORS
46 Contributors


See all

| Index | Low | ||
| Tree pollen | Low | ||
| Grass pollen | Low | ||
| Weed pollen | Low |

| Weather | Clear sky |
| Temperature | 0°C |
| Humidity | 61% |
| Wind | 18.5 km/h |
| Pressure | 1023 mbar |
| # | city | US AQI |
|---|---|---|
| 1 | Kansas City, Kansas | 102 |
| 2 | Omaha, Nebraska | 99 |
| 3 | Valparaiso, Indiana | 99 |
| 4 | Minneapolis, Minnesota | 98 |
| 5 | Savage, Minnesota | 97 |
| 6 | Cedar Rapids, Iowa | 91 |
| 7 | Coraopolis, Pennsylvania | 89 |
| 8 | Saint Paul, Minnesota | 88 |
| 9 | Carter Lake, Iowa | 86 |
| 10 | Rochester, Minnesota | 86 |
(local time)
SEE WORLD AQI RANKING
| # | station | US AQI |
|---|---|---|
| 1 | East 111th Street | 84 |
| 2 | Lower Manhattan | 84 |
| 3 | Red Hook 2 | 82 |
| 4 | Love Lane | 80 |
| 5 | Windsor Terrace | 80 |
| 6 | Bedford-Stuyvesant | 78 |
| 7 | West 20th Street | 78 |
| 8 | LaGuardia Place | 76 |
| 9 | Madison Avenue | 72 |
| 10 | Red Hook Initiative | 72 |
(local time)
SEE WORLD AQI RANKING


Spotlight
Kings Park has "Unhealthy for Sensitive Groups" air quality. See the map and health recommendations.
US AQI
65
live AQI index
Moderate

| Air pollution level | Air quality index | Main pollutant |
|---|---|---|
| Moderate | 65 US AQI | PM2.5 |
| Pollutants | Concentration | |
|---|---|---|
| PM2.5 | 19µg/m³ | |
PM2.5
x3.8
PM2.5 concentration in New York City is currently 3.8 times the WHO annual air quality guideline value
 | Sensitive groups should reduce outdoor exercise |
 | Close your windows to avoid dirty outdoor air GET A MONITOR |
 | Sensitive groups should wear a mask outdoors GET A MASK |
 | Sensitive groups should run an air purifier GET AN AIR PURIFIER |
| Day | Pollution level | Weather | Temperature | Wind |
|---|---|---|---|---|
| Wednesday, Jan 3 | Good 46 AQI US  | 6° | ||
| Thursday, Jan 4 | Good 23 AQI US | 2° -1° | ||
| Today | Moderate 65 AQI US | |||
| Saturday, Jan 6 | Good 44 AQI US | 3° | ||
| Sunday, Jan 7 | Good 9 AQI US | 2° 1° | ||
| Monday, Jan 8 | Good 46 AQI US | 3° | ||
| Tuesday, Jan 9 | Good 43 AQI US | 10° 1° | ||
| Wednesday, Jan 10 | Good 16 AQI US | 12° 5° | ||
| Thursday, Jan 11 | Good 46 AQI US | 5° 3° | ||
| Friday, Jan 12 | Good 37 AQI US | 6° 2° |
Interested in hourly forecast? Get the app
News
The latest air quality news and resources.
Despite being the most populous city in the United States, New York City has relatively clean air on average. For the last three years (2017, 2018, and 2019), New York’s air quality index (AQI) has remained less than 50, or “good.” The US Environmental Protection Agency (EPA) defines “good” air quality as air that poses little to no risk to health.
PM2.5, or fine particulate matter, is a dangerous and prevalent air pollutant, widely regarded as one of the most harmful to human health. The World Health Organization (WHO) uses a slightly more stringent threshold for PM2.5 levels than the US EPA (< 10 μg/m3). Since at least 2017, New York air quality has consistently fallen within this target (2017, 2018, and 2019 averaged 6.8, 7, and 7 μg/m3 respectively). These annual PM2.5 levels are comparable to the air quality of Taos, New Mexico and Waco, Texas (6.9 and 6.8 μg/m3, respectively).
While low PM2.5 levels meeting the < 10 μg/m3 target are recommended, the WHO advises that no level of exposure has been shown to be free of health impacts.1 Current New York air pollution levels continue to threaten communities, particularly lower-income neighborhoods, and raise the risk for heart and lung health complications. The New York Health Department estimates that PM2.5 pollution contributes to more than 3,000 deaths and 2,000 hospital admissions for coronary and respiratory conditions annually.2 A PM2.5 reduction of 10% could reduce the number of deaths and hospital emissions by 300 and 200, respectively. Majid Ezzati, from Imperial’s School of Public Health, concluded in a recent study that further lowering the PM2.5 standard below the current level can provide an opportunity to save more lives and equalize the health of New York residents across income levels.3
While annual averages for particulate pollution pass most guidelines, the city continues to struggle with ozone pollution. Ozone is among the most dangerous gaseous pollutants and a critical component of smog. The State of the Air Report published by the American Lung Association gave New York City an “F” for ozone pollution.4 This rating was provided on the basis that 5.5 days in 2019 exceeded the national 8-hr ozone standard of 70 ppb.
A 2011 analysis found that roughly 10% of hospital visits for asthma in New York City are attributable to ozone pollution.5 Staten Island, Southern Brooklyn, Central Queens, and the Northwest Bronx have the highest ozone-related death rates.
While city-wide ozone has decreased significantly in the last three decades, ozone still presents one of the greatest environmental health threats to residents. Tackling ozone pollution is challenging, however, as it’s a gas pollutant that is created in the atmosphere from precursor pollutants reacting in sunlight. Precursor pollutants are sometimes emitted in other cities and states as well as from New York City’s high vehicle congestion. Rising temperatures as a result of climate change are expected to further exacerbate this problem.
Monitoring air pollution data and taking action to reduce pollution exposure are the first steps in protecting oneself from associated adverse health effects. Refer to the top of this page for New York’s forecast air quality data and live air quality data.
New York air quality has improved over the past several decades. More recent progress, however, has been relatively stagnant. 2017 to 2018 observed a very small increase in PM2.5 pollution of 0.2 μg/m3, while 2018 to 2019 remained unchanged in terms of annual PM2.5 average (7 μg/m3). A gradual shift towards more electric vehicles and cleaner energy provides an opportunity to drive emissions and pollution levels down further in the future.
In March of 2020, New York became the epicenter of the US COVID-19 outbreak. Lockdown measures were put in place on a state and city level in order to slow the spread of the virus. During this lockdown period, New York observed a 25% reduction in fine particle pollution (PM2.5) as compared to the same time period in 2019, according to the COVID-19 Air Quality Report. During the analyzed three-week period (March 23 - April 13, 2020), 100% of hours were in the best US AQI “good” category (up from 94% in 2019). Several hours experienced PM2.5 levels below 1.3 μg/m3 (or AQI 5), an extremely rare event for the largest city in the U.S., and while these reductions were brief, they provide insights into what could be achieved if the city depended on more electric or clean transport and reduced or cleaner industry.
New York’s unhealthy air quality is primarily attributable to high ozone levels. Ozone occurs in the atmosphere when high temperatures (over 80°F) cause pollutants, nitrogen oxides, and reactive organic substances from vehicles and smokestack combustion to react. In 2019, New York was deemed “nonattainment” for ozone pollution as a result of several high pollution episodes.
Despite relatively strict emission controls, New York’s high population density and heavy vehicle traffic poses the city’s greatest challenge to tackling air pollution. The city has been legislating for ‘cleaner’ mass transport in hopes of further reducing traffic congestion.
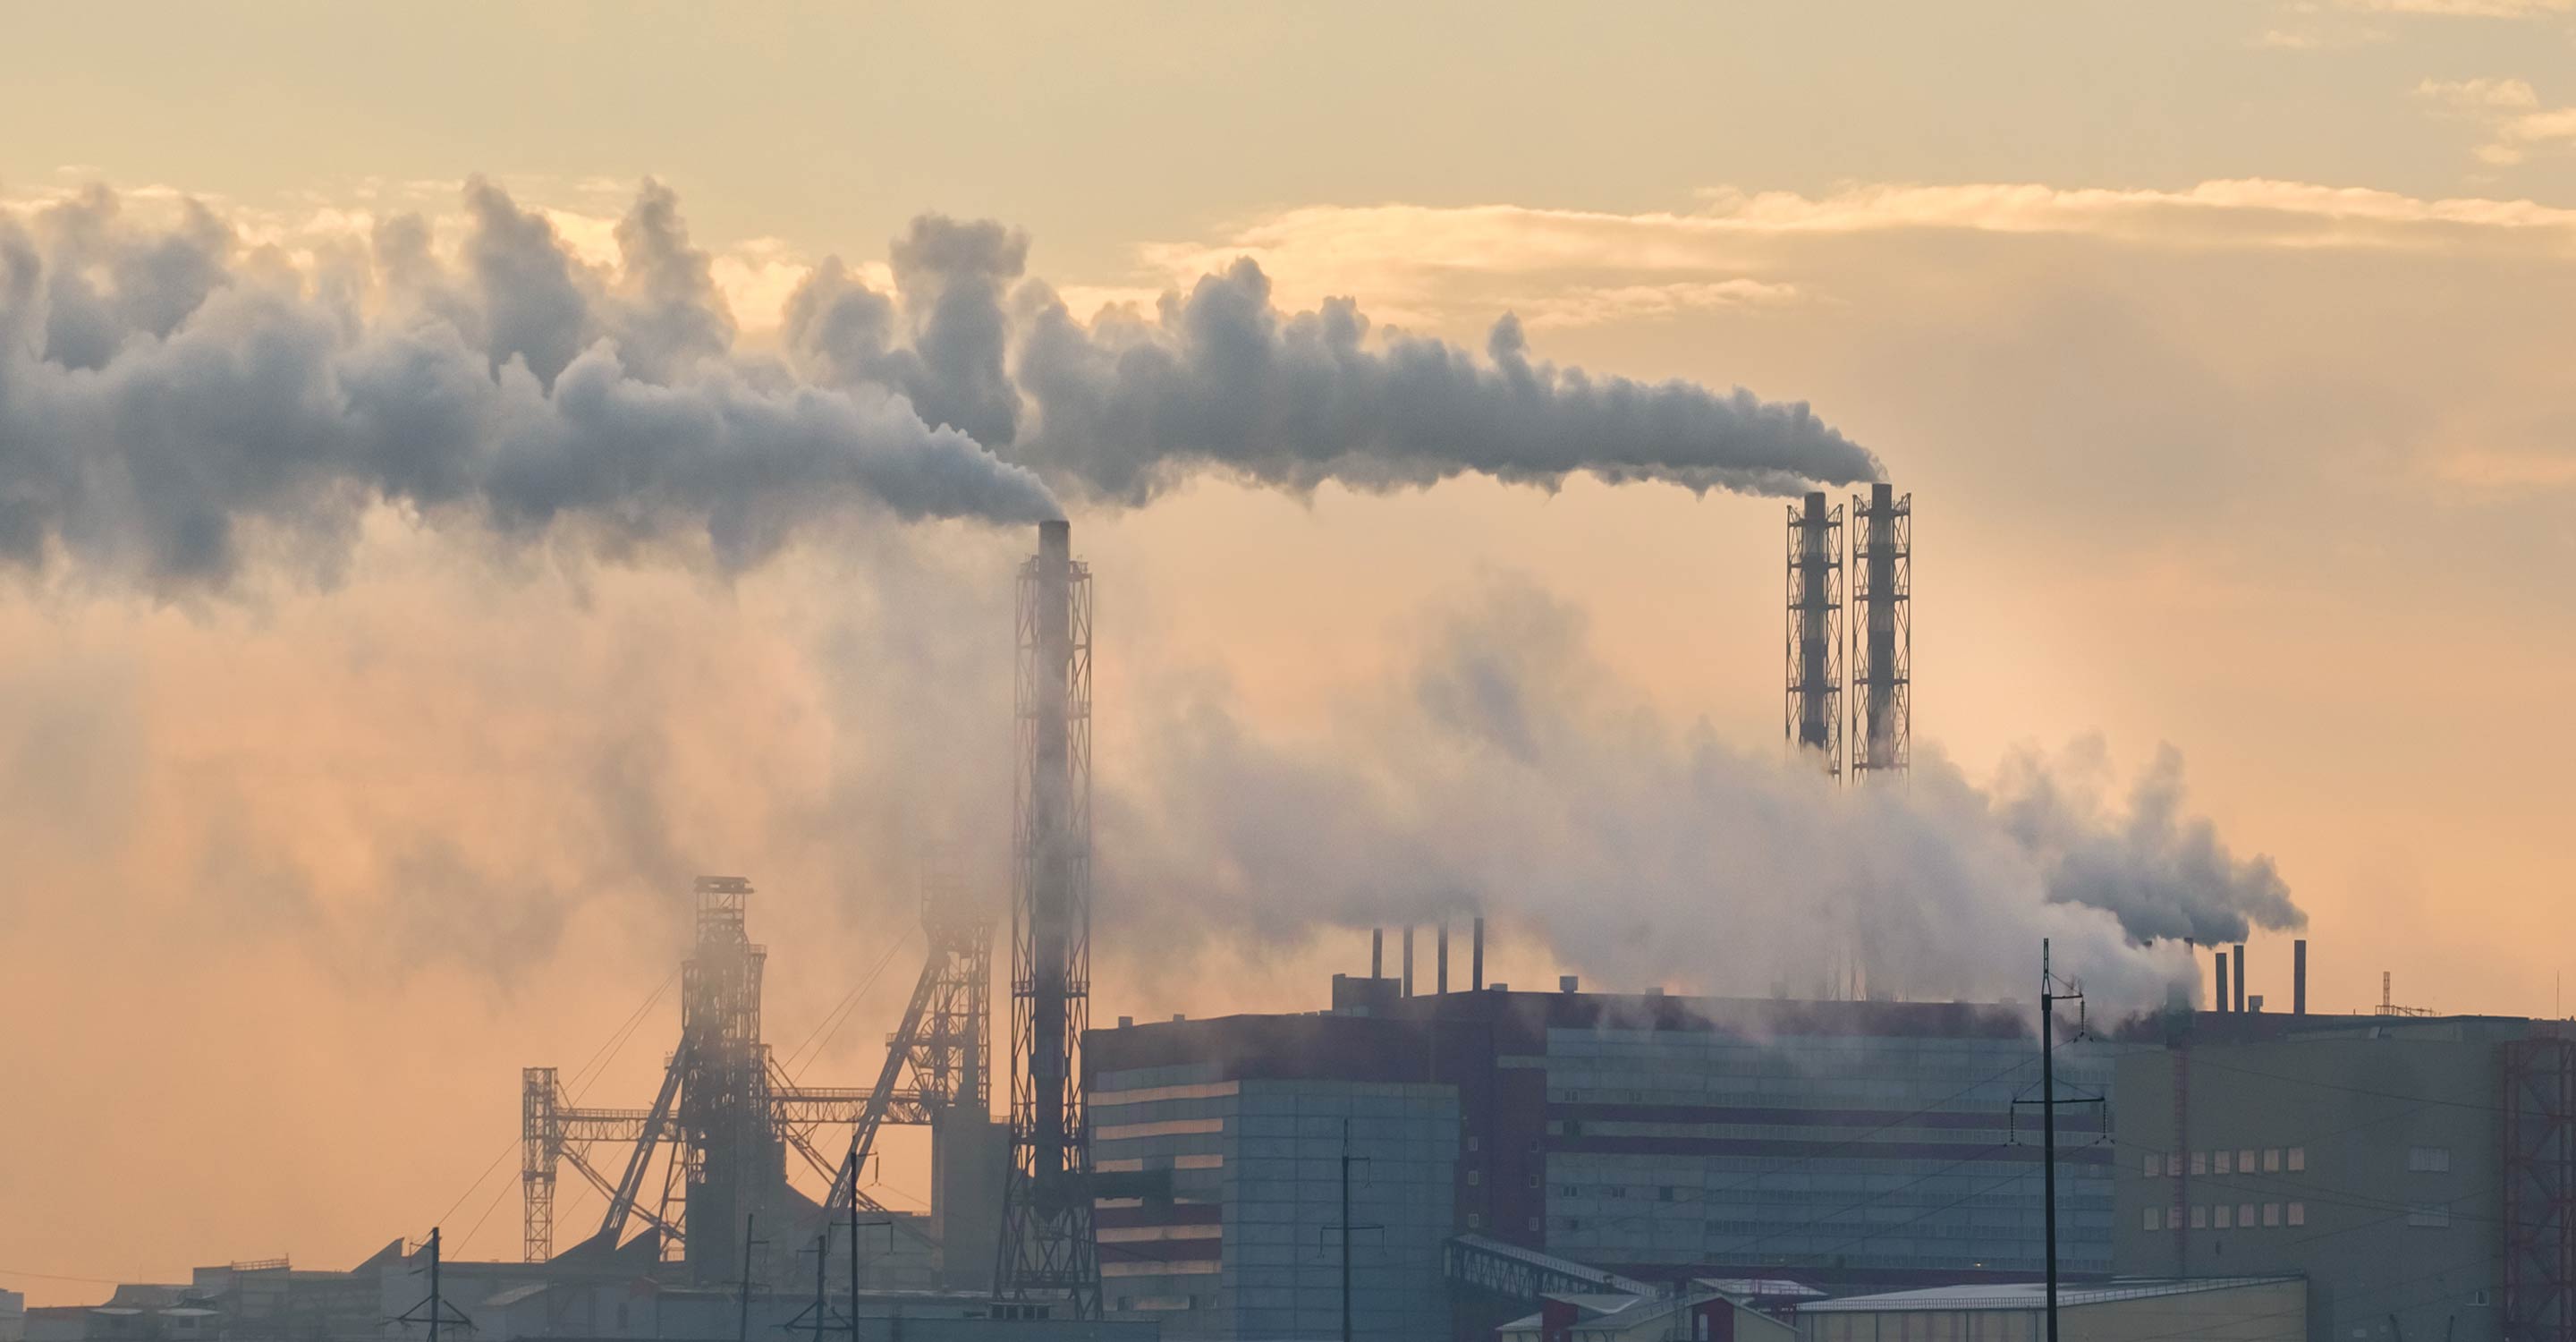
While particle pollution meets annual “attainment” levels, as established by the US EPA, it still contributes to thousands of deaths and hospital visits annually. The majority of fine particles in New York City’s air originate from outside of the city, and local sources account for differences within the city. Primary sources include transport exhaust, particularly from cars, heavy-duty trucks, ships, and planes, industrial businesses on the city outskirts and residential buildings in New York City that burn residual fuel oil.
New York’s summer and winter are traditionally more polluted than the spring and fall. This trend is attributable to unique winter weather, including cool air inversions, and summer weather, including abundant sunshine that creates atmospheric ozone from precursor gases. New York’s most polluted months in 2019 for PM2.5 pollution were July (9.1 μg/m3), January (8.7 μg/m3), and December (8.4 μg/m3).
Explore New York’s air pollution map to observe how local emission sources (such as major roadways and burning residual oil) account for differences in PM2.5.
Federal and state air pollution guidelines, as established by the US EPA and New York City Community Air Survey (NYCCAS), are primarily centered around defined “criteria pollutants,” including PM2.5, PM10, ozone (O3), nitrogen dioxide (NO2), sulphur dioxide (SO2), and carbon monoxide (CO). Numerous other chemicals, however, exist in our air and contribute to adverse health effects.
Chemicals including benzene, formaldehyde, and other volatile organic compounds (VOCs), are included in a separate category of air pollutants known as “hazardous air pollutants” (HAPs). These pollutants (benzene, formaldehyde, and some VOCs) , common in cities, are known carcinogens. New analyses provided by the US EPA estimate that nearly half of all New York City residents live in areas where exposure to HAPs increase cancer risk by 1 in 10,000 over a lifetime.6
Benzene is naturally occurring in crude oils used in gasoline. Because of this, gas-powered motor vehicles are a primary source of ambient benzene in New York City. Ambient formaldehyde is also produced by motor vehicles, however, through the combustion of fuels, and can additionally be formed in the atmosphere when hydrocarbons react in sunlight, forcing a chemical reaction.
While benzene, formaldehyde, and other VOCs are not monitored in real time, NYCCAS researchers collected short-term data from 70 street-side and park sites across the city in order to demonstrate differences in HAP levels across the city. The study revealed areas of high congestions and traffic have 83 percent higher benzene levels and 45 percent higher formaldehyde levels as areas of lower traffic congestion. Since benzene and formaldehyde share some sources with criteria pollutants, PM2.5 and NO2, these pollutants were also present at higher levels in congested areas. While perhaps unsurprising, the results of the study highlight the relative danger of living near busy roadways. City efforts to promote cleaner transportation options offer an opportunity for improving New York City’s roadside chemical levels.
Much of the air pollution in NYC comes from mobile emission sources, such as cars and trucks, despite having the lowest per capita vehicle miles traveled of any US city.7 Both New York’s size and density cause the city to rank among the most congested in the nation. 2.5 million residents drive into Manhattan every day. Transitioning residents to electric and hybrid vehicles could greatly improve New York’s air quality. In order to promote such a move, New York City has pushed a three-prong approach, including community outreach, increasing access to public charging stations, and improving accessibility and vehicle economics. New York City aims to achieve 10,000 electric vehicle charging stations by the end of 2021 and 850,000 zero emission vehicles by 2025.8
In 2019, the US Environmental Protection Agency awarded New York City $9.35 million (USD) to improve the safety of its air. Approximately $8 million is intended for air pollution control programs, including:
The remaining 1 million is intended to expand New York City’s PM2.5 monitoring network.
While air pollution remains a challenge in urban areas, making NYC air pollution levels unsurprising, the city has already demonstrated the ability of regulations and public transportation to create a safe living environment. Pushing these regulations further in the future, in combination with more zero-emission vehicles, will be the key to success for achieving clean air in New York City.
+ Article Resources
[1] Air quality guidelines – global update 2005. (2020).
[2] Kheirbek I, et al. (2011). Air pollution and the health of New Yorkers: the impact of fine particles and ozone.
[3] Bennett J, et al. (2019). Particulate matter air pollution and national and county life expectancy loss in the USA: A spatiotemporal analysis.
[4] State of the Air – 2020. (2020).
[5] Crean S. (2014). While improving, city's air quality crisis quietly persists.
[6] New York City Government. (2020). New York City Community Air Survey (NYCCAS): benzene, formaldehyde and other toxic air pollutants in New York City.
[7] The City of New York. (2012, December). The New York City electric vehicle readiness plan: unlocking urban demand.
[8] Lewis M. (2020, July 17). New York State to spend $750M on EV charging infrastructure. Electrek.
[9] US Environmental Protection Agency (EPA). (2019, November 11). EPA awards $9.35 million to New York to improve air quality.
46Contributors
Government
5 Individuals
1 station

1 station
1 station
1 station
1 station
40 Anonymous
40 stations
4 Data sources
 Data validated and calibrated by IQAir