Doji Candlestick Pattern
- 08 May 2024
- By: BlinkX Research Team
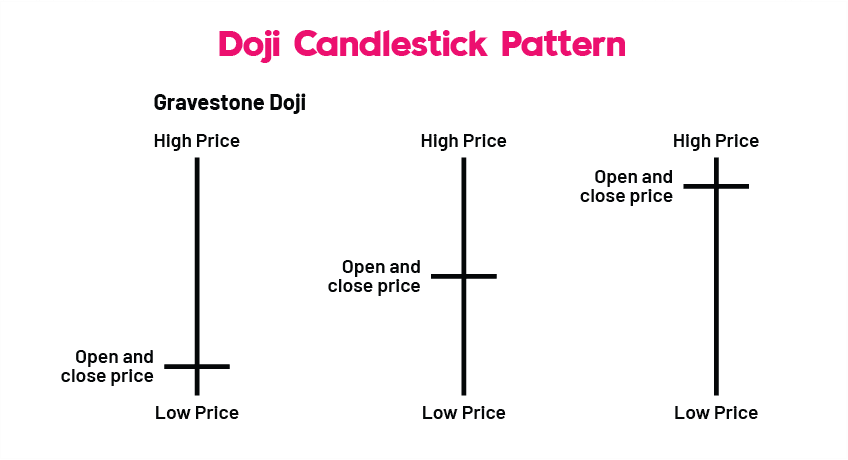
Doji is a unique pattern in a candlestick chart, indicating a limited trading range and equal or little variance in the opening and closing prices of a financial asset. It can look like a plus sign, a cross, or an inverted cross. Doji candlesticks are a type of trading session where a security has open and close levels that are virtually equal, represented by a candle shape on a chart.
Technical analysts use this shape to make assumptions about price behaviour. Although rare, a Doji candlestick generally signals a trend reversal indication for analysts. However, it can also indicate indecision about future prices. Candlestick charts are a useful tool for analysing market trends, sentiment, momentum, and volatility. The patterns displayed in these charts are indicators of the movements and responses of the market.
What is Doji Candlestick Pattern Meaning?
The word "Doji" is derived from the Japanese word "Doji," meaning "error." Because it shows that the asset's starting and closing prices are equal, an unusual occurrence, the pattern receives its name. In either an upward or downward-trending market, a Doji is a symbol of market hesitancy and a warning of a market reversal.
An essential part of technical analysis for traders is comprehending and spotting patterns on trading charts for stocks, bonds, currencies, and futures. Traders must not only analyse and recognise trends but also understand various chart patterns and what they mean.
Table of Content
- What is Doji Candlestick Pattern Meaning?
- How to Use Doji to Place a Trade?
- Importance of Doji Candlestick Pattern
- Limitation of Doji Candlestick Pattern
How to Use Doji to Place a Trade?
The following is a list of the three primary procedures to follow when trading doji candlestick patterns:
Spotting the Doji Pattern on the Price Chart
- Identify the stock Doji on the stock price chart.
- Doji candlesticks have no real body, and the length of the upper and lower shadows varies.
- The body of all types of Doji is a horizontal line indicating equal open and closed prices.
Finding Supporting Signals Using Other Technical Indicators
- Use other technical indicators to validate the messages that the Doji patterns indicated.
- A stochastic indicator is used to support the predictions of the Doji candlestick.
Applying Trading Strategies Depending on the Predicted Trend
- Traders tend to hold on to securities or buy more if the Doji predicts a bullish reversal.
- Traders often resort to shorting if the predicted trend is a bearish reversal.
- A common trading strategy using Doji candlestick patterns is using stop-loss orders.
Importance of Doji Candlestick Pattern
The importance of Doji candlestick patterns are as follows:
- Technical experts believe that a stock's price accurately reflects all available information, but past performance does not guarantee future price performance.
- Analysts use methods to identify the best bets based on the shape of a candlestick pattern, which consists of an open, high, low, and close.
- The candlestick pattern generates a filled or hollow bar as the body, with lines that extend beyond the body called shadows.
- A hollow candlestick is formed when a stock closes higher than it opened, while a filled candlestick is formed when the stock closes lower.
- The Doji is one of the most important candlestick shapes.
Limitation of Doji Candlestick Pattern
Here are the limitations of the Doji candlestick pattern:
- Doji candlestick is a neutral indicator with limited information.
- Not a reliable tool for spotting price reversals.
- Price continuation in the expected direction is uncertain after the confirmation candle.
- Doji's tail or wick size and confirmation candle size can affect the distance between the trade entry point and the stop-loss location.
- Large stop-loss may not justify the potential reward of the trade.
- Estimating the reward of doji-informed trade is challenging due to the lack of price targets.
- Other techniques, indicators, or strategies are needed to exit the trade.
Conclusion
Doji candlesticks are a valuable tool for technical analysts, but they should be interpreted cautiously. They indicate market indecision, potentially signalling a trend reversal. The type of Doji can provide additional clues, such as strong buying and selling pressure. However, Doji patterns have limitations, as they don't guarantee a trend reversal, provide clear price targets or exit points, and require other technical indicators or chart patterns for informed trading decisions. Finally, choosing a reliable stock market app is necessary to start your trading journey.
