Markets
Visualized: The U.S. $20 Trillion Economy by State
 Can I share this graphic?
 When do I need a license?
 Interested in this piece?
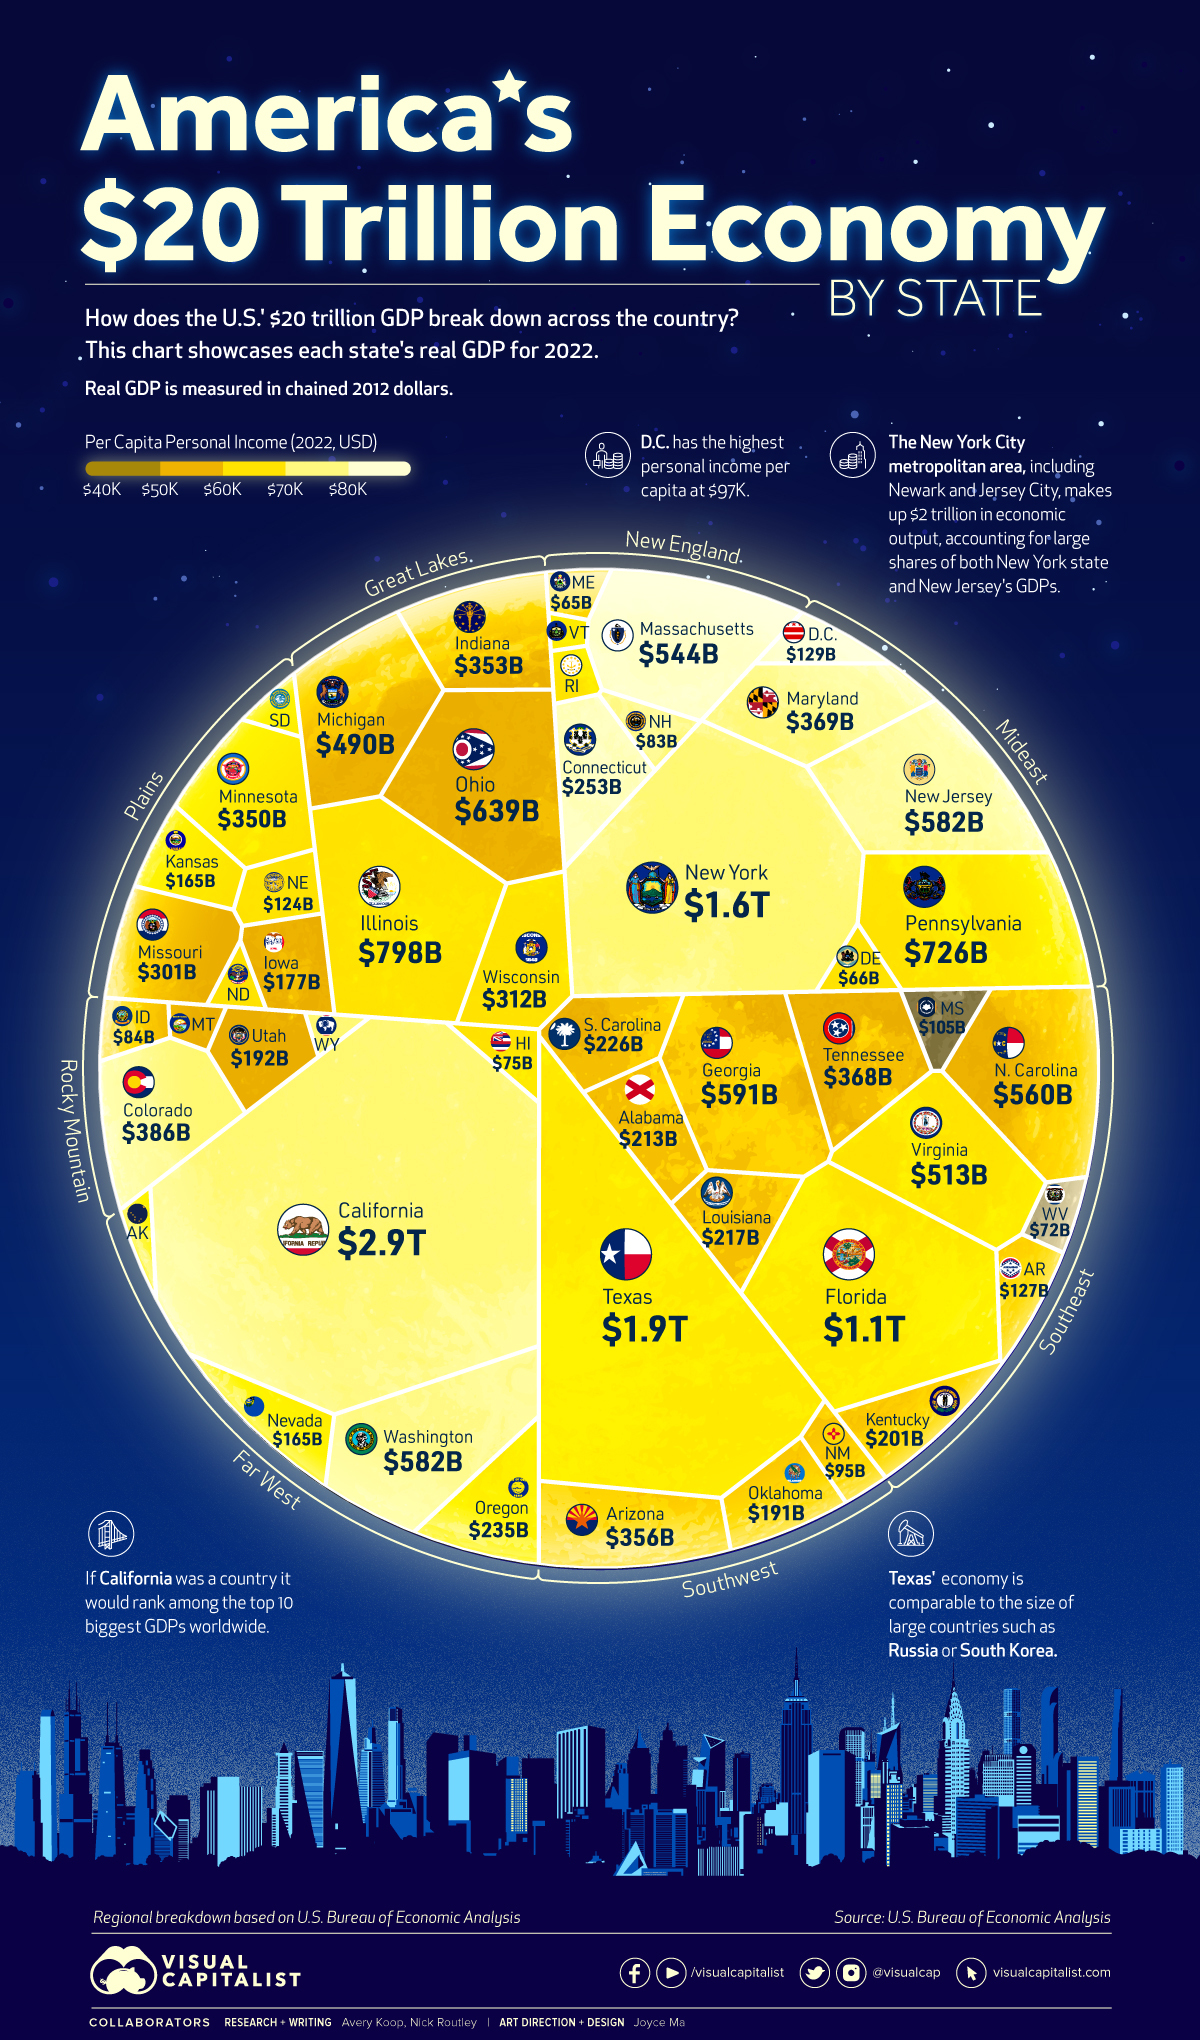
Visualized: The U.S. $20 Trillion Economy by State
A sum of its parts, every U.S. state plays an integral role in the country’s overall economy.
Texas, for example, generates an economic output that is comparable to South Korea’s, and even a small geographical area like Washington, D.C. outputs over $129 billion per year.
The visualization above uses 2022 annual data out of the U.S. Bureau of Economic Analysis (BEA) to showcase each state or district’s real gross domestic product (GDP) in chained 2012 dollars, while also highlighting personal income per capita.
A Closer Look at the States
California is by far the biggest state economy in the U.S. at $2.9 trillion in real GDP—and when comparing its nominal value ($3.6 trillion) with national GDPs worldwide, the Golden State’s GDP would rank 5th overall, just below Germany and Japan.
Here’s an up-close look at the data:
| Rank | State | Real GDP (chained 2012 dollars) |
|---|---|---|
| 1 | California | $2.9 trillion |
| 2 | Texas | $1.9 trillion |
| 3 | New York | $1.6 trillion |
| 4 | Florida | $1.1 trillion |
| 5 | Illinois | $798 billion |
| 6 | Pennsylvania | $726 billion |
| 7 | Ohio | $639 billion |
| 8 | Georgia | $591 billion |
| 9 | Washington | $582 billion |
| T9 | New Jersey | $582 billion |
| 11 | North Carolina | $560 billion |
| 12 | Massachusetts | $544 billion |
| 13 | Virginia | $513 billion |
| 14 | Michigan | $490 billion |
| 15 | Colorado | $386 billion |
| 16 | Maryland | $369 billion |
| 17 | Tennessee | $368 billion |
| 18 | Arizona | $356 billion |
| 19 | Indiana | $353 billion |
| 20 | Minnesota | $350 billion |
| 21 | Wisconsin | $312 billion |
| 22 | Missouri | $301 billion |
| 23 | Connecticut | $253 billion |
| 24 | Oregon | $235 billion |
| 25 | South Carolina | $226 billion |
| 26 | Louisiana | $217 billion |
| 27 | Alabama | $213 billion |
| 28 | Kentucky | $201 billion |
| 29 | Utah | $192 billion |
| 30 | Oklahoma | $191 billion |
| 31 | Iowa | $177 billion |
| 32 | Nevada | $165 billion |
| T32 | Kansas | $165 billion |
| 34 | District of Columbia | $129 billion |
| 35 | Arkansas | $127 billion |
| 36 | Nebraska | $124 billion |
| 37 | Mississippi | $105 billion |
| 38 | New Mexico | $95 billion |
| 39 | Idaho | $84 billion |
| 40 | New Hampshire | $83 billion |
| 41 | Hawaii | $75 billion |
| 42 | West Virginia | $72 billion |
| 43 | Delaware | $66 billion |
| 44 | Maine | $65 billion |
| 45 | Rhode Island | $55 billion |
| 46 | North Dakota | $53 billion |
| 47 | South Dakota | $50 billion |
| T47 | Montana | $50 billion |
| T47 | Alaska | $50 billion |
| 50 | Wyoming | $36 billion |
| 51 | Vermont | $31 billion |
| United States | $20 trillion |
Altogether, California, New York, and Texas account for almost one-third of the country’s economy, combining for $6.3 trillion in real GDP in 2022. The only other state that reached the trillion dollar mark is Florida with $1.1 trillion.
Texas’ economy is driven largely by industries like advanced manufacturing, biotech, life sciences, aerospace, and defense. The state is also home to a number of large companies, like Tesla and Texas Instruments, which make it a hub for jobs, innovation, and opportunity.
New York state is a leader in the insurance, agribusiness, clean energy, and cyber security industries, among many others. Zooming into the New York City area reveals huge sources of economic output from the tourism, media, and financial services sectors.
Regional Disparities
While the aforementioned states are the big hitters, the median GDP per state was much lower at $217 billion in 2022.
Under the BEA’s eight region breakdown, all states in the Great Lakes region had GDPs that were higher than the median, reflecting the industrial strength of states like Illinois and Ohio. Most of the states in the Mideast region including New York, Pennsylvania, and Maryland also have GDPs higher than the country median.
Comparatively, many states in the Plains region had lower GDPs, including Iowa and Kansas. Other states with lower GDPs (and generally lower populations) were spread around the country, including lowest-ranked Vermont in New England.
Personal Income per Capita
In addition to real GDP, this voronoi diagram has been color-coded in terms of personal income per capita in each state. Here’s a closer look at those figures:
| Rank | State | Personal Income per Capita |
|---|---|---|
| 1 | District of Columbia | $96,728 |
| 2 | Connecticut | $84,972 |
| 3 | Massachusetts | $84,945 |
| 4 | New Jersey | $78,700 |
| 5 | New York | $78,089 |
| 6 | California | $77,339 |
| 7 | Washington | $75,698 |
| 8 | New Hampshire | $74,663 |
| 9 | Colorado | $74,167 |
| 10 | Wyoming | $71,342 |
| 11 | Maryland | $70,730 |
| 12 | Alaska | $68,919 |
| 13 | Illinois | $68,822 |
| 14 | Virginia | $68,211 |
| 15 | Minnesota | $68,010 |
| 16 | North Dakota | $66,184 |
| 17 | South Dakota | $65,806 |
| 18 | Rhode Island | $65,377 |
| 19 | Pennsylvania | $65,167 |
| 20 | Florida | $63,597 |
| 21 | Nebraska | $63,321 |
| 22 | Vermont | $63,206 |
| 23 | Oregon | $62,767 |
| 24 | Texas | $61,985 |
| 25 | Delaware | $61,387 |
| 26 | Nevada | $61,282 |
| 27 | Wisconsin | $61,210 |
| 28 | Hawaii | $61,175 |
| 29 | Kansas | $60,152 |
| 30 | Maine | $59,463 |
| 31 | Iowa | $58,905 |
| 32 | Tennessee | $58,279 |
| 33 | Indiana | $57,930 |
| 34 | Utah | $57,925 |
| 35 | Ohio | $57,880 |
| 36 | Montana | $57,719 |
| 37 | North Carolina | $57,416 |
| 38 | Georgia | $57,129 |
| 39 | Michigan | $56,813 |
| 40 | Arizona | $56,667 |
| 41 | Missouri | $56,551 |
| 42 | Oklahoma | $54,998 |
| 43 | Louisiana | $54,622 |
| 44 | Idaho | $54,537 |
| 45 | South Carolina | $53,320 |
| 46 | Kentucky | $52,109 |
| 47 | Arkansas | $51,787 |
| 48 | New Mexico | $51,500 |
| 49 | Alabama | $50,637 |
| 50 | West Virginia | $49,169 |
| 51 | Mississippi | $46,248 |
Economic Engines and Future Growth
Many of the largest state economies are fueled by strong urban populations. These metropolitan cities are the economic engines of the country, driving innovation and attracting new talent.
The NYC-Newark-Jersey City metropolitan area is a great example of this, generating over $2 trillion in economic output alone. Los Angeles generated $1.1 trillion.
While these are the obvious and expected hubs, some new cities and states are beginning to attract new business and are anticipating significant economic growth. North Carolina, for example, has been ranked as the best U.S. state to do business in, thanks to a number of factors like ease of access to capital and a strong culture of tech and innovation.
Over time, the centers of economic power may be slowly shifting in the U.S., but for now the top contributors to the nation’s GDP far outpace the rest.


Maps
Mapped: The 10 U.S. States With the Lowest Real GDP Growth
In this graphic, we show where real GDP lagged the most across America in 2023 as high interest rates weighed on state economies.


The Top 10 U.S. States, by Lowest Real GDP Growth
This was originally posted on our Voronoi app. Download the app for free on iOS or Android and discover incredible data-driven charts from a variety of trusted sources.
While the U.S. economy defied expectations in 2023, posting 2.5% in real GDP growth, several states lagged behind.
Last year, oil-producing states led the pack in terms of real GDP growth across America, while the lowest growth was seen in states that were more sensitive to the impact of high interest rates, particularly due to slowdowns in the manufacturing and finance sectors.
This graphic shows the 10 states with the least robust real GDP growth in 2023, based on data from the Bureau of Economic Analysis.
Weakest State Economies in 2023
Below, we show the states with the slowest economic activity in inflation-adjusted terms, using chained 2017 dollars:
| Rank | State | Real GDP Growth 2023 YoY | Real GDP 2023 |
|---|---|---|---|
| 1 | Delaware | -1.2% | $74B |
| 2 | Wisconsin | +0.2% | $337B |
| 3 | New York | +0.7% | $1.8T |
| 4 | Missississippi | +0.7% | $115B |
| 5 | Georgia | +0.8% | $661B |
| 6 | Minnesota | +1.2% | $384B |
| 7 | New Hampshire | +1.2% | $91B |
| 8 | Ohio | +1.2% | $698B |
| 9 | Iowa | +1.3% | $200B |
| 10 | Illinois | +1.3% | $876B |
| U.S. | +2.5% | $22.4T |
Delaware witnessed the slowest growth in the country, with real GDP growth of -1.2% over the year as a sluggish finance and insurance sector dampened the state’s economy.
Like Delaware, the Midwestern state of Wisconsin also experienced declines across the finance and insurance sector, in addition to steep drops in the agriculture and manufacturing industries.
America’s third-biggest economy, New York, grew just 0.7% in 2023, falling far below the U.S. average. High interest rates took a toll on key sectors, with notable slowdowns in the construction and manufacturing sectors. In addition, falling home prices and a weaker job market contributed to slower economic growth.
Meanwhile, Georgia experienced the fifth-lowest real GDP growth rate. In March 2024, Rivian paused plans to build a $5 billion EV factory in Georgia, which was set to be one of the biggest economic development initiatives in the state in history.
These delays are likely to exacerbate setbacks for the state, however, both Kia and Hyundai have made significant investments in the EV industry, which could help boost Georgia’s manufacturing sector looking ahead.

-

 United States1 week ago
Mapped: Countries Where Recreational Cannabis is Legal
-

 Healthcare2 weeks ago
Life Expectancy by Region (1950-2050F)
-

 Markets2 weeks ago
The Growth of a $1,000 Equity Investment, by Stock Market
-

 Markets2 weeks ago
Mapped: Europe’s GDP Per Capita, by Country
-

 Money2 weeks ago
Charted: What Frustrates Americans About the Tax System
-

 Technology2 weeks ago
Countries With the Highest Rates of Crypto Ownership
-

 Mining2 weeks ago
Where the World’s Aluminum is Smelted, by Country
-

 Personal Finance2 weeks ago
Visualizing the Tax Burden of Every U.S. State