(Stacker) – Why do people move from one county or region to another? The usual suspects are jobs, family, significant others, and overall cost of living, but there are other elements at play.
For those with children, moving within close proximity of a highly rated school district is a key contributing factor. For younger adults just starting out, living someplace with a vibrant social scene might be a top priority. And for those whose careers have wound down after a lifetime of work, finding retirement-friendly communities is the goal—communities deemed to be safe, offer accessibility to medical resources and leisure activities in equal measure, and be affordable for those on a limited income.
This is, of course, by no means an exhaustive list. People’s reasons for choosing to live where they do are as diverse as people themselves.
As far as why certain counties across the U.S. have experienced growth, relocation is not the sole, or even primary, reason why. While more than 1,800 counties saw population gains in 2021, approximately 73% of all U.S. counties saw what the U.S. Census Bureau characterizes as a natural decrease. This was a significant jump from 2020, when 55.5% of countries experienced such a decrease. According to the Bureau, natural decrease is the simple result of “when there are more deaths than births in a population over a given time period.” In 2021, the conflation of fewer births with an aging population that was also absorbing a higher-than-usual mortality rate due to the ongoing COVID-19 pandemic led to this “increased decrease.”
Nonetheless, as stated 1,800 counties nationwide have grown larger over the last year, and a sizable percentage of them are in California. Stacker compiled a list of the fastest-growing counties in California using data from the U.S. Census Bureau. Counties are ranked by the highest population growth from 2010 to 2020, based on the U.S. Decennial Census.
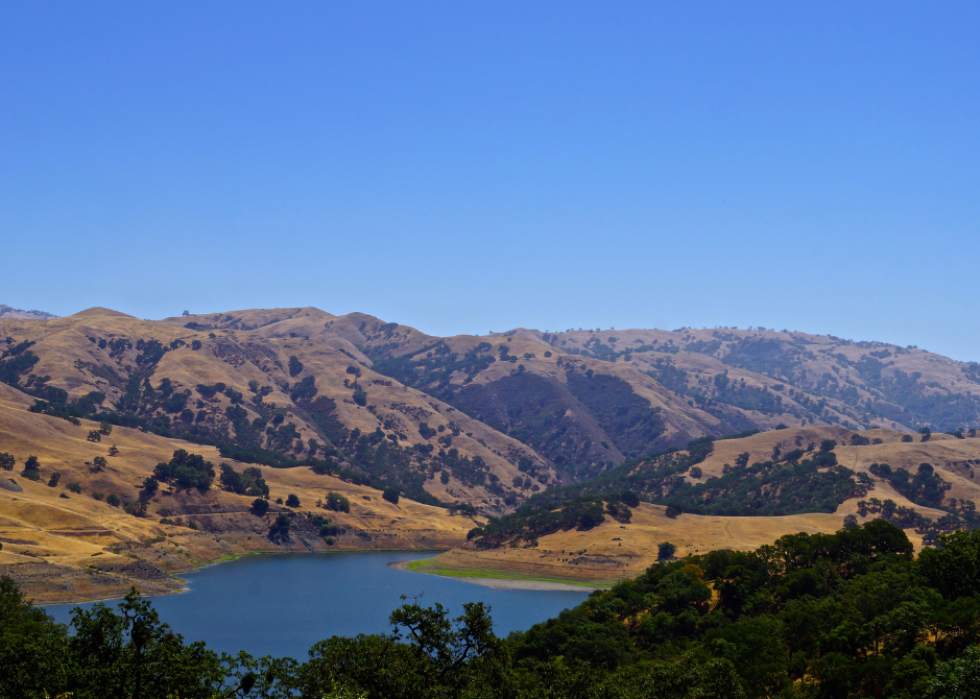
#50. Calaveras County
– 2010 to 2020 population change: -286
— #1,892 among all counties nationwide
– 2010 to 2020 percent population change: -0.6%
— #50 among counties in California, #1,586 among all counties nationwide
– 2020 population: 45,292
— #44 largest county in California, #1,067 largest county nationwide
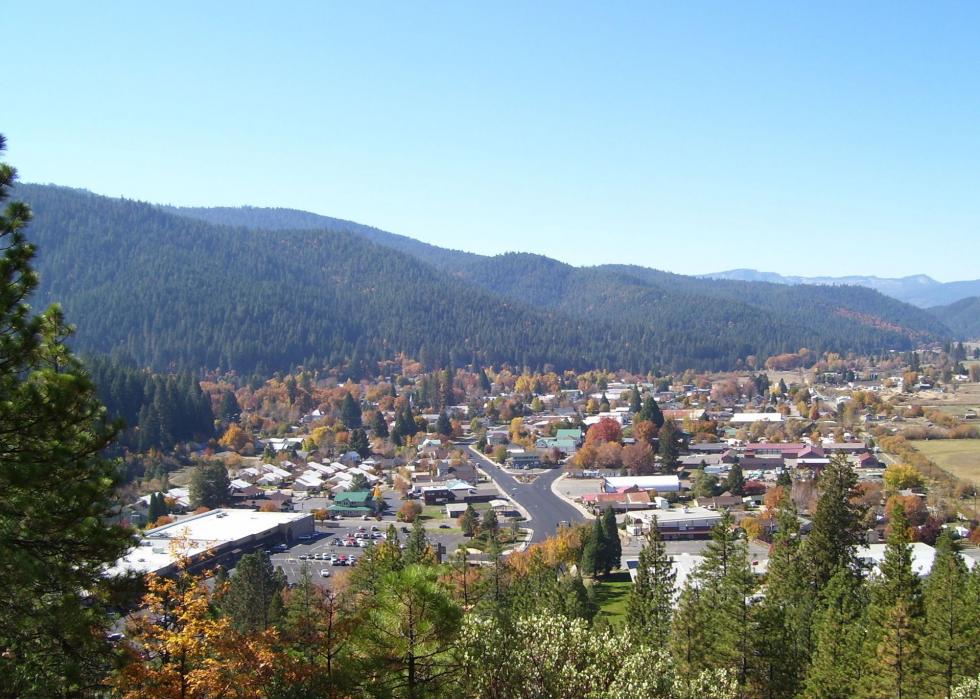
#49. Plumas County
– 2010 to 2020 population change: -217
— #1,798 among all counties nationwide
– 2010 to 2020 percent population change: -1.1%
— #51 among counties in California, #1,665 among all counties nationwide
– 2020 population: 19,790
— #51 largest county in California, #1,827 largest county nationwide

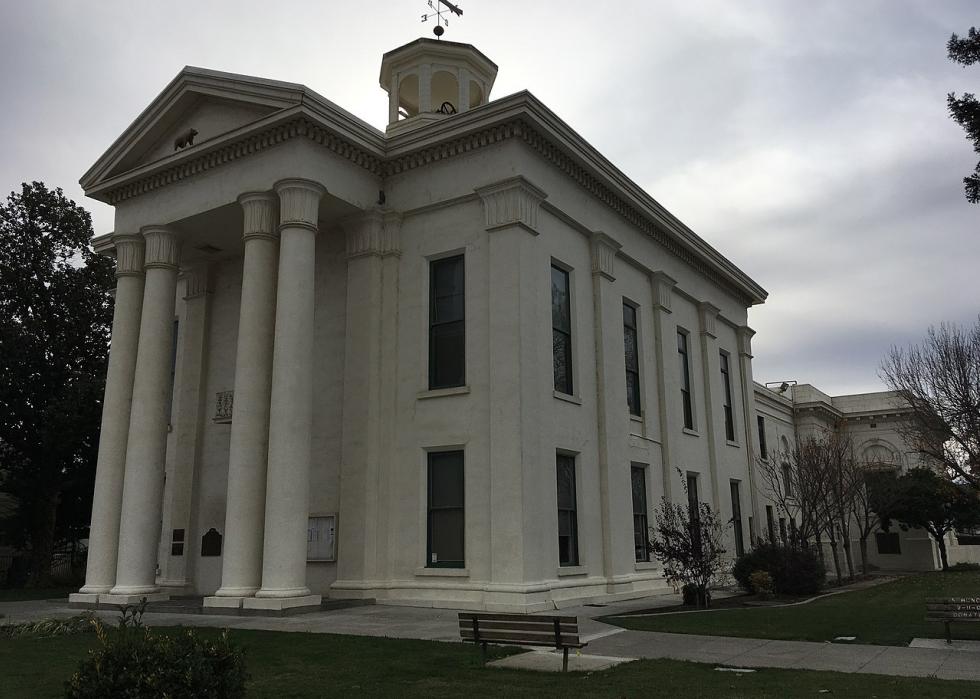
#48. Sierra County
– 2010 to 2020 population change: -4
— #1,497 among all counties nationwide
– 2010 to 2020 percent population change: -0.1%
— #48 among counties in California, #1,510 among all counties nationwide
– 2020 population: 3,236
— #57 largest county in California, #2,947 largest county nationwide

#47. Alpine County
– 2010 to 2020 population change: +29
— #1,455 among all counties nationwide
– 2010 to 2020 percent population change: +2.5%
— #41 among counties in California, #1,122 among all counties nationwide
– 2020 population: 1,204
— #58 largest county in California, #3,098 largest county nationwide

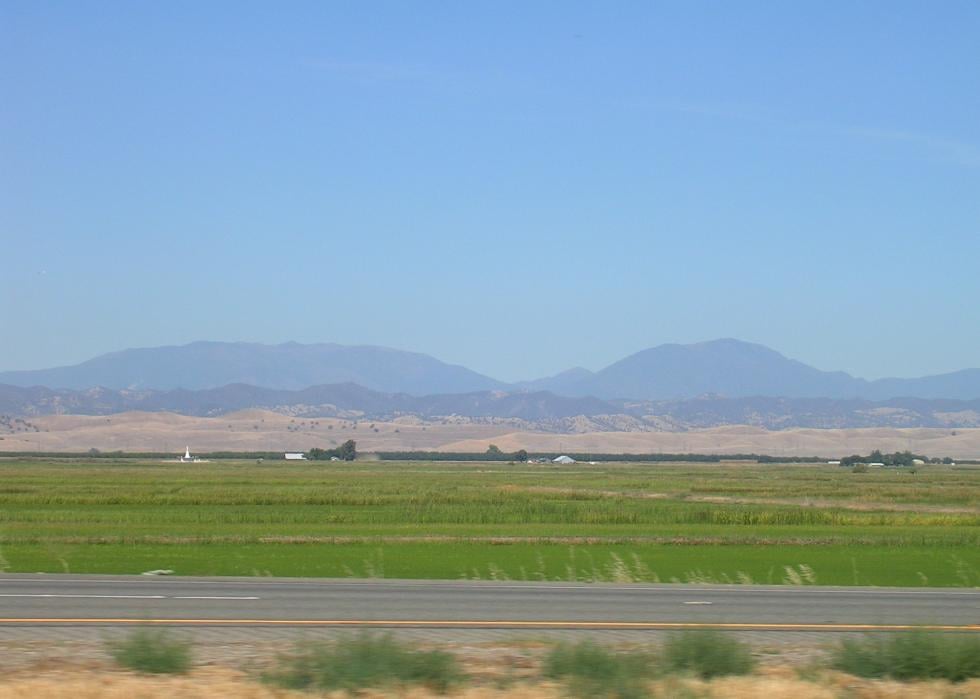
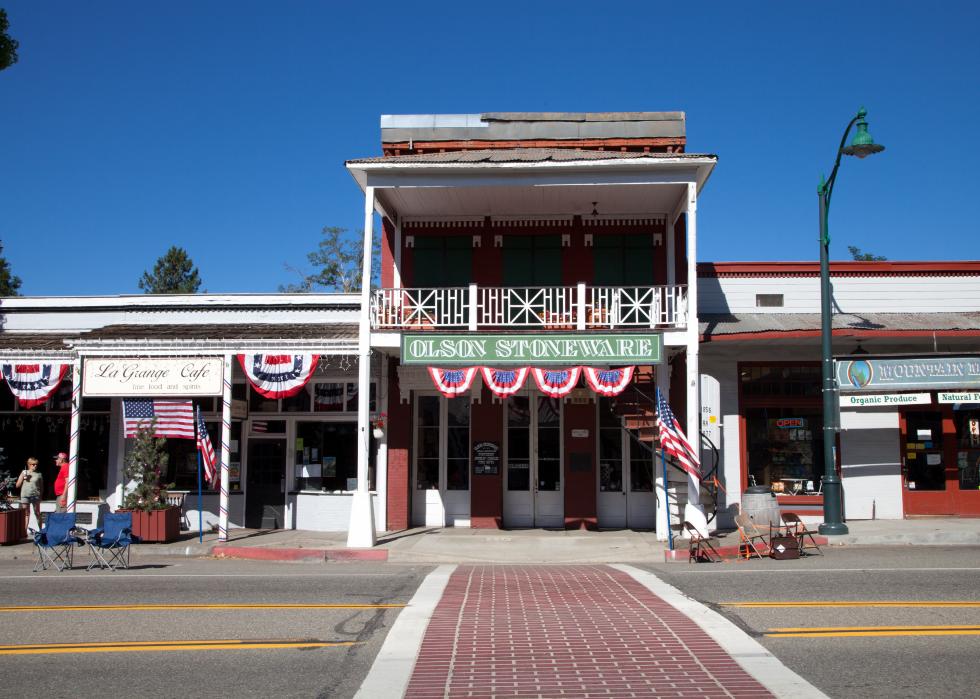
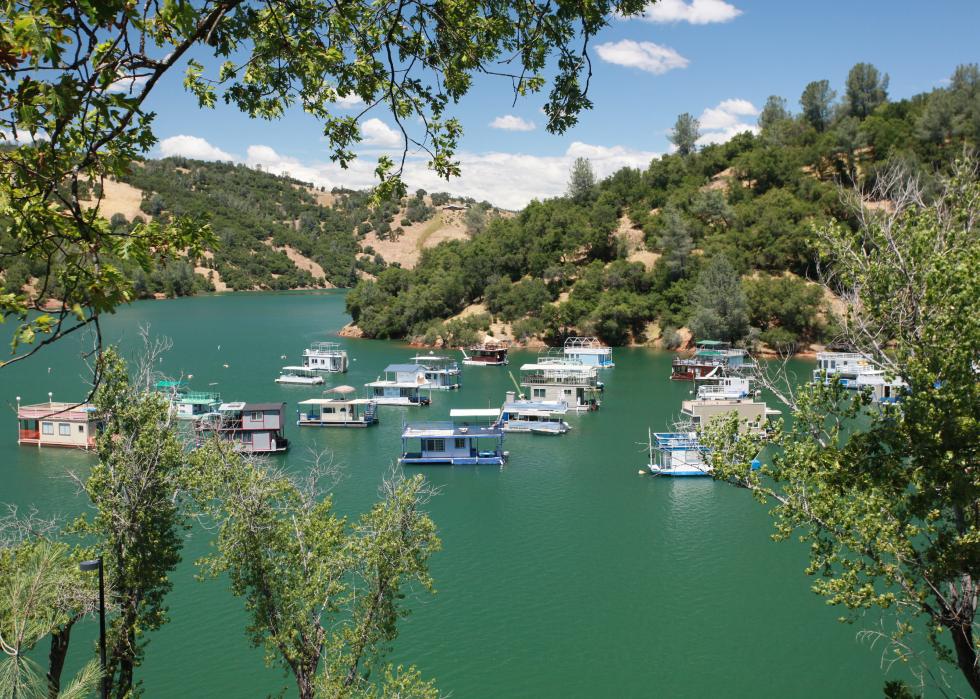
#46. Tuolumne County
– 2010 to 2020 population change: +255
— #1,292 among all counties nationwide
– 2010 to 2020 percent population change: +0.5%
— #47 among counties in California, #1,420 among all counties nationwide
– 2020 population: 55,620
— #43 largest county in California, #926 largest county nationwide
You may also like: Highest rated beer in California
#45. Colusa County
– 2010 to 2020 population change: +420
— #1,196 among all counties nationwide
– 2010 to 2020 percent population change: +2.0%
— #43 among counties in California, #1,189 among all counties nationwide
– 2020 population: 21,839
— #50 largest county in California, #1,721 largest county nationwide
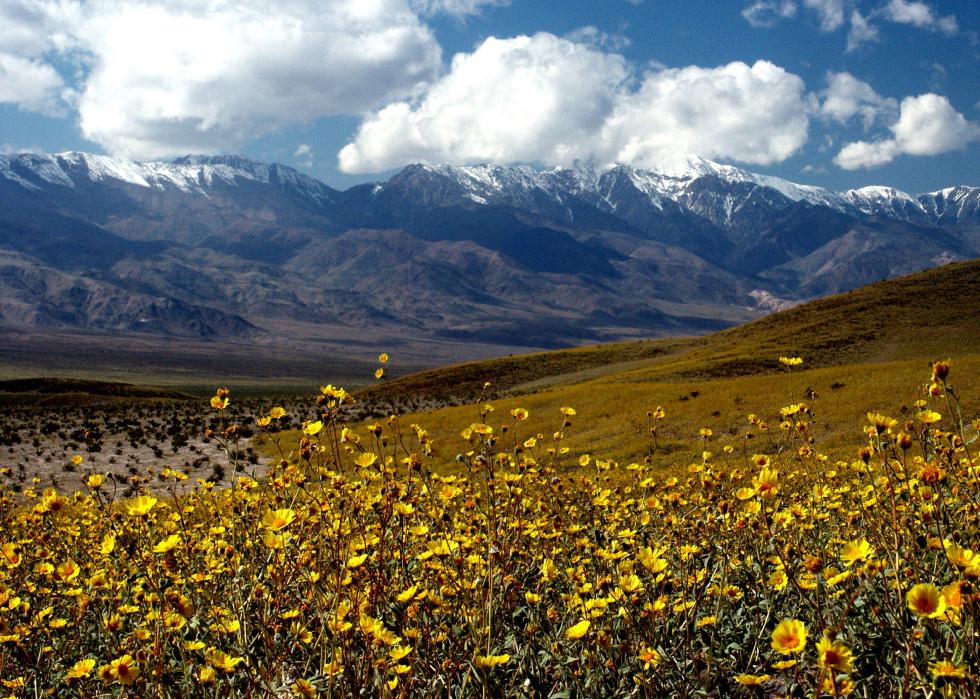
#44. Inyo County
– 2010 to 2020 population change: +470
— #1,160 among all counties nationwide
– 2010 to 2020 percent population change: +2.5%
— #39 among counties in California, #1,112 among all counties nationwide
– 2020 population: 19,016
— #52 largest county in California, #1,870 largest county nationwide
#43. Glenn County
– 2010 to 2020 population change: +795
— #1,060 among all counties nationwide
– 2010 to 2020 percent population change: +2.8%
— #37 among counties in California, #1,083 among all counties nationwide
– 2020 population: 28,917
— #48 largest county in California, #1,459 largest county nationwide

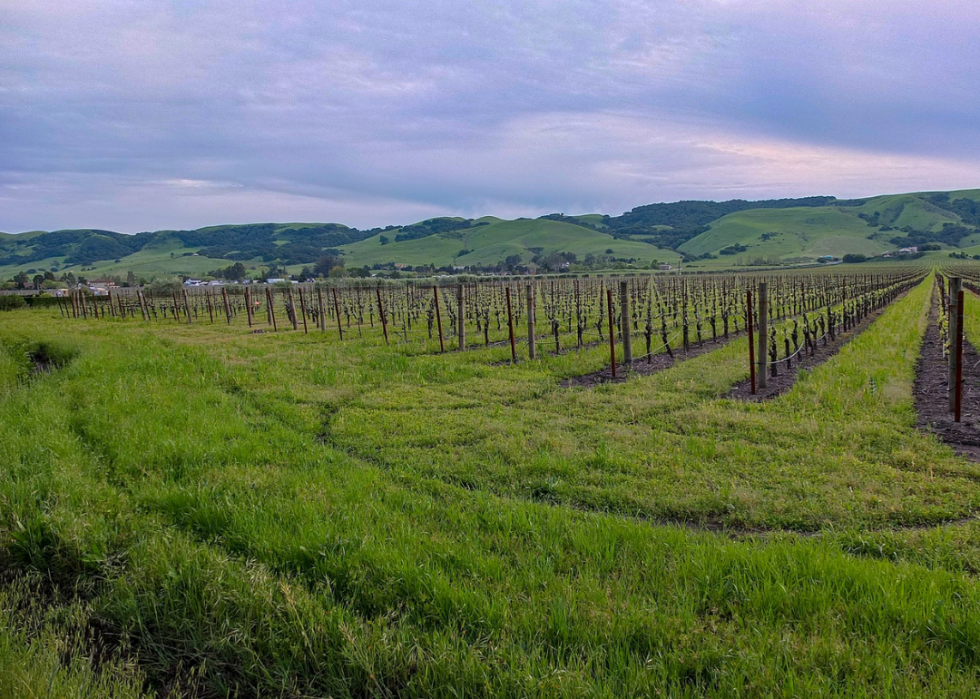
#42. Napa County
– 2010 to 2020 population change: +1,535
— #895 among all counties nationwide
– 2010 to 2020 percent population change: +1.1%
— #45 among counties in California, #1,321 among all counties nationwide
– 2020 population: 138,019
— #34 largest county in California, #470 largest county nationwide

#41. Humboldt County
– 2010 to 2020 population change: +1,840
— #841 among all counties nationwide
– 2010 to 2020 percent population change: +1.4%
— #44 among counties in California, #1,270 among all counties nationwide
– 2020 population: 136,463
— #35 largest county in California, #476 largest county nationwide
You may also like: Most popular boy names in the 60s in California
#40. Trinity County
– 2010 to 2020 population change: +2,326
— #777 among all counties nationwide
– 2010 to 2020 percent population change: +16.9%
— #1 among counties in California, #167 among all counties nationwide
– 2020 population: 16,112
— #54 largest county in California, #2,028 largest county nationwide

#39. Tehama County
– 2010 to 2020 population change: +2,366
— #771 among all counties nationwide
– 2010 to 2020 percent population change: +3.7%
— #32 among counties in California, #962 among all counties nationwide
– 2020 population: 65,829
— #41 largest county in California, #815 largest county nationwide
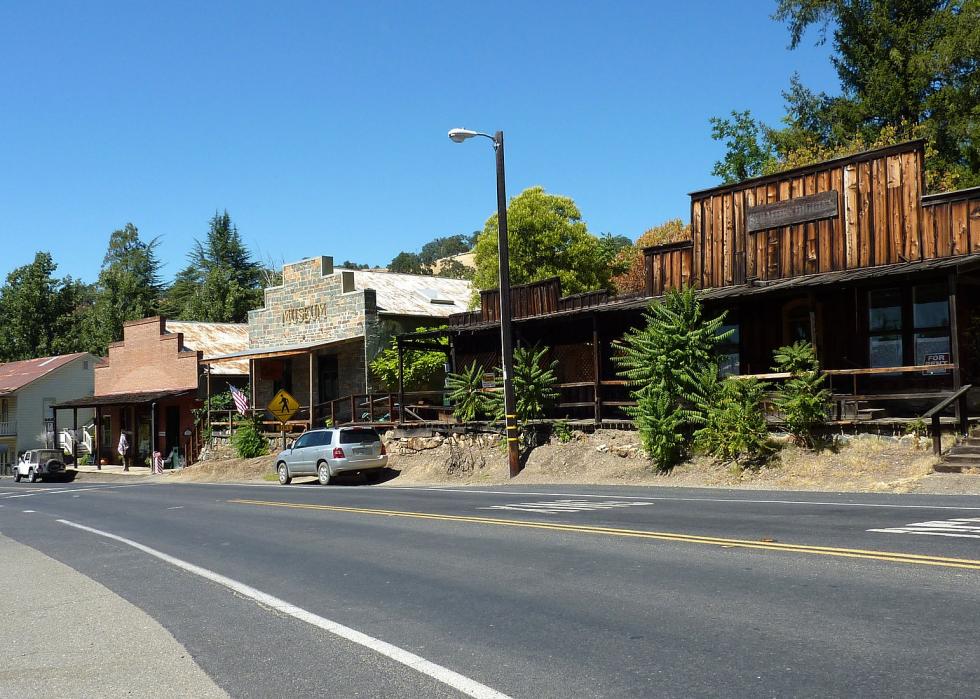
#38. Amador County
– 2010 to 2020 population change: +2,383
— #766 among all counties nationwide
– 2010 to 2020 percent population change: +6.3%
— #22 among counties in California, #682 among all counties nationwide
– 2020 population: 40,474
— #46 largest county in California, #1,172 largest county nationwide
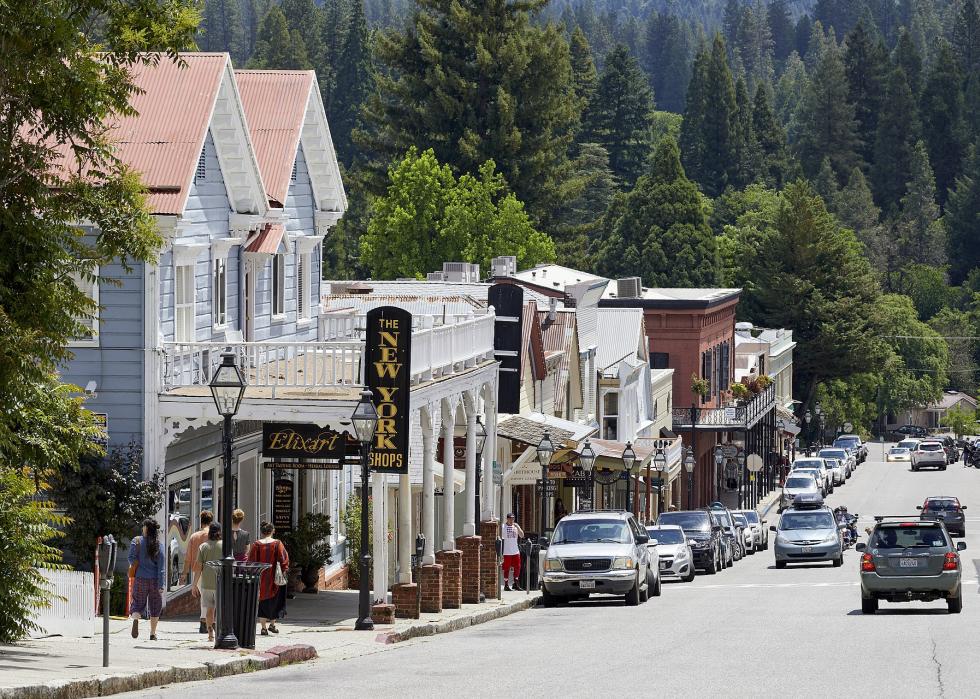
#37. Nevada County
– 2010 to 2020 population change: +3,477
— #665 among all counties nationwide
– 2010 to 2020 percent population change: +3.5%
— #34 among counties in California, #988 among all counties nationwide
– 2020 population: 102,241
— #36 largest county in California, #595 largest county nationwide
#36. Lake County
– 2010 to 2020 population change: +3,498
— #664 among all counties nationwide
– 2010 to 2020 percent population change: +5.4%
— #27 among counties in California, #781 among all counties nationwide
– 2020 population: 68,163
— #40 largest county in California, #783 largest county nationwide
You may also like: Best counties to retire to in California

#35. Mendocino County
– 2010 to 2020 population change: +3,760
— #642 among all counties nationwide
– 2010 to 2020 percent population change: +4.3%
— #30 among counties in California, #897 among all counties nationwide
– 2020 population: 91,601
— #38 largest county in California, #651 largest county nationwide
#34. Sutter County
– 2010 to 2020 population change: +4,896
— #571 among all counties nationwide
– 2010 to 2020 percent population change: +5.2%
— #28 among counties in California, #800 among all counties nationwide
– 2020 population: 99,633
— #37 largest county in California, #609 largest county nationwide

#33. Shasta County
– 2010 to 2020 population change: +4,932
— #570 among all counties nationwide
– 2010 to 2020 percent population change: +2.8%
— #38 among counties in California, #1,085 among all counties nationwide
– 2020 population: 182,155
— #30 largest county in California, #366 largest county nationwide
#32. Sonoma County
– 2010 to 2020 population change: +4,985
— #567 among all counties nationwide
– 2010 to 2020 percent population change: +1.0%
— #46 among counties in California, #1,332 among all counties nationwide
– 2020 population: 488,863
— #17 largest county in California, #147 largest county nationwide
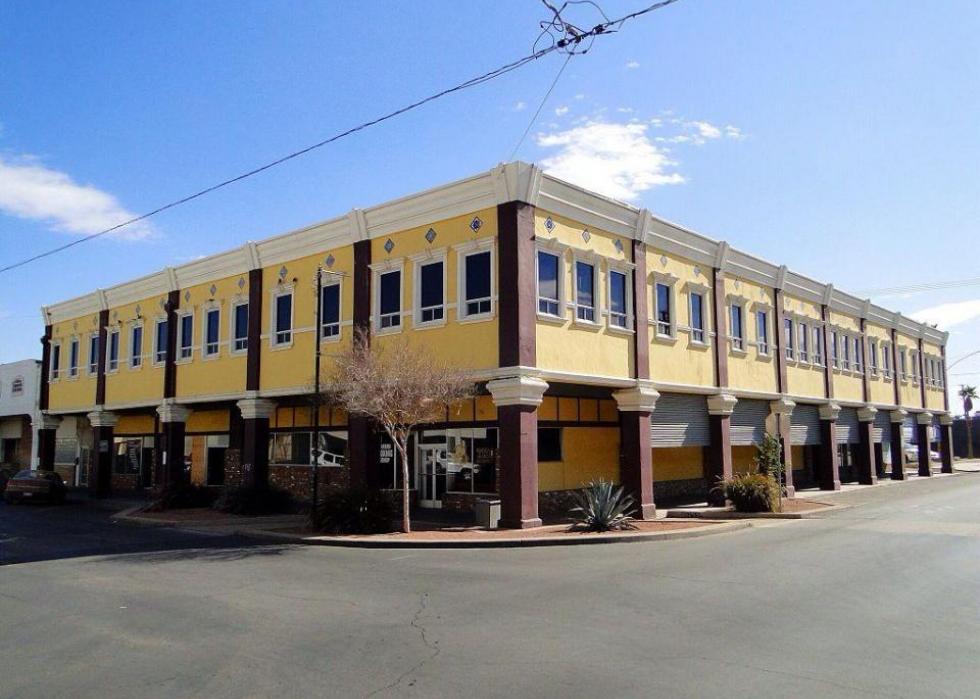
#31. Imperial County
– 2010 to 2020 population change: +5,174
— #558 among all counties nationwide
– 2010 to 2020 percent population change: +3.0%
— #36 among counties in California, #1,060 among all counties nationwide
– 2020 population: 179,702
— #31 largest county in California, #374 largest county nationwide
You may also like: Most valuable crops grown in California
#30. Madera County
– 2010 to 2020 population change: +5,390
— #552 among all counties nationwide
– 2010 to 2020 percent population change: +3.6%
— #33 among counties in California, #977 among all counties nationwide
– 2020 population: 156,255
— #32 largest county in California, #432 largest county nationwide
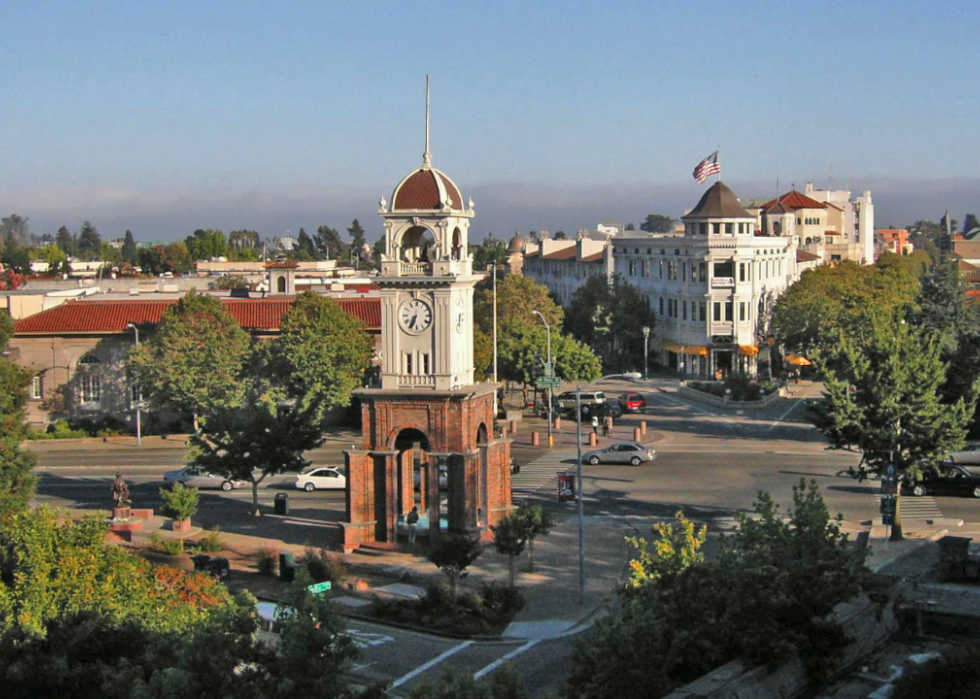
#29. Santa Cruz County
– 2010 to 2020 population change: +8,479
— #469 among all counties nationwide
– 2010 to 2020 percent population change: +3.2%
— #35 among counties in California, #1,021 among all counties nationwide
– 2020 population: 270,861
— #25 largest county in California, #258 largest county nationwide
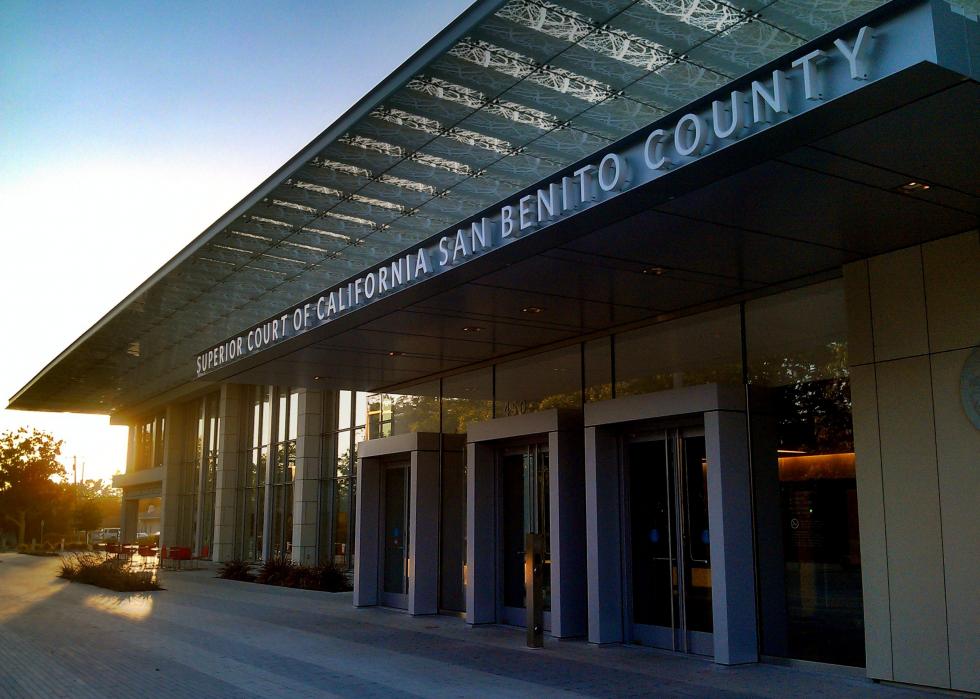
#28. San Benito County
– 2010 to 2020 population change: +8,940
— #453 among all counties nationwide
– 2010 to 2020 percent population change: +16.2%
— #2 among counties in California, #186 among all counties nationwide
– 2020 population: 64,209
— #42 largest county in California, #840 largest county nationwide
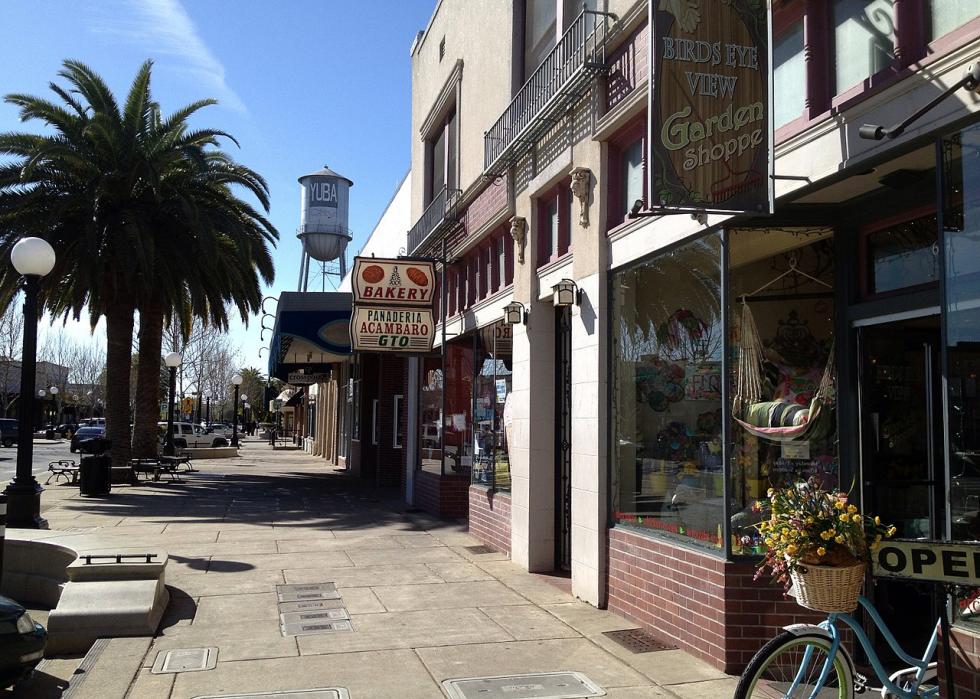
#27. Yuba County
– 2010 to 2020 population change: +9,420
— #444 among all counties nationwide
– 2010 to 2020 percent population change: +13.1%
— #5 among counties in California, #285 among all counties nationwide
– 2020 population: 81,575
— #39 largest county in California, #703 largest county nationwide
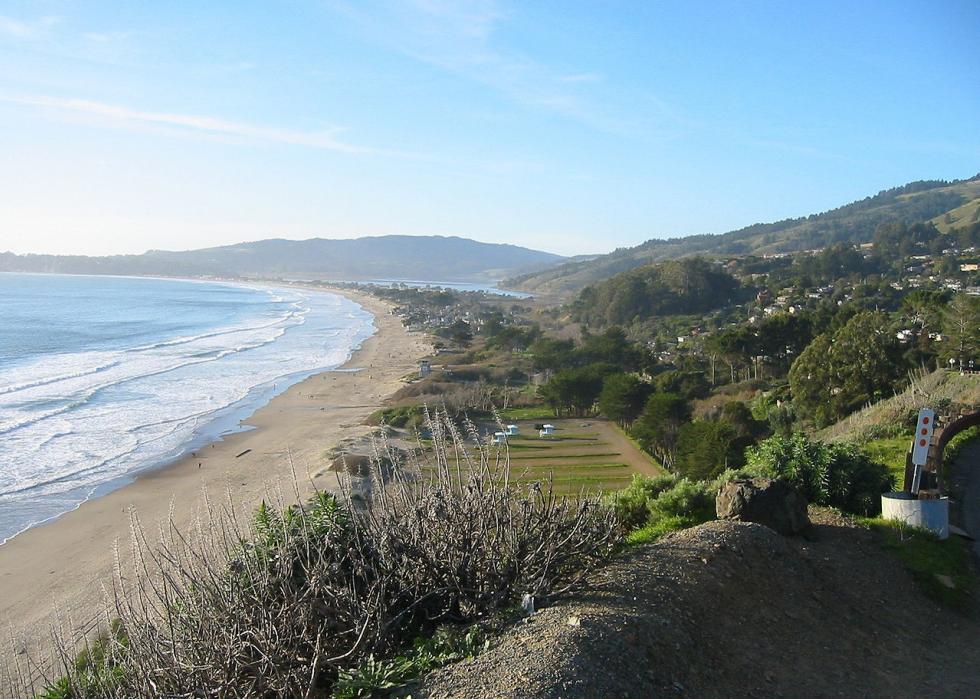
#26. Marin County
– 2010 to 2020 population change: +9,912
— #425 among all counties nationwide
– 2010 to 2020 percent population change: +3.9%
— #31 among counties in California, #935 among all counties nationwide
– 2020 population: 262,321
— #26 largest county in California, #267 largest county nationwide
You may also like: Famous actresses from California
#25. El Dorado County
– 2010 to 2020 population change: +10,127
— #419 among all counties nationwide
– 2010 to 2020 percent population change: +5.6%
— #26 among counties in California, #761 among all counties nationwide
– 2020 population: 191,185
— #29 largest county in California, #351 largest county nationwide
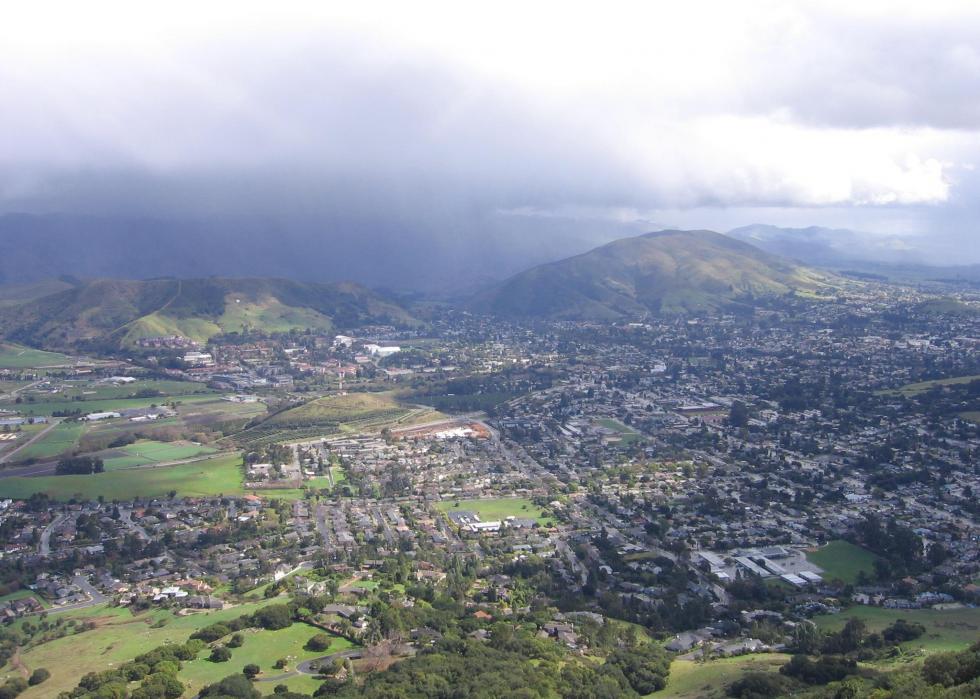
#24. San Luis Obispo County
– 2010 to 2020 population change: +12,787
— #376 among all counties nationwide
– 2010 to 2020 percent population change: +4.7%
— #29 among counties in California, #853 among all counties nationwide
– 2020 population: 282,424
— #23 largest county in California, #248 largest county nationwide

#23. Yolo County
– 2010 to 2020 population change: +15,554
— #339 among all counties nationwide
– 2010 to 2020 percent population change: +7.7%
— #16 among counties in California, #583 among all counties nationwide
– 2020 population: 216,403
— #27 largest county in California, #317 largest county nationwide
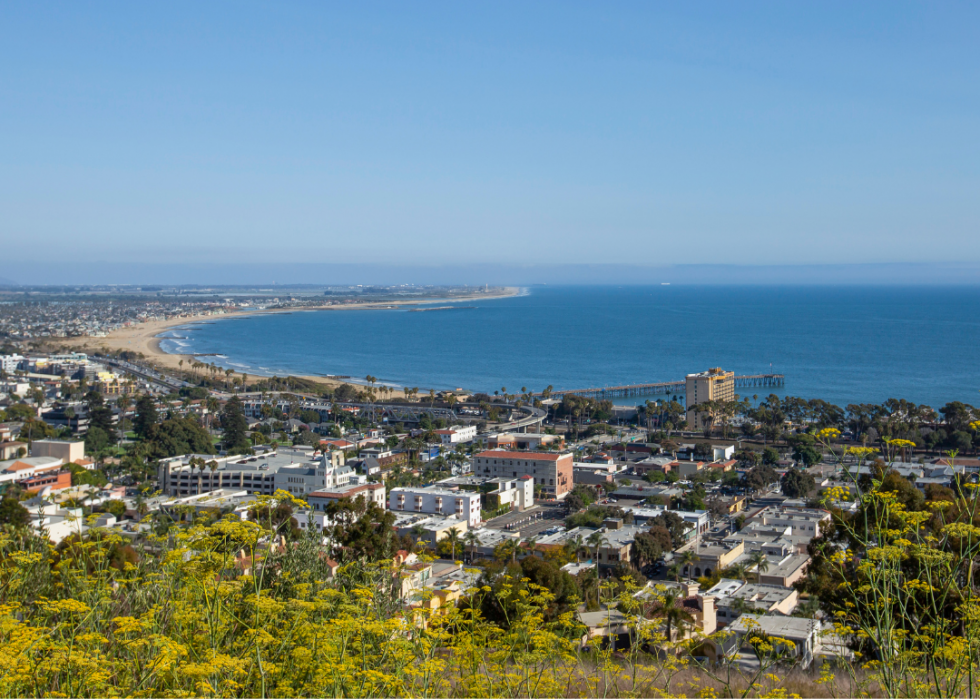
#22. Ventura County
– 2010 to 2020 population change: +20,525
— #285 among all counties nationwide
– 2010 to 2020 percent population change: +2.5%
— #40 among counties in California, #1,117 among all counties nationwide
– 2020 population: 843,843
— #13 largest county in California, #75 largest county nationwide
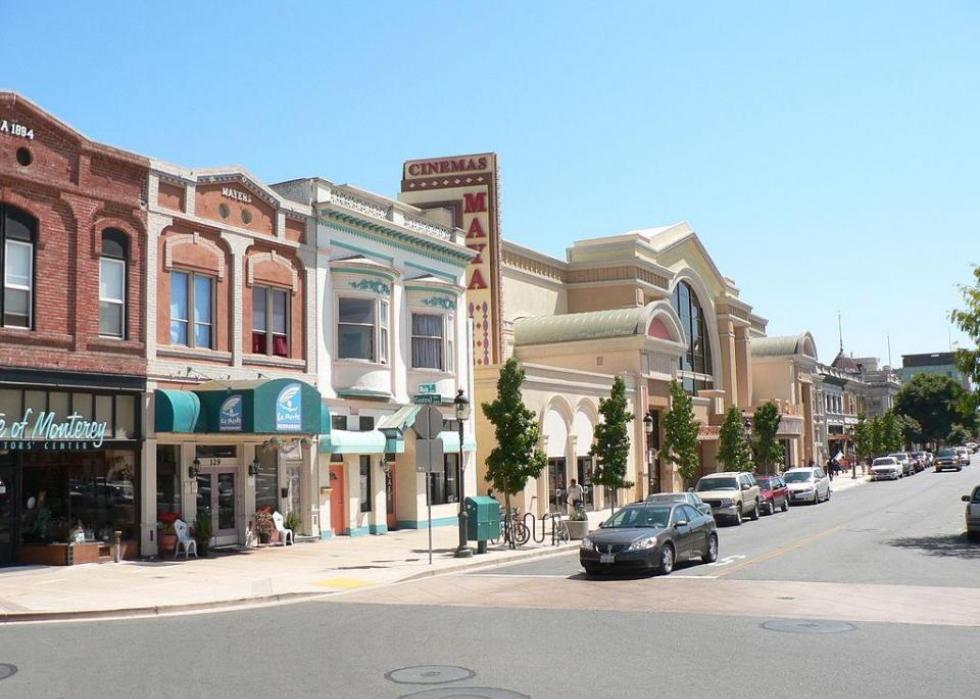
#21. Monterey County
– 2010 to 2020 population change: +23,978
— #257 among all counties nationwide
– 2010 to 2020 percent population change: +5.8%
— #24 among counties in California, #743 among all counties nationwide
– 2020 population: 439,035
— #21 largest county in California, #163 largest county nationwide
You may also like: Counties most concerned about climate change in California
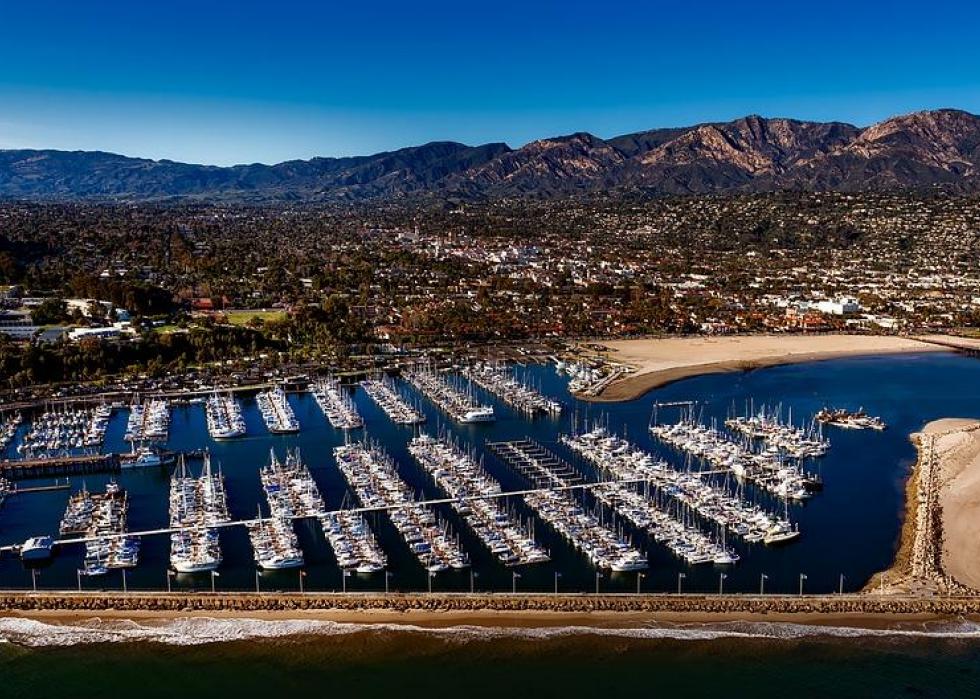
#20. Santa Barbara County
– 2010 to 2020 population change: +24,334
— #252 among all counties nationwide
– 2010 to 2020 percent population change: +5.7%
— #25 among counties in California, #746 among all counties nationwide
– 2020 population: 448,229
— #20 largest county in California, #160 largest county nationwide
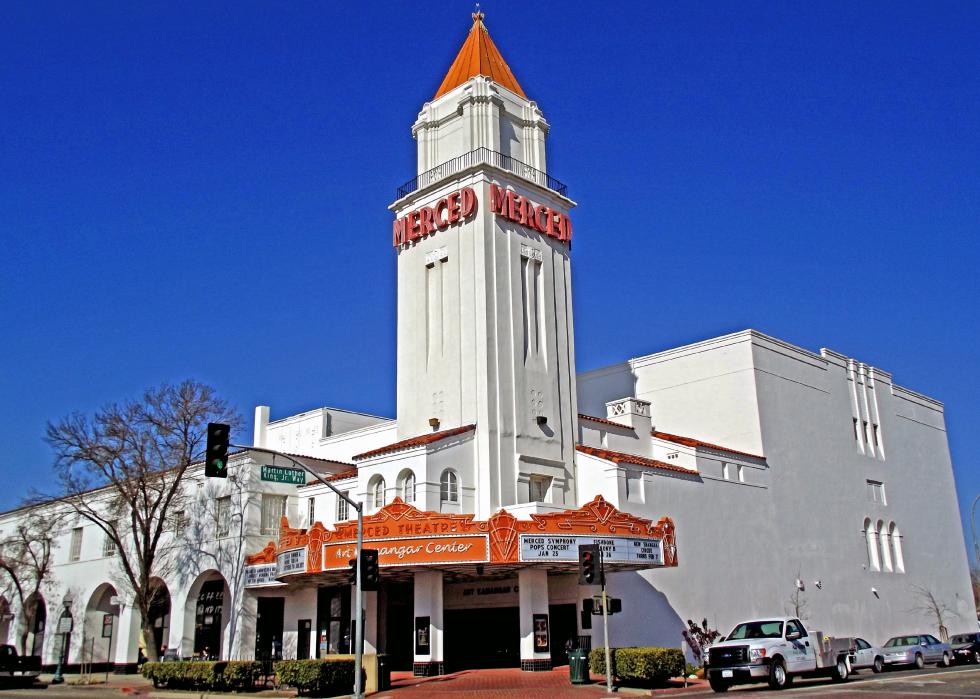
#19. Merced County
– 2010 to 2020 population change: +25,409
— #246 among all counties nationwide
– 2010 to 2020 percent population change: +9.9%
— #10 among counties in California, #425 among all counties nationwide
– 2020 population: 281,202
— #24 largest county in California, #250 largest county nationwide
#18. Tulare County
– 2010 to 2020 population change: +30,938
— #210 among all counties nationwide
– 2010 to 2020 percent population change: +7.0%
— #19 among counties in California, #636 among all counties nationwide
– 2020 population: 473,117
— #18 largest county in California, #152 largest county nationwide
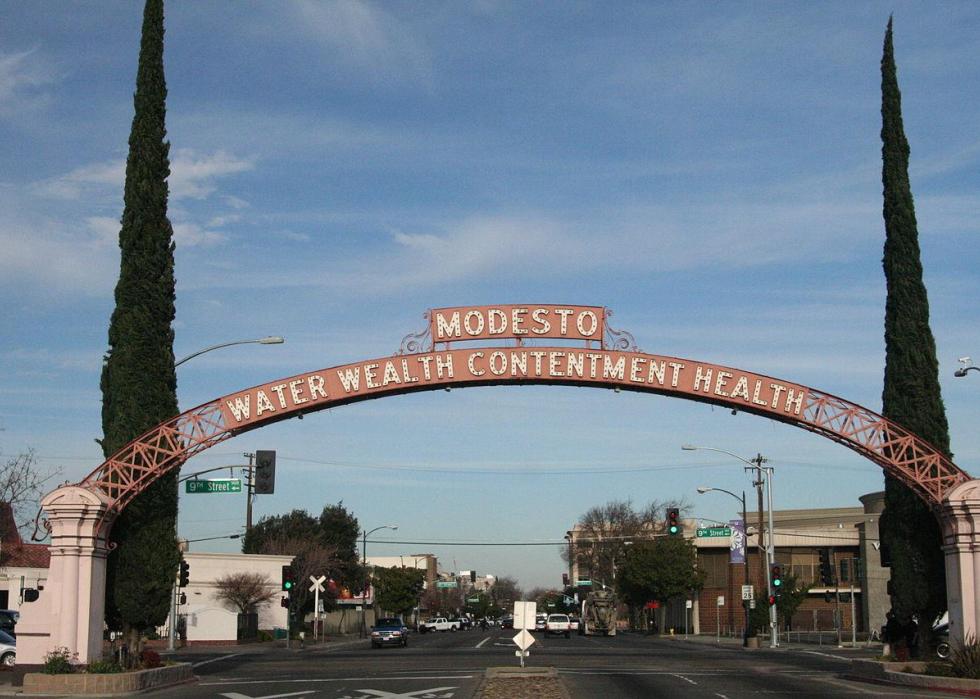
#17. Stanislaus County
– 2010 to 2020 population change: +38,425
— #170 among all counties nationwide
– 2010 to 2020 percent population change: +7.5%
— #17 among counties in California, #600 among all counties nationwide
– 2020 population: 552,878
— #16 largest county in California, #127 largest county nationwide
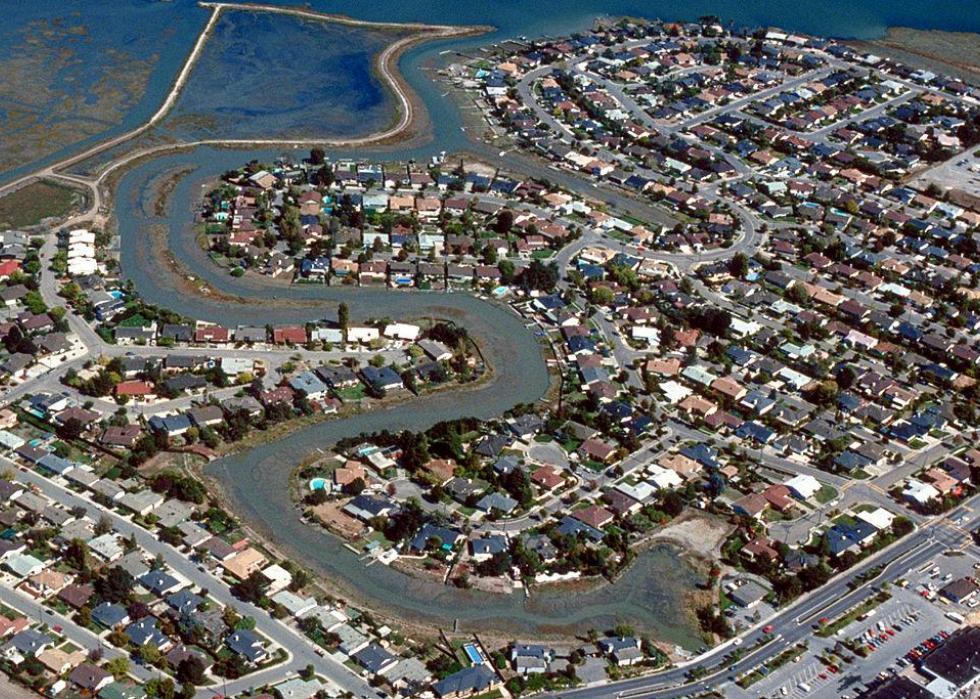
#16. Solano County
– 2010 to 2020 population change: +40,147
— #164 among all counties nationwide
– 2010 to 2020 percent population change: +9.7%
— #11 among counties in California, #439 among all counties nationwide
– 2020 population: 453,491
— #19 largest county in California, #159 largest county nationwide
You may also like: Best places to retire in California
#15. San Mateo County
– 2010 to 2020 population change: +45,991
— #141 among all counties nationwide
– 2010 to 2020 percent population change: +6.4%
— #21 among counties in California, #673 among all counties nationwide
– 2020 population: 764,442
— #15 largest county in California, #86 largest county nationwide

#14. Placer County
– 2010 to 2020 population change: +56,307
— #113 among all counties nationwide
– 2010 to 2020 percent population change: +16.2%
— #3 among counties in California, #188 among all counties nationwide
– 2020 population: 404,739
— #22 largest county in California, #178 largest county nationwide

#13. San Francisco County
– 2010 to 2020 population change: +68,730
— #88 among all counties nationwide
– 2010 to 2020 percent population change: +8.5%
— #13 among counties in California, #516 among all counties nationwide
– 2020 population: 873,965
— #12 largest county in California, #66 largest county nationwide

#12. Kern County
– 2010 to 2020 population change: +69,604
— #87 among all counties nationwide
– 2010 to 2020 percent population change: +8.3%
— #15 among counties in California, #536 among all counties nationwide
– 2020 population: 909,235
— #11 largest county in California, #62 largest county nationwide

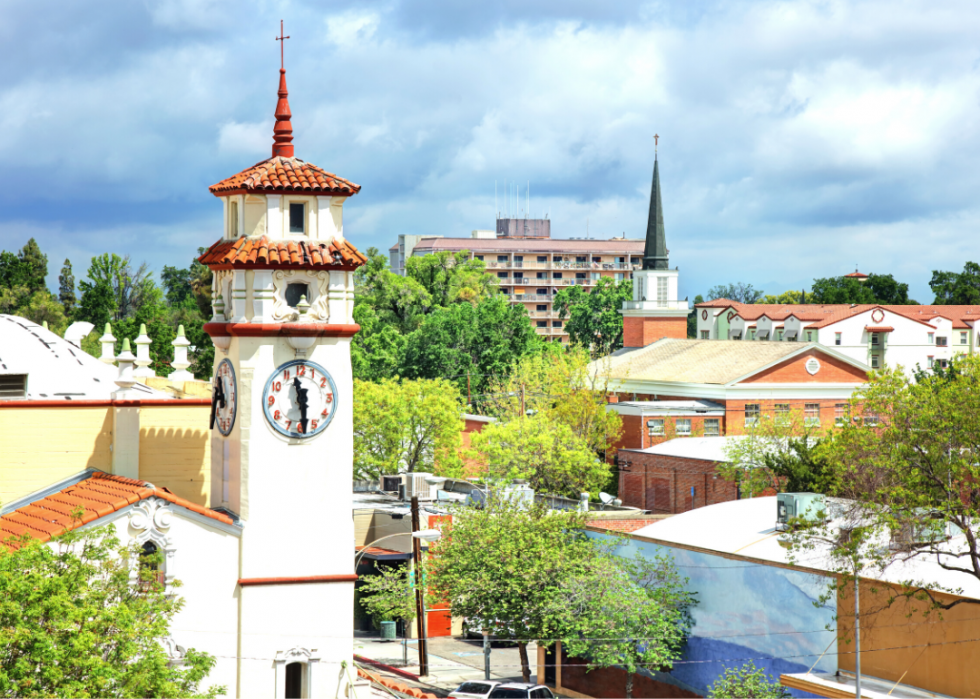
#11. Fresno County
– 2010 to 2020 population change: +78,204
— #69 among all counties nationwide
– 2010 to 2020 percent population change: +8.4%
— #14 among counties in California, #525 among all counties nationwide
– 2020 population: 1,008,654
— #10 largest county in California, #47 largest county nationwide
You may also like: Most popular baby names for boys of the last decade in California
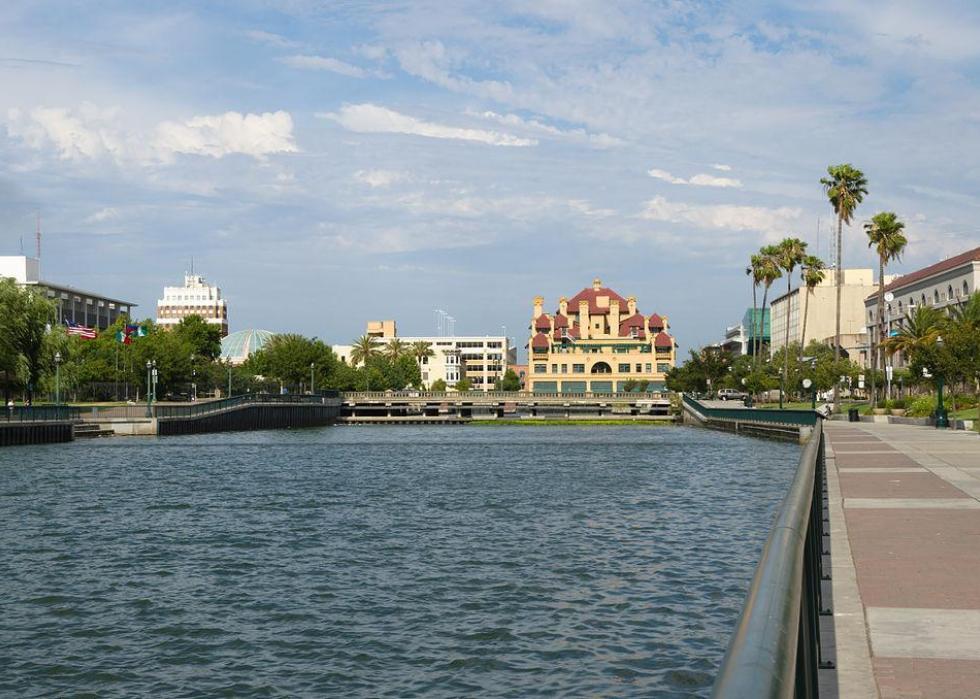
#10. San Joaquin County
– 2010 to 2020 population change: +93,927
— #53 among all counties nationwide
– 2010 to 2020 percent population change: +13.7%
— #4 among counties in California, #260 among all counties nationwide
– 2020 population: 779,233
— #14 largest county in California, #84 largest county nationwide
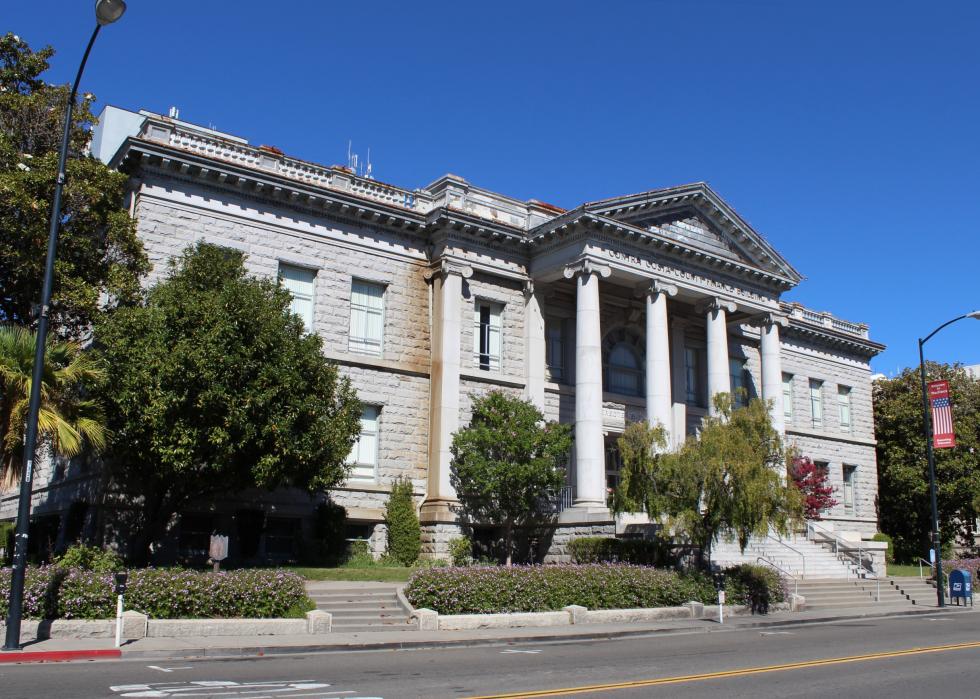
#9. Contra Costa County
– 2010 to 2020 population change: +116,902
— #43 among all counties nationwide
– 2010 to 2020 percent population change: +11.1%
— #8 among counties in California, #363 among all counties nationwide
– 2020 population: 1,165,927
— #9 largest county in California, #38 largest county nationwide
#8. San Bernardino County
– 2010 to 2020 population change: +146,444
— #33 among all counties nationwide
– 2010 to 2020 percent population change: +7.2%
— #18 among counties in California, #617 among all counties nationwide
– 2020 population: 2,181,654
— #5 largest county in California, #14 largest county nationwide
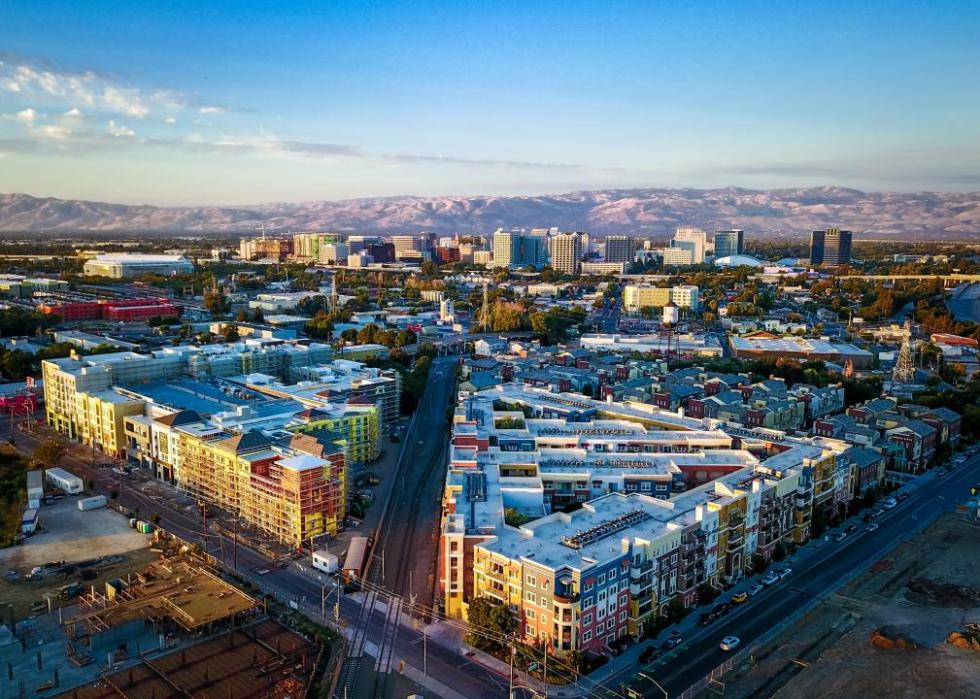
#7. Santa Clara County
– 2010 to 2020 population change: +154,617
— #31 among all counties nationwide
– 2010 to 2020 percent population change: +8.7%
— #12 among counties in California, #504 among all counties nationwide
– 2020 population: 1,936,259
— #6 largest county in California, #18 largest county nationwide

#6. Sacramento County
– 2010 to 2020 population change: +166,267
— #27 among all counties nationwide
– 2010 to 2020 percent population change: +11.7%
— #6 among counties in California, #339 among all counties nationwide
– 2020 population: 1,585,055
— #8 largest county in California, #24 largest county nationwide
You may also like: Most popular baby names for boys in California
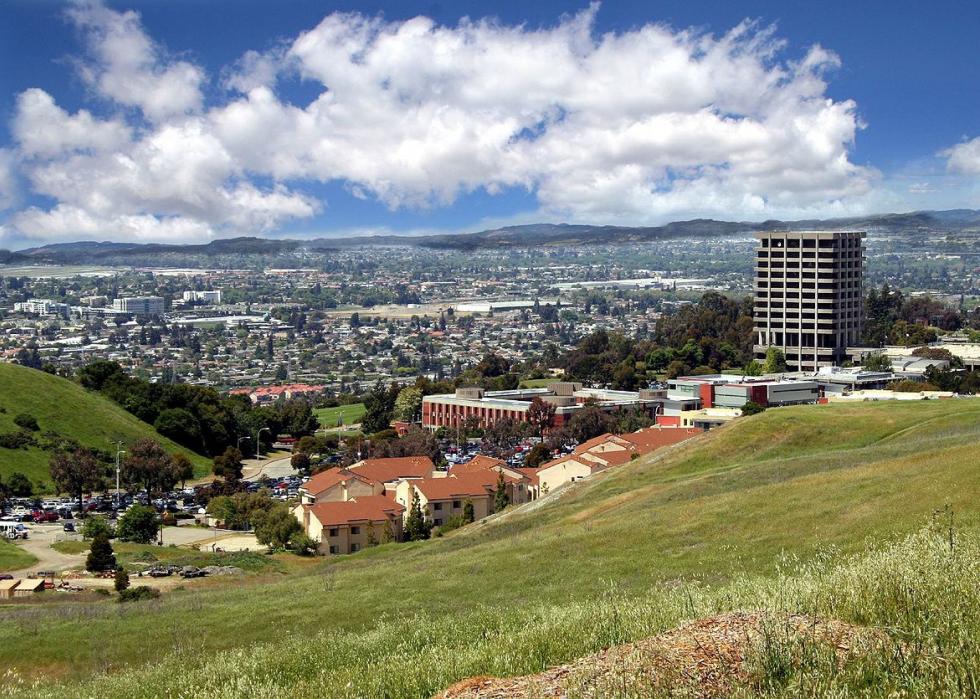
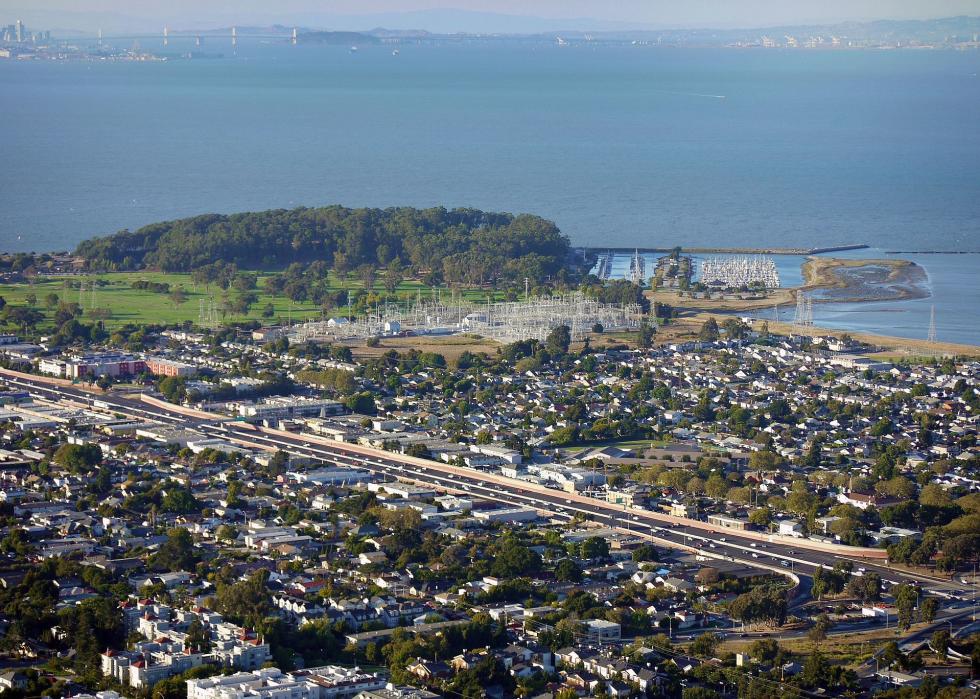
#5. Alameda County
– 2010 to 2020 population change: +172,082
— #25 among all counties nationwide
– 2010 to 2020 percent population change: +11.4%
— #7 among counties in California, #349 among all counties nationwide
– 2020 population: 1,682,353
— #7 largest county in California, #21 largest county nationwide

#4. Orange County
– 2010 to 2020 population change: +176,757
— #23 among all counties nationwide
– 2010 to 2020 percent population change: +5.9%
— #23 among counties in California, #731 among all counties nationwide
– 2020 population: 3,186,989
— #3 largest county in California, #6 largest county nationwide
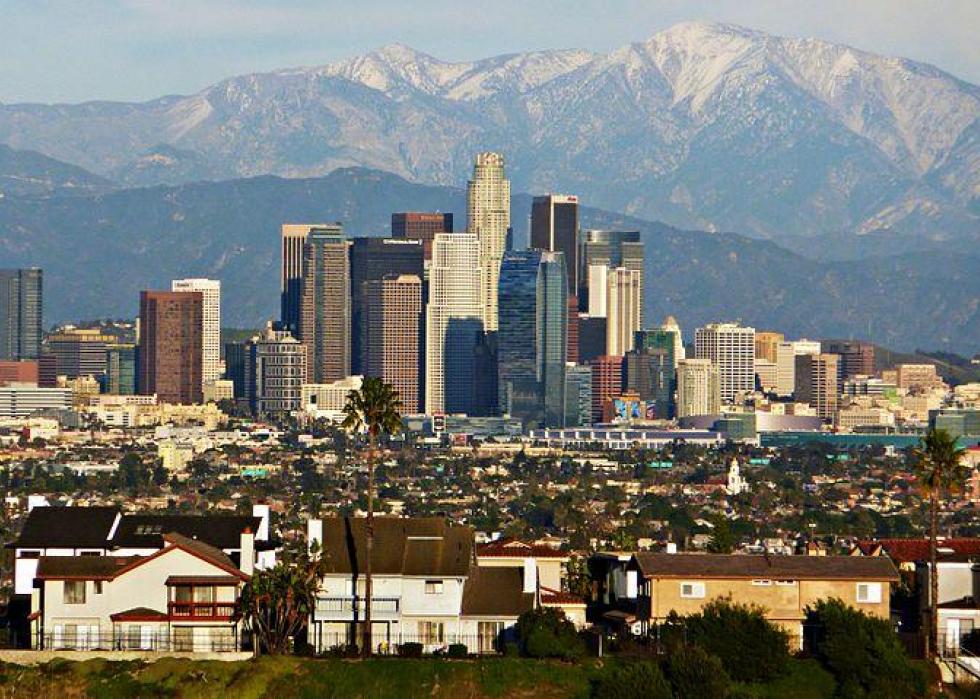
#3. Los Angeles County
– 2010 to 2020 population change: +195,404
— #21 among all counties nationwide
– 2010 to 2020 percent population change: +2.0%
— #42 among counties in California, #1,184 among all counties nationwide
– 2020 population: 10,014,009
— #1 largest county in California, #1 largest county nationwide

#2. San Diego County
– 2010 to 2020 population change: +203,321
— #18 among all counties nationwide
– 2010 to 2020 percent population change: +6.6%
— #20 among counties in California, #660 among all counties nationwide
– 2020 population: 3,298,634
— #2 largest county in California, #5 largest county nationwide
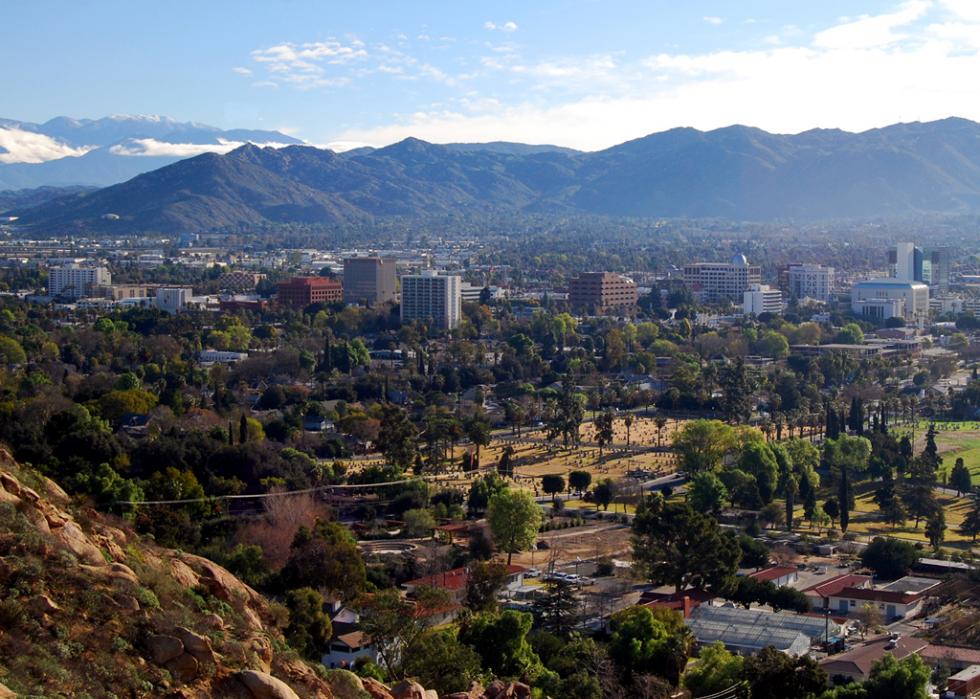
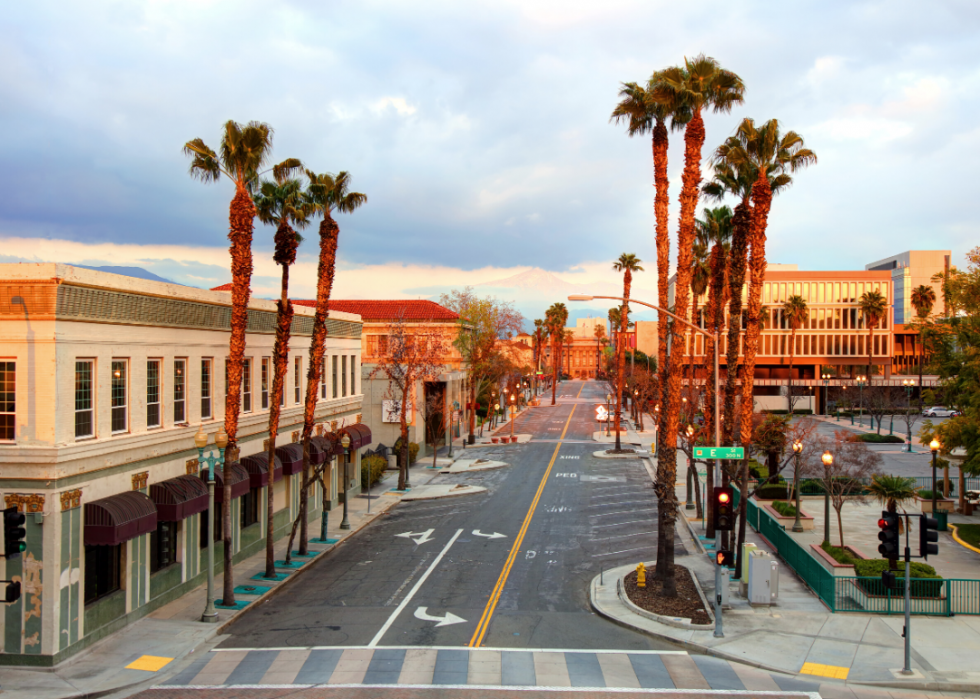
#1. Riverside County
– 2010 to 2020 population change: +228,544
— #15 among all counties nationwide
– 2010 to 2020 percent population change: +10.4%
— #9 among counties in California, #394 among all counties nationwide
– 2020 population: 2,418,185
— #4 largest county in California, #10 largest county nationwide


