
 Print
Print

News
There are currently no news stories available for this symbol.

RELATED RESOURCES |
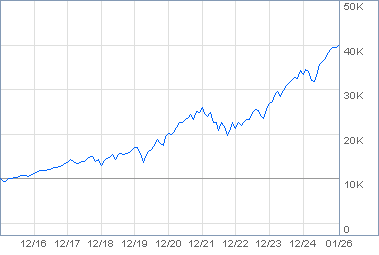
Snapshot: SPYSPDR S&P 500 ETF TRUST439.46 as of 4:10:00pm ET 06/16/2023
Quotes delayed at least 15 min.
Log in for real time quote.
|
|||||||||||||||||||||||||||||||||||||||||||||||||||||||||||||||||||||||||||||||||||||||||||||||||||||||||||||||||||||||||||||||||||||
ETP TypeETF Net Assets
|
||||||||||||||||||||||||||||||||||||||||||||||||||||||||||||||||||||||||||||||||||||||||||||||||||||||||||||||||||||||||||||||||||
| LAST CHANGE | ||||
|---|---|---|---|---|
| Firm Name | As of Date | Action | Rating | Report |
| FactSet | 06/16/2023 | -- | A Details |  |
| Morningstar, Inc.** | 04/30/2022 | Downgrade |   Overall - 1281 funds rated Rating Information |
|
| 30-day SEC Yield AS OF 05/31/2023 | 1.49% |
|---|---|
| Distribution Yield (TTM) AS OF 05/31/2023 |
1.55% |
| SPY SPDR S&P 500 ETF TRUST |
Asset Class Median | |
|---|---|---|
| Volume (10-Day Avg) AS OF 06/15/2023 |
84.6M | 15.2M |
| 1 Month Market Total Return AS OF 06/16/2023 |
+7.16 | +7.13% |
| 1 Year Market Total Return AS OF 05/31/2023 |
+2.92 | -2.28% |
| 3 Year Annualized Market Total Return AS OF 05/31/2023 |
+12.87 | +12.06% |
| Beta (1 Year Month-End) AS OF 06/16/2023 |
1.00% | 1.00 |
| Annual Turnover Ratio AS OF 09/30/2022 |
2.00% | 38.00% |
| Net Expense Ratio AS OF 01/30/2023 |
0.09% | 0.38% |
| NAV Return | Market Return | |
|---|---|---|
| 1 Year | -7.75 | -7.81 |
| 3 Year | +18.50 | +18.48 |
| 5 Year | +11.12 | +11.13 |
| 10 Year | +12.14 | +12.15 |
| Life | +9.72 | +9.69 |
The performance data featured represents past performance, which is no guarantee of future results. Investment return and principal value of an investment will fluctuate; therefore, you may have a gain or loss when you sell your shares. Current performance may be higher or lower than the performance data quoted.
More about Performance & Risk| AAPL | Apple Inc | 7.53% |
|---|---|---|
| MSFT | Microsoft Corp | 6.98% |
| AMZN | Amazon.com Inc | 3.07% |
| NVDA | NVIDIA Corp | 2.66% |
| GOOGL | Alphabet Inc Class A | 2.09% |
| GOOG | Alphabet Inc Class C | 1.83% |
| META | Meta Platforms Inc Class A | 1.68% |
| BRK.B | Berkshire Hathaway Inc Class B | 1.65% |
| TSLA | Tesla Inc | 1.57% |
| UNH | UnitedHealth Group Inc | 1.30% |

Commentary
NSPL Surpasses S&P 500 Over 1- and 3-Month Periods
ETF Database - 06/14/2023Leveraging the overnight trading session is a strategy that is outperforming in the current environment. The NightShares 500 1x/1.5x ETF (NSPL B-) offers leveraged exposure to the overnight trading session. The fund aims to provide returns that correspond to 100%...
MoreWorld Markets Watchlist: June 12
ETF Database - 06/12/2023Seven of the eight indexes on our world watch list posted gains through June 12, 2023. Nikkei 225 continued to climb, finishing in the top spot with a YTD gain of 24.29%. The U.S.‘s S&P 500 finished in second with a YTD gain of 13.46% while Germany’s...
More