Markets
Visualizing 150 Years of S&P 500 Returns
This visual is part of our 2024 Global Forecast Series. For full access to the series, learn more here.
Visualizing 150 Years of S&P 500 Returns
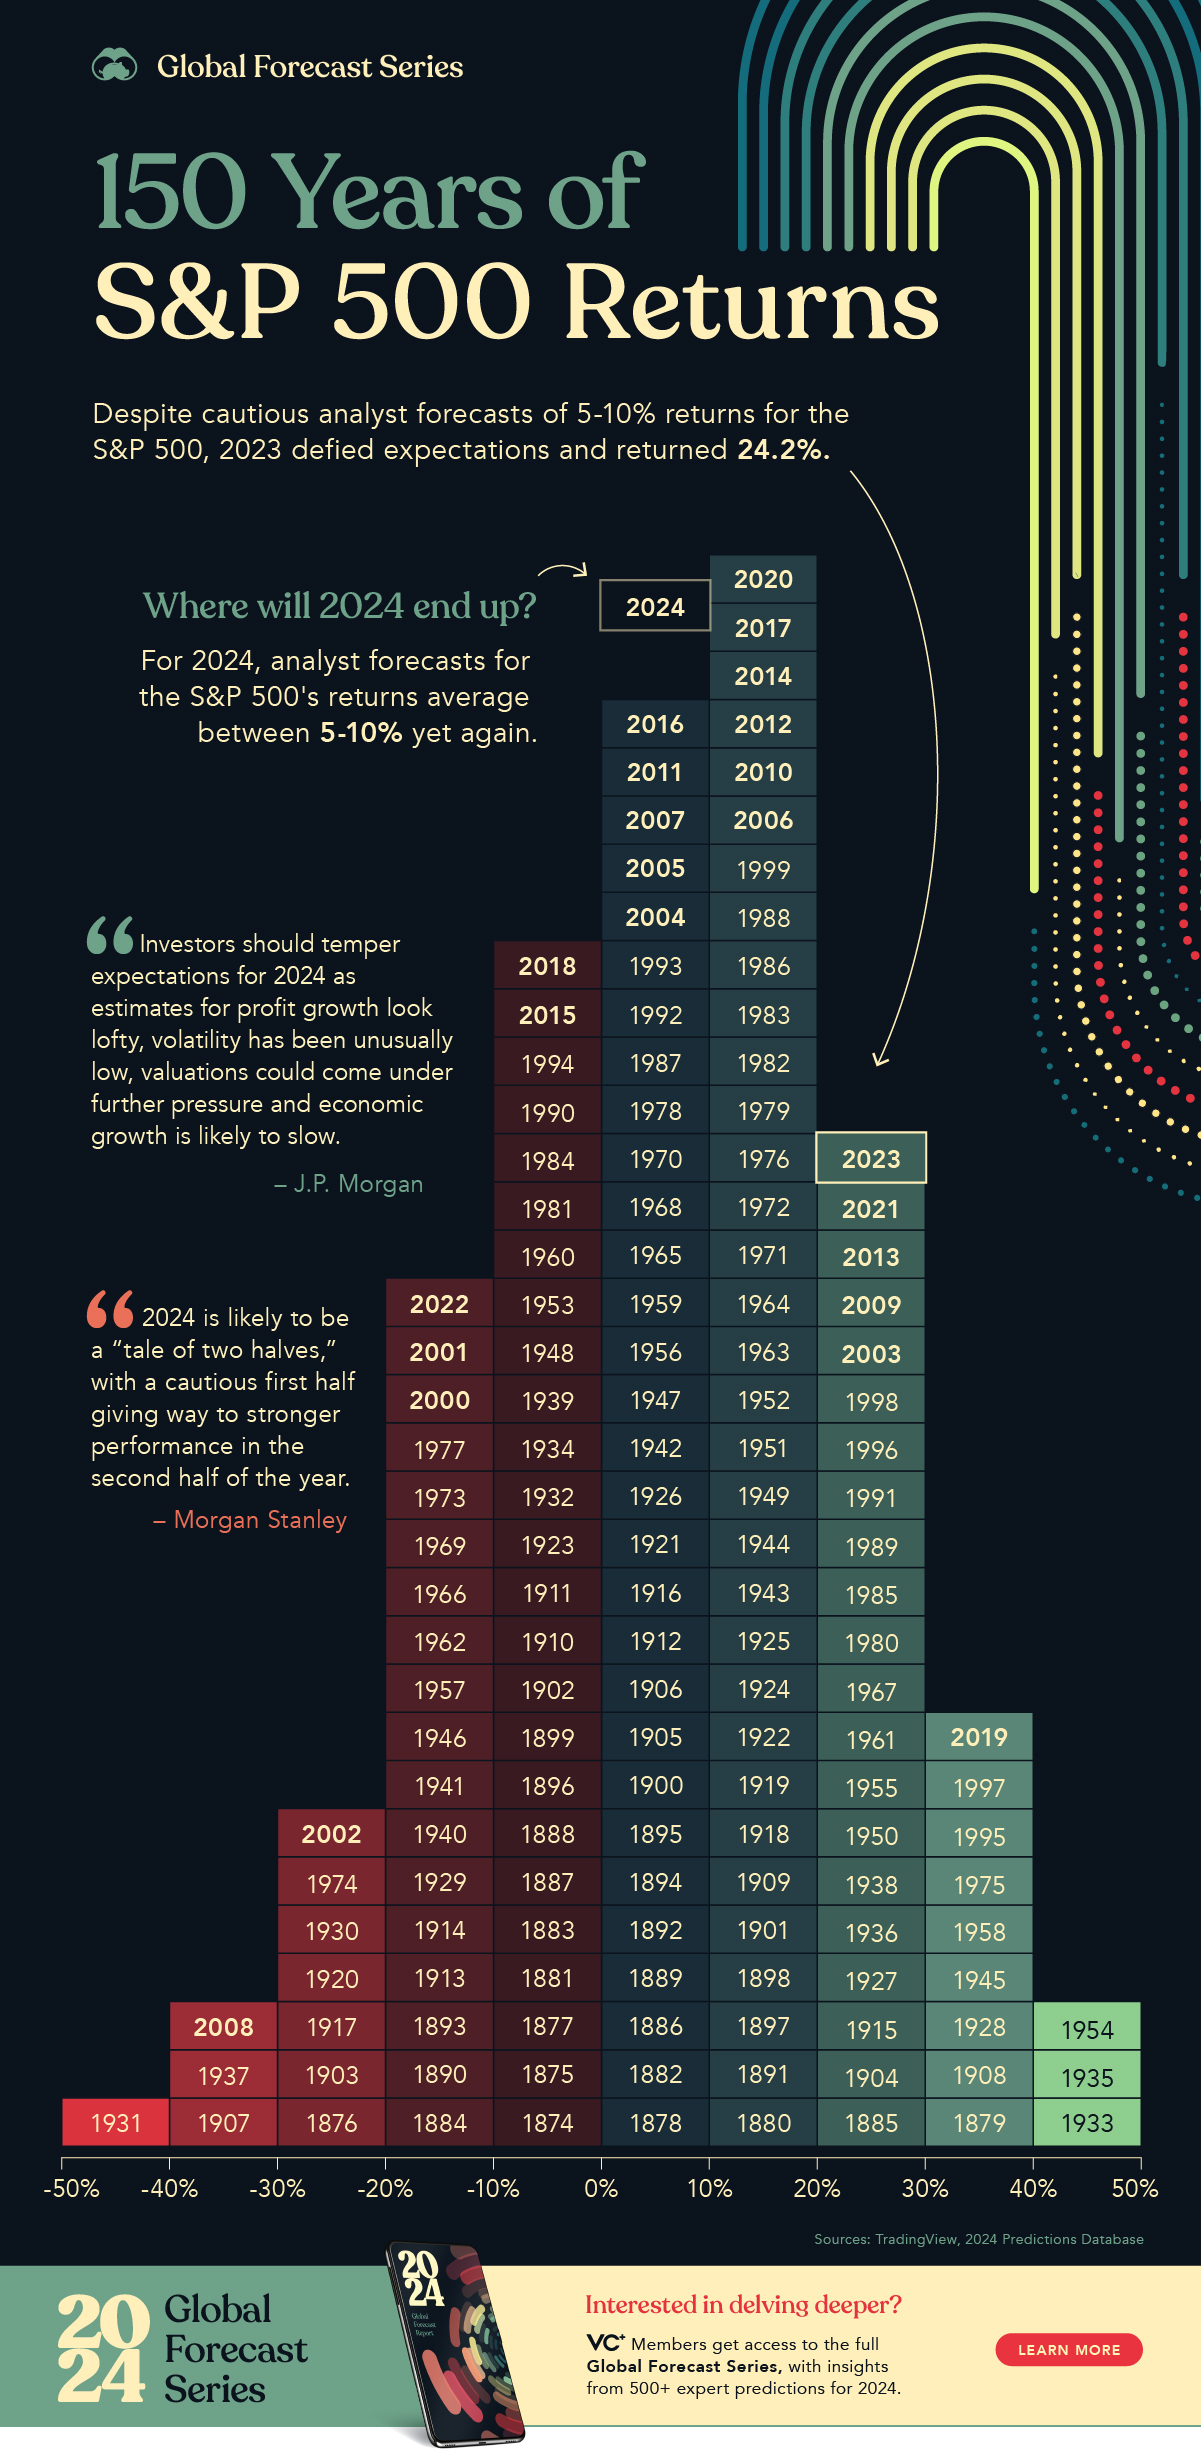
2023 was supposed to be a tough year for stocks.
However, consumers shrugged off higher interest rates, and investors were more optimistic than fearful largely due to exuberance around AI. As a result, the S&P 500 rallied over 24% in 2023.
To put these gains in perspective, this graphic shows yearly returns for the S&P 500 since 1874, using data from TradingView.
S&P 500 Historical Returns (1874-2023)
Driving the S&P 500’s returns in 2023 was the force of the “Magnificent Seven”.
These mega caps include Amazon, Apple, Nvidia, Tesla, Microsoft, Meta, and Alphabet. Together, they generated the lion’s share of the index’s returns.
By contrast, a record 72% of stocks underperformed the S&P 500 index. Overall, 2023’s stock market returns were not only rare, but comparatively quite strong, as shown in the table below:
| S&P 500 Annual Return | Number of Years | Share of Years |
|---|---|---|
| +40 to +50% or more | 3 | 2.0% |
| +30 to +40% | 9 | 5.4% |
| +20 to +30% | 21 | 14.1% |
| +10 to +20% | 33 | 22.1% |
| +0 to +10% | 30 | 20.1% |
| +0 to -10% | 25 | 16.8% |
| -10 to -20% | 18 | 12.1% |
| -20 to -30% | 7 | 4.7% |
| -30 to -40% | 3 | 2.0% |
| -40 to -50% or more | 1 | 0.7% |
Like a bell curve, the majority of returns fall near the middle, with the highest number of returns in the 10% to 20% range.

The best year was in 1933, when the market soared almost 54% during the Great Depression.
After at least 1,000 banks failed, the U.S. government set up a temporary insurance policy that would soon become the Federal Deposit Insurance Corporation (FDIC). This restored confidence and drove money back into banks, increasing the money supply and supporting more production and spending.
The market faced its worst year just two years earlier, plummeting 43% amid the collapse of the U.S. banking system. The last time stocks tumbled nearly that far was in 2008.
Forecasting S&P 500 Returns for 2024
Looking back at 2023, we can see that Wall Street’s consensus was far off the mark.
“I’ve never seen the consensus as wrong as it was in 2023.”
-Andrew Pease, Chief Investment Strategist at Russell Investments
While many firms were cautious with their forecasts going into 2023, Goldman Sachs was one of the few to say the economy would avoid a recession.
Among the main reasons behind this forecast was that real disposable personal income was rebounding and U.S. GDP looked resilient in late 2022. These factors, among others, were seen to be more powerful drivers than tighter financial conditions.
This year, Goldman Sachs estimates that the S&P 500 will see more moderate returns, rising 7%. Overall, analysts forecast that the index will return 5-10%, presenting another cautiously optimistic outlook for 2024.


Markets
Mapped: Europe’s GDP Per Capita, by Country
Which European economies are richest on a GDP per capita basis? This map shows the results for 44 countries across the continent.


Mapped: Europe’s GDP Per Capita, by Country (2024)
This was originally posted on our Voronoi app. Download the app for free on iOS or Android and discover incredible data-driven charts from a variety of trusted sources.
Europe is home to some of the largest and most sophisticated economies in the world. But how do countries in the region compare with each other on a per capita productivity basis?
In this map, we show Europe’s GDP per capita levels across 44 nations in current U.S. dollars. Data for this visualization and article is sourced from the International Monetary Fund (IMF) via their DataMapper tool, updated April 2024.
Europe’s Richest and Poorest Nations, By GDP Per Capita
Luxembourg, Ireland, and Switzerland, lead the list of Europe’s richest nations by GDP per capita, all above $100,000.
| Rank | Country | GDP Per Capita (2024) |
|---|---|---|
| 1 | 🇱🇺 Luxembourg | $131,380 |
| 2 | 🇮🇪 Ireland | $106,060 |
| 3 | 🇨🇭 Switzerland | $105,670 |
| 4 | 🇳🇴 Norway | $94,660 |
| 5 | 🇮🇸 Iceland | $84,590 |
| 6 | 🇩🇰 Denmark | $68,900 |
| 7 | 🇳🇱 Netherlands | $63,750 |
| 8 | 🇸🇲 San Marino | $59,410 |
| 9 | 🇦🇹 Austria | $59,230 |
| 10 | 🇸🇪 Sweden | $58,530 |
| 11 | 🇧🇪 Belgium | $55,540 |
| 12 | 🇫🇮 Finland | $55,130 |
| 13 | 🇩🇪 Germany | $54,290 |
| 14 | 🇬🇧 UK | $51,070 |
| 15 | 🇫🇷 France | $47,360 |
| 16 | 🇦🇩 Andorra | $44,900 |
| 17 | 🇲🇹 Malta | $41,740 |
| 18 | 🇮🇹 Italy | $39,580 |
| 19 | 🇨🇾 Cyprus | $37,150 |
| 20 | 🇪🇸 Spain | $34,050 |
| 21 | 🇸🇮 Slovenia | $34,030 |
| 22 | 🇪🇪 Estonia | $31,850 |
| 23 | 🇨🇿 Czech Republic | $29,800 |
| 24 | 🇵🇹 Portugal | $28,970 |
| 25 | 🇱🇹 Lithuania | $28,410 |
| 26 | 🇸🇰 Slovakia | $25,930 |
| 27 | 🇱🇻 Latvia | $24,190 |
| 28 | 🇬🇷 Greece | $23,970 |
| 29 | 🇭🇺 Hungary | $23,320 |
| 30 | 🇵🇱 Poland | $23,010 |
| 31 | 🇭🇷 Croatia | $22,970 |
| 32 | 🇷🇴 Romania | $19,530 |
| 33 | 🇧🇬 Bulgaria | $16,940 |
| 34 | 🇷🇺 Russia | $14,390 |
| 35 | 🇹🇷 Türkiye | $12,760 |
| 36 | 🇲🇪 Montenegro | $12,650 |
| 37 | 🇷🇸 Serbia | $12,380 |
| 38 | 🇦🇱 Albania | $8,920 |
| 39 | 🇧🇦 Bosnia & Herzegovina | $8,420 |
| 40 | 🇲🇰 North Macedonia | $7,690 |
| 41 | 🇧🇾 Belarus | $7,560 |
| 42 | 🇲🇩 Moldova | $7,490 |
| 43 | 🇽🇰 Kosovo | $6,390 |
| 44 | 🇺🇦 Ukraine | $5,660 |
| N/A | 🇪🇺 EU Average | $44,200 |
Note: Figures are rounded.
Three Nordic countries (Norway, Iceland, Denmark) also place highly, between $70,000-90,000. Other Nordic peers, Sweden and Finland rank just outside the top 10, between $55,000-60,000.
Meanwhile, Europe’s biggest economies in absolute terms, Germany, UK, and France, rank closer to the middle of the top 20, with GDP per capitas around $50,000.
Finally, at the end of the scale, Eastern Europe as a whole tends to have much lower per capita GDPs. In that group, Ukraine ranks last, at $5,660.
A Closer Look at Ukraine
For a broader comparison, Ukraine’s per capita GDP is similar to Iran ($5,310), El Salvador ($5,540), and Guatemala ($5,680).
According to experts, Ukraine’s economy has historically underperformed to expectations. After the fall of the Berlin Wall, the economy contracted for five straight years. Its transition to a Western, liberalized economic structure was overshadowed by widespread corruption, a limited taxpool, and few revenue sources.
Politically, its transformation from authoritarian regime to civil democracy has proved difficult, especially when it comes to institution building.
Finally, after the 2022 invasion of the country, Ukraine’s GDP contracted by 30% in a single year—the largest loss since independence. Large scale emigration—to the tune of six million refugees—is also playing a role.
Despite these challenges, the country’s economic growth has somewhat stabilized while fighting continues.

-

 Mining6 days ago
Visualizing Global Gold Production in 2023
-

 AI2 weeks ago
Visualizing AI Patents by Country
-

 Markets2 weeks ago
Economic Growth Forecasts for G7 and BRICS Countries in 2024
-

 Wealth2 weeks ago
Charted: Which City Has the Most Billionaires in 2024?
-

 Technology2 weeks ago
All of the Grants Given by the U.S. CHIPS Act
-

 Green1 week ago
The Carbon Footprint of Major Travel Methods
-

 United States1 week ago
Visualizing the Most Common Pets in the U.S.
-

 Culture1 week ago
The World’s Top Media Franchises by All-Time Revenue