

Table of Contents
- Key Findings
- Overall Mood
- Gubernatorial Election
- State Propositions 26, 27, and 30
- Congressional Elections
- Democracy and the Political Divide
- Approval Ratings
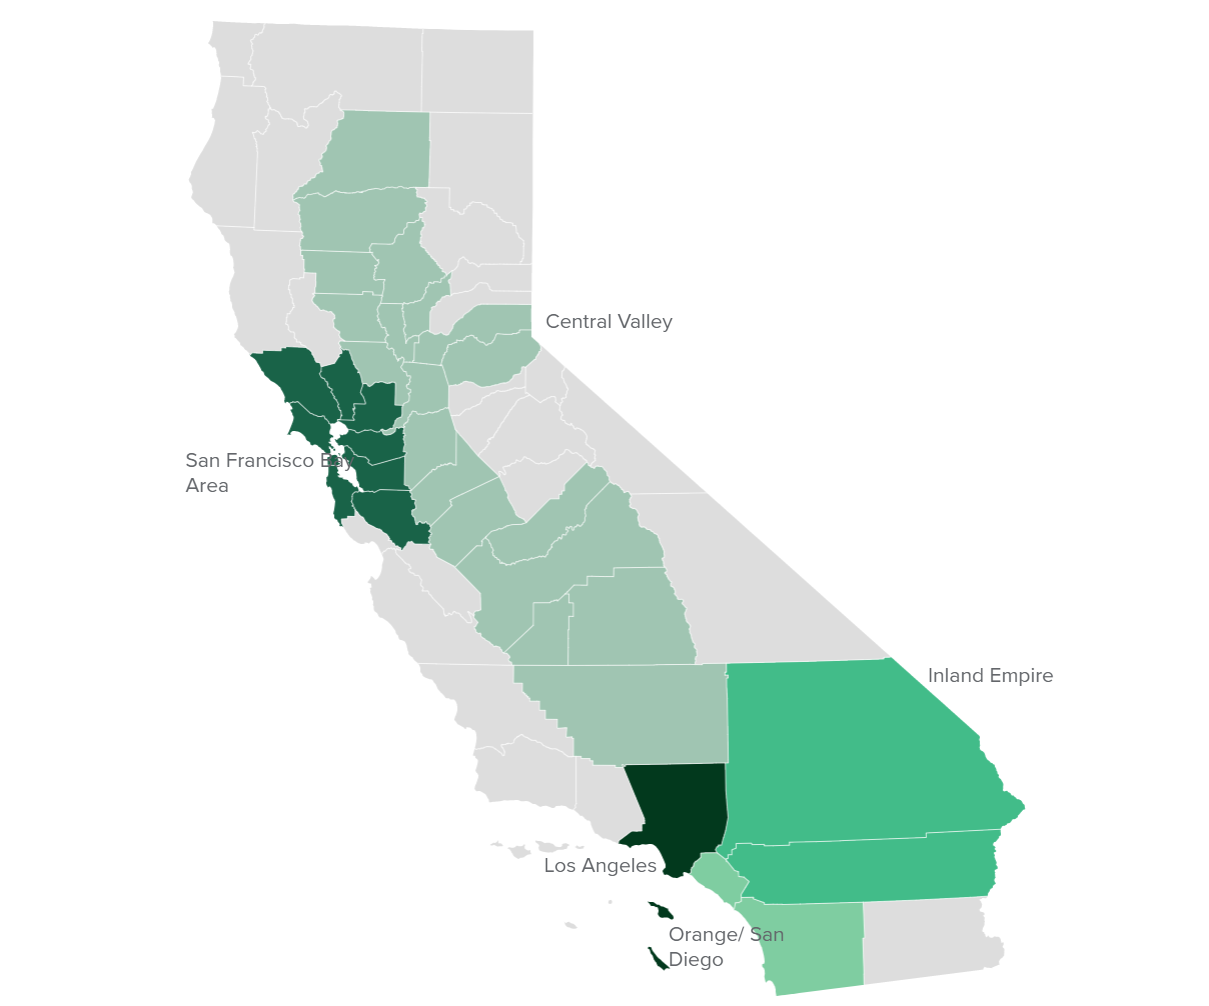
- Regional Map
- Methodology
- Questions and Responses
- Authors and Acknowledgments
- PPIC Statewide Advisory Committee
- PPIC Board of Directors
- Copyright
Key Findings
California voters have now received their mail ballots, and the November 8 general election has entered its final stage. Amid rising prices and economic uncertainty—as well as deep partisan divisions over social and political issues—Californians are processing a great deal of information to help them choose state constitutional officers and state legislators and to make policy decisions about state propositions. The 2022 midterm election also features a closely divided Congress, with the likelihood that a few races in California may determine which party controls the US House.
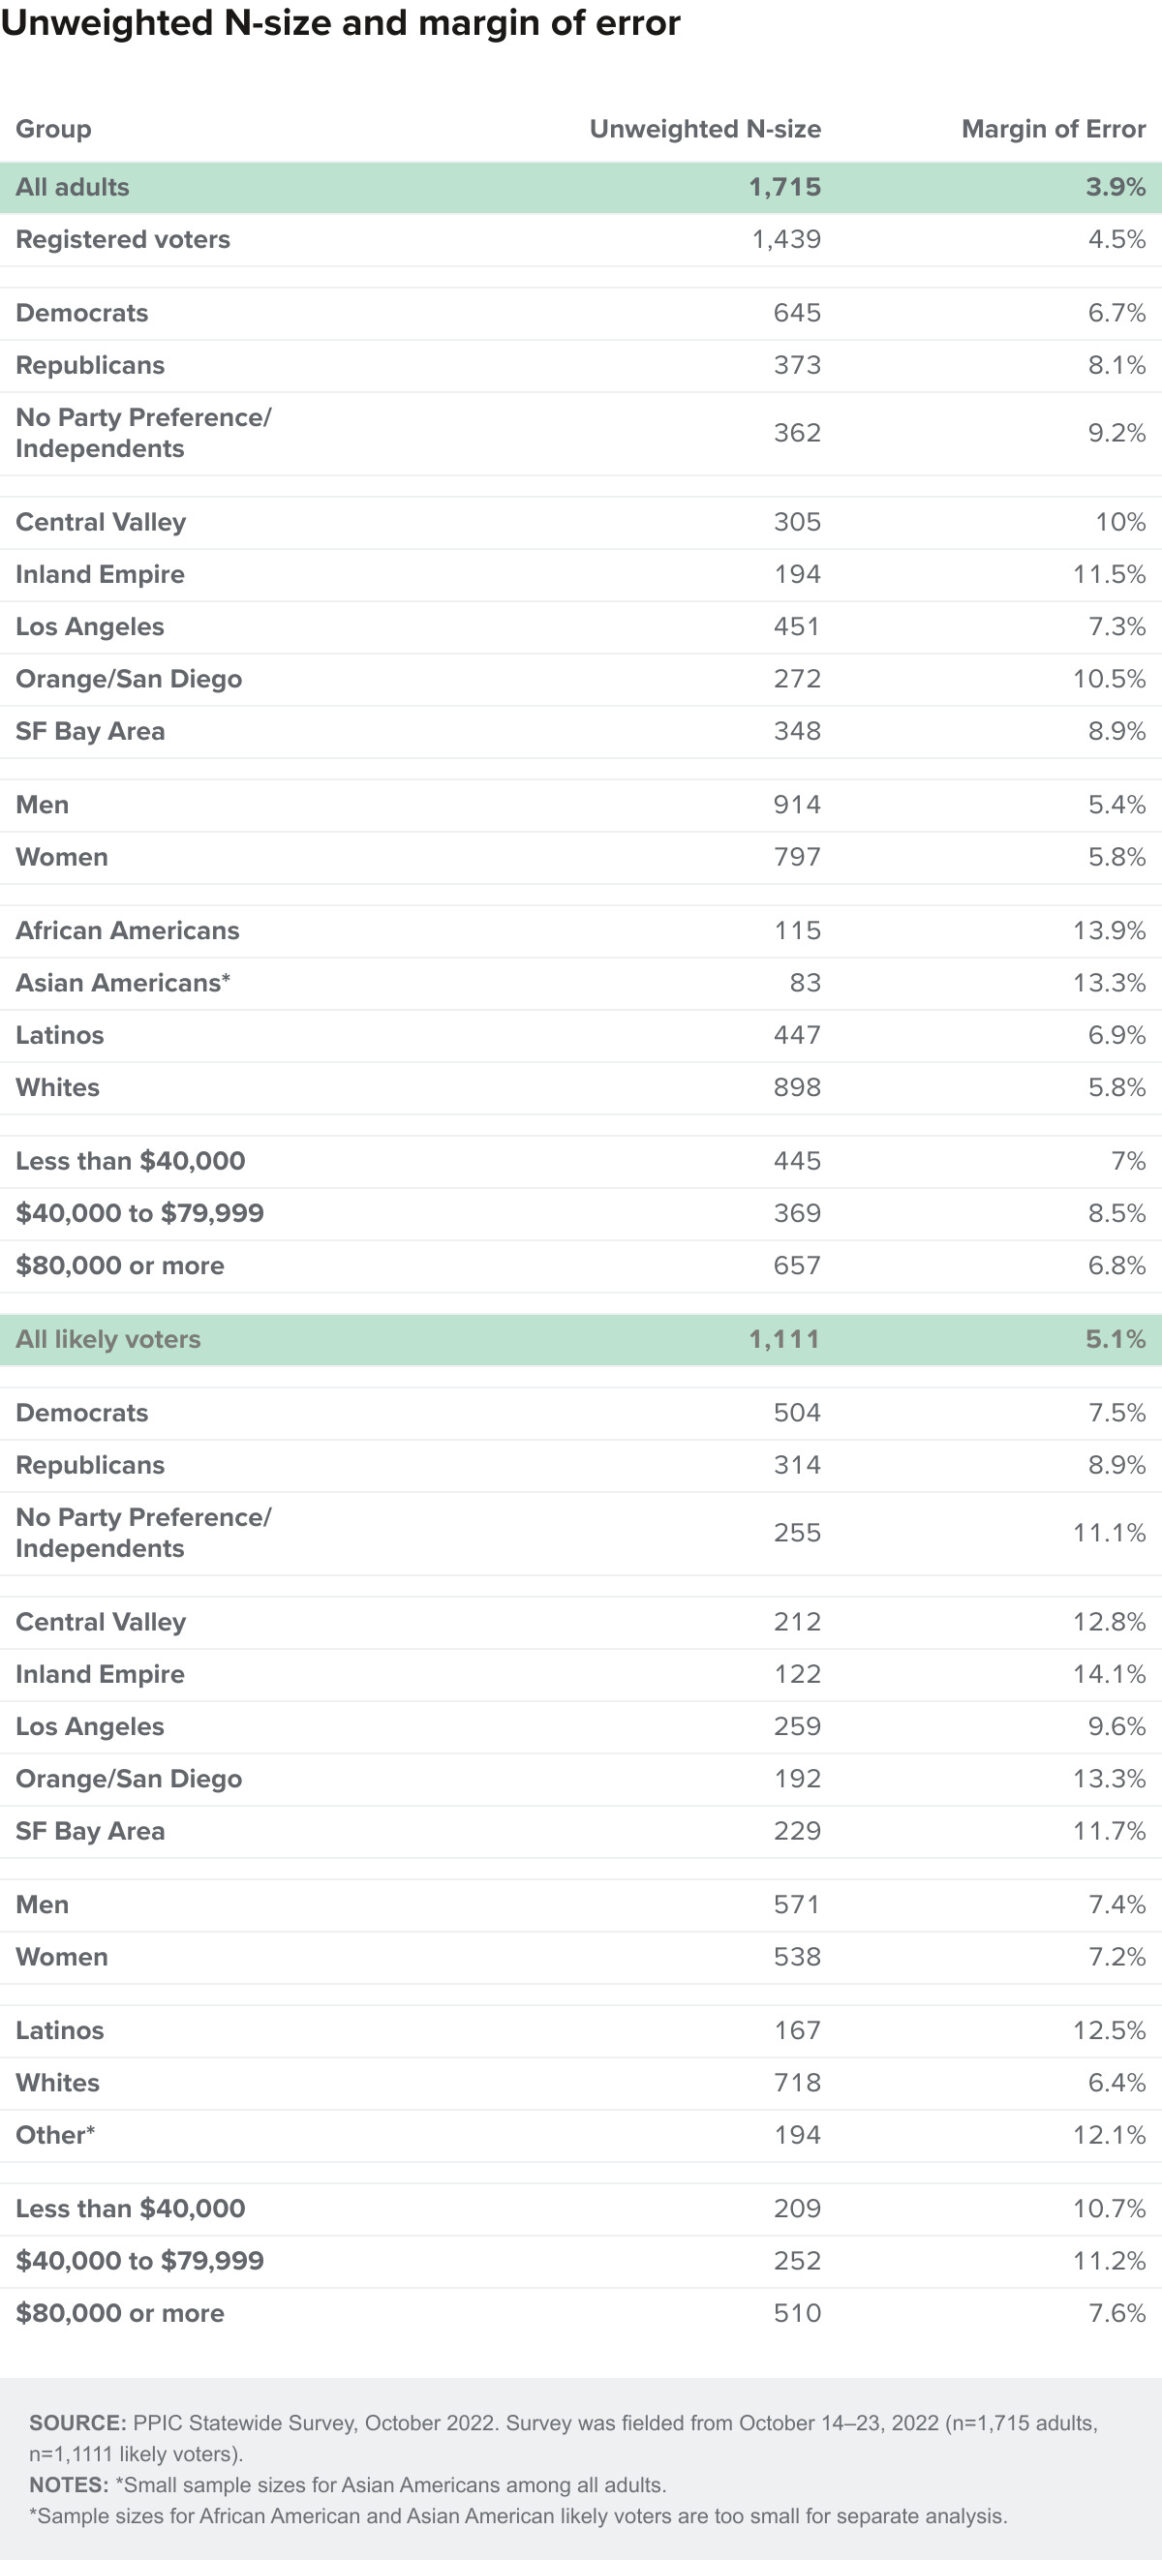
These are among the key findings of a statewide survey on state and national issues conducted from October 14 to 23 by the Public Policy Institute of California:
- Many Californians have negative perceptions of their personal finances and the US economy. Seventy-six percent rate the nation’s economy as “not so good” or “poor.” Thirty-nine percent say their finances are “worse off” today than a year ago. Forty-seven percent say that things in California are going in the right direction, while 33 percent think things in the US are going in the right direction; partisans differ in their overall outlook.→
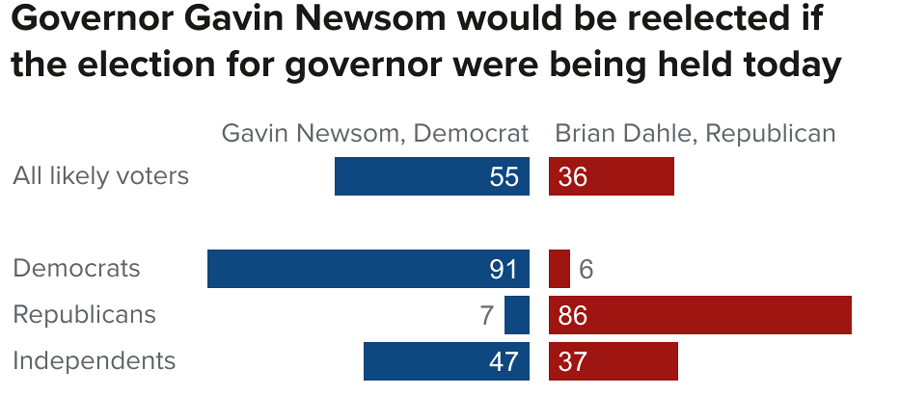 Among likely voters, 55 percent would vote for Gavin Newsom and 36 percent would vote for Brian Dahle if the governor’s election were today. Partisans are deeply divided in their choices. Sixty percent are very or fairly closely following news about the governor’s race. Sixty-two percent are satisfied with the candidate choices in the governor’s election.→
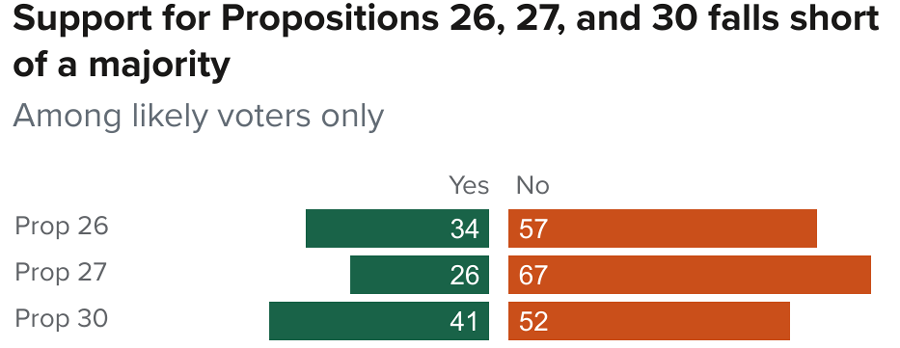 When likely voters are read the ballot title and labels, 34 percent would vote yes on Proposition 26 (sports betting at tribal casinos), 26 percent would vote yes on Proposition 27 (online sports gambling), and 41 percent would vote yes on Proposition 30 (reducing greenhouse gases). Most likely voters say they are not personally interested in sports betting, and 48 percent think it would be a “bad thing” if it became legal in the state. Fewer than half of likely voters say the vote outcome of Propositions 26, 27, or 30 is very important to them.→
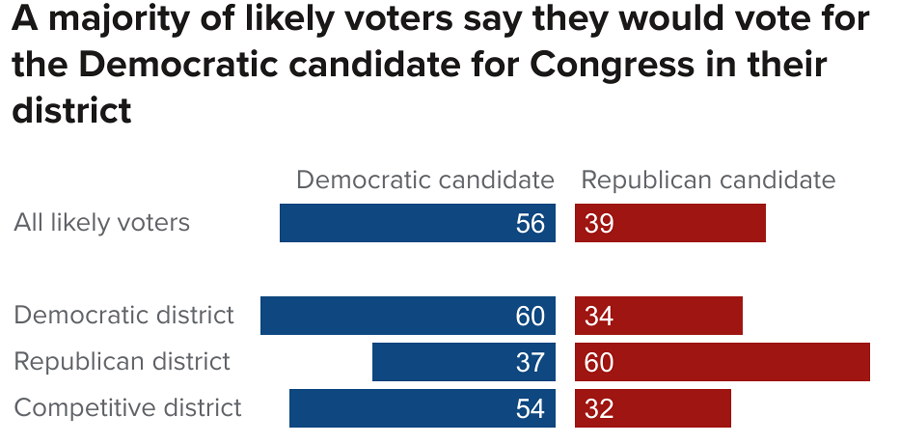 Fifty-six percent of likely voters would support the Democratic candidate in their US House race if the election were today. Sixty-one percent say the issue of abortion rights is very important in their vote for Congress this year; Democrats are far more likely than Republicans or independents to hold this view. About half are “extremely” or “very” enthusiastic about voting for Congress this year; 54 percent of Republicans and Democrats, and 41 percent of independents, are highly enthusiastic this year.→
- Forty-five percent of Californians and 40 percent of likely voters are satisfied with the way that democracy is working in the United States. Republicans are far less likely than Democrats and independents to hold this positive view. There is rare partisan consensus on one topic: majorities of Democrats, Republicans, and independents are pessimistic that Americans with different political views can still come together and work out their differences.→
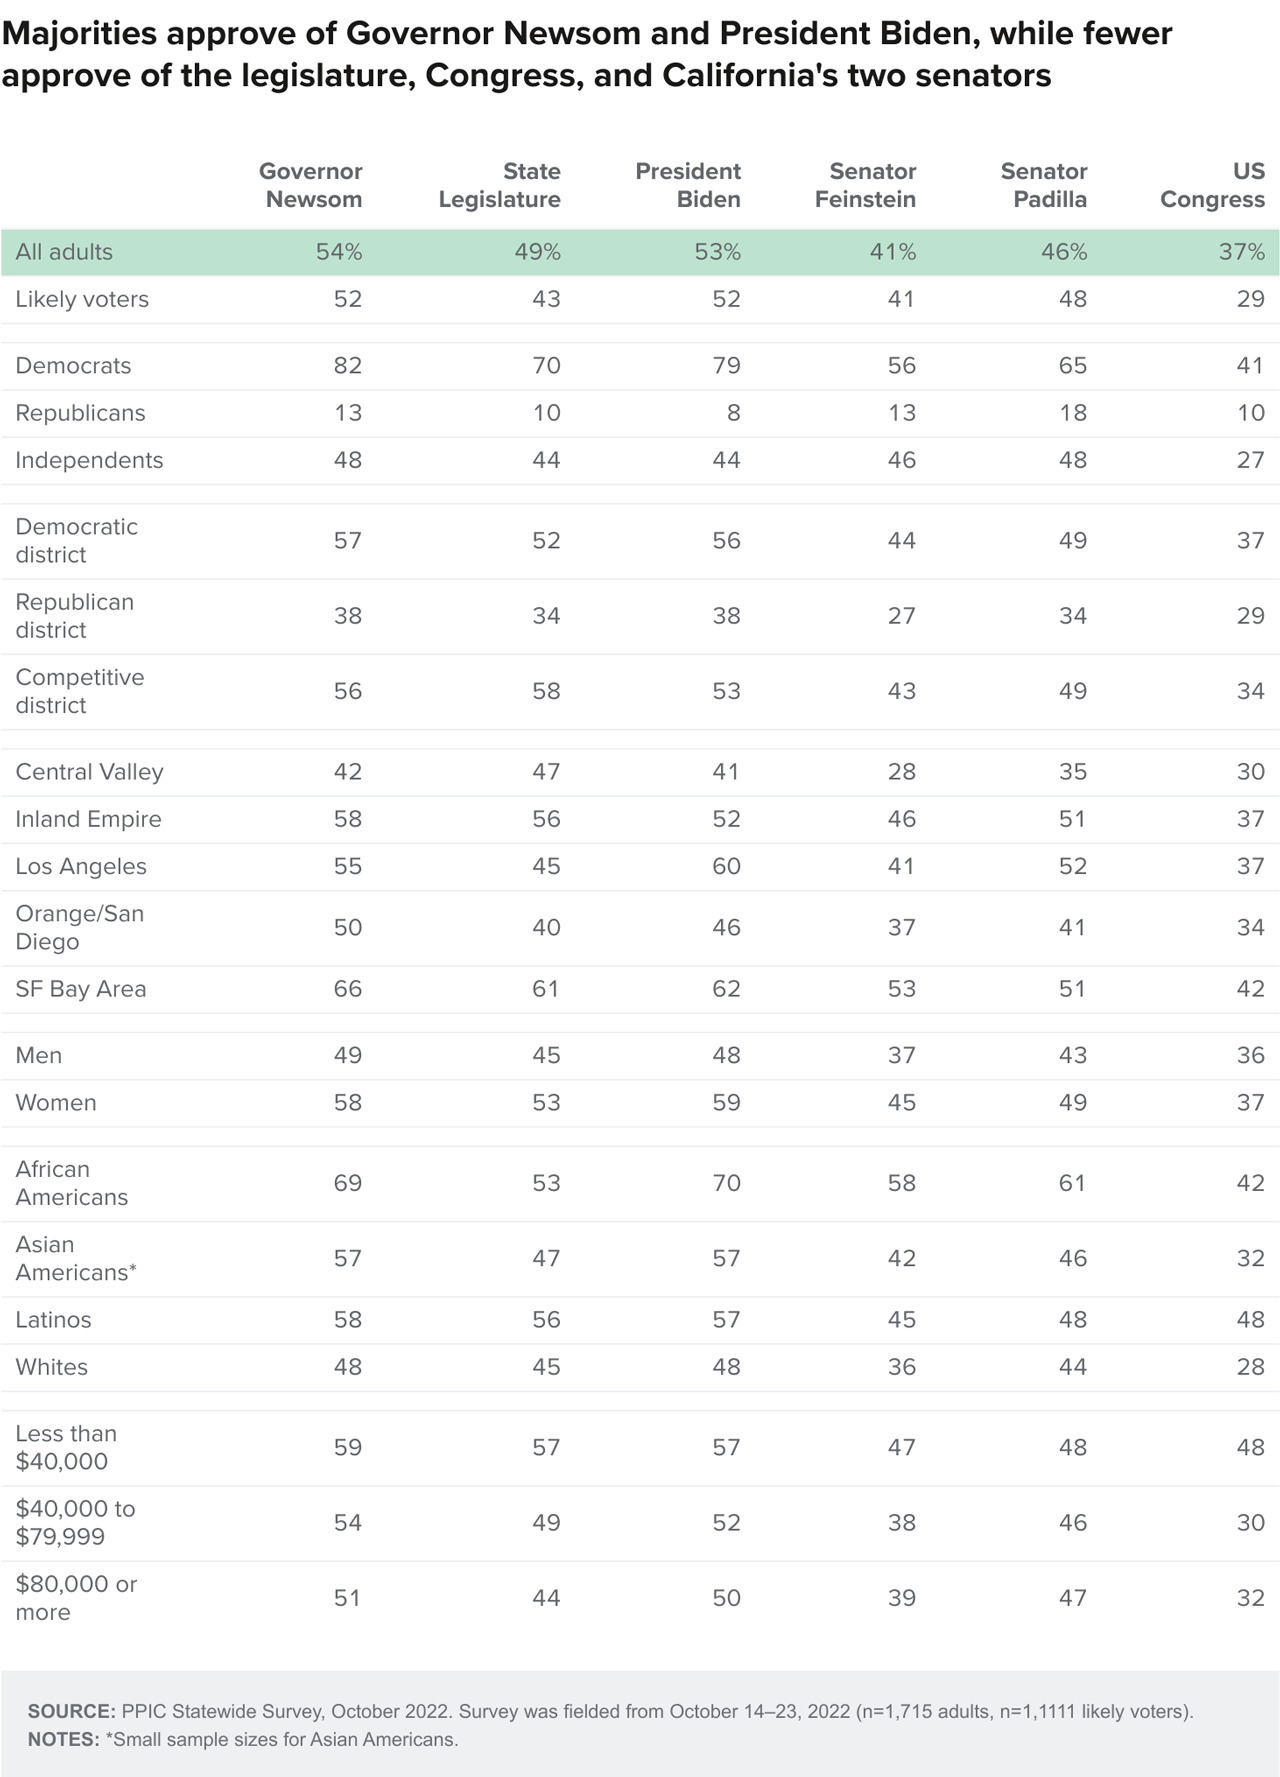
- Majorities of California adults and likely voters approve of Governor Gavin Newsom and President Joe Biden. About four in ten or more California adults and likely voters approve of US Senator Dianne Feinstein and US Senator Alex Padilla. These approval ratings vary across partisan groups. Approval of the state legislature is higher than approval of the US Congress.→
Overall Mood
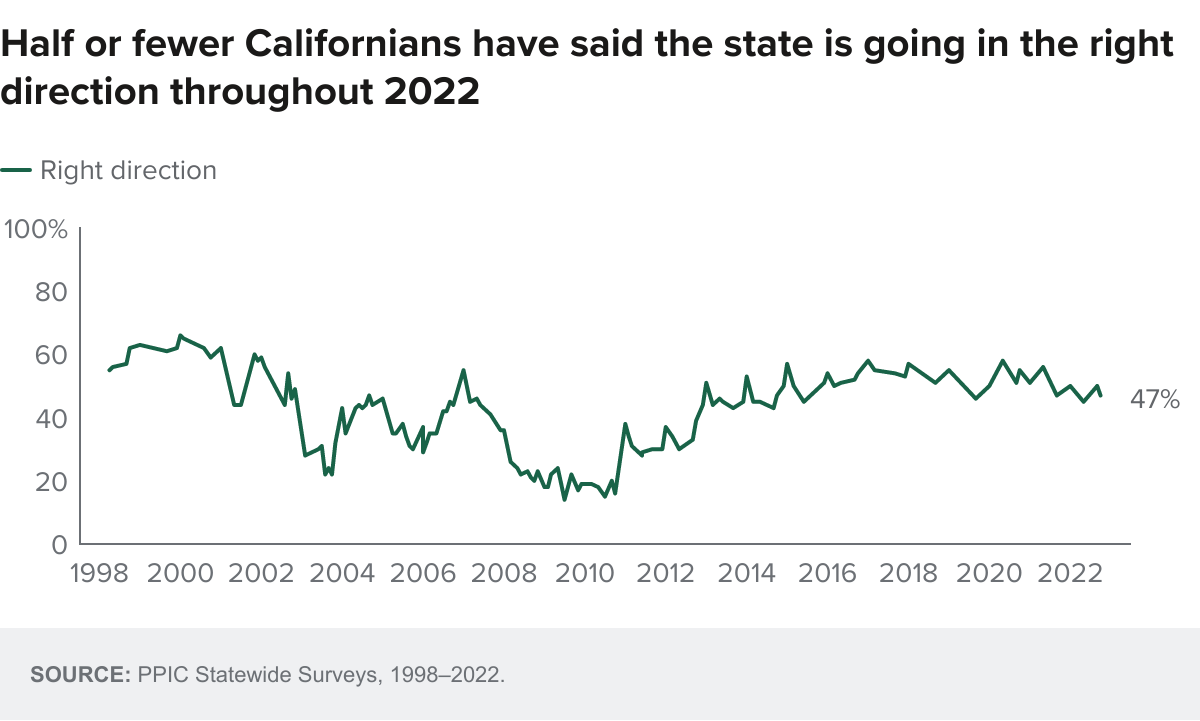
With less than two weeks to go until what is set to be a highly consequential midterm election, California adults are divided on whether the state is generally headed in the right direction (47%) or wrong direction (48%); a majority of likely voters (54%) think the state is headed in the wrong direction (43% right direction). Similar shares held this view last month (wrong direction: 44% adults, 49% likely voters; right direction: 50% adults, 48% likely voters). Today, there is a wide partisan divide: seven in ten Democrats are optimistic about the direction of the state, while 91 percent of Republicans and 59 percent of independents are pessimistic. Majorities of residents in the Central Valley and Orange/San Diego say the state is going in the wrong direction, while a majority in the San Francisco Bay Area say right direction; adults elsewhere are divided. Across demographic groups, Californians ages 18 to 34 (60%), Asian Americans (52%), college graduates (52%), renters (52%), and women (52%) are the only groups in which a majority are optimistic about California’s direction.
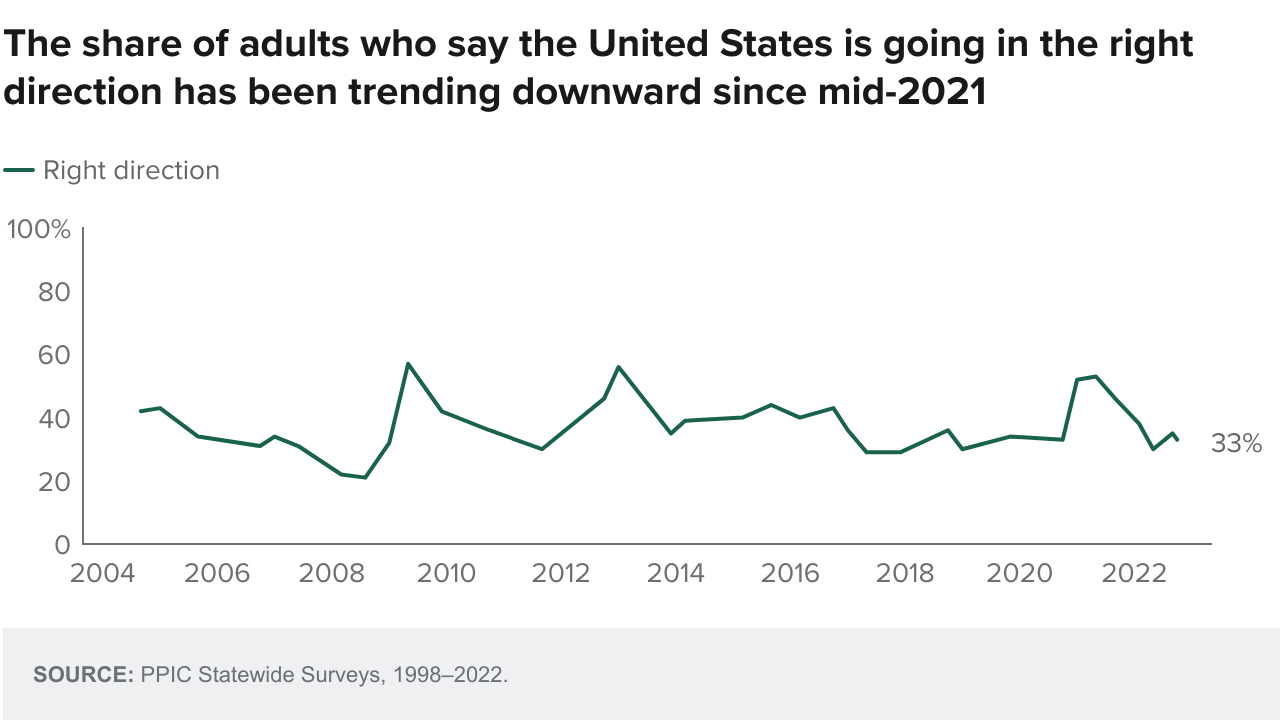
Californians are much more pessimistic about the direction of the country than they are about the direction of the state. Solid majorities of adults (62%) and likely voters (71%) say the United States is going in the wrong direction, and majorities have held this view since September 2021. One in three or fewer adults (33%) and likely voters (25%) think the country is going in the right direction. Majorities across all demographic groups and partisan groups, as well as across regions, are pessimistic about the direction of the United States.
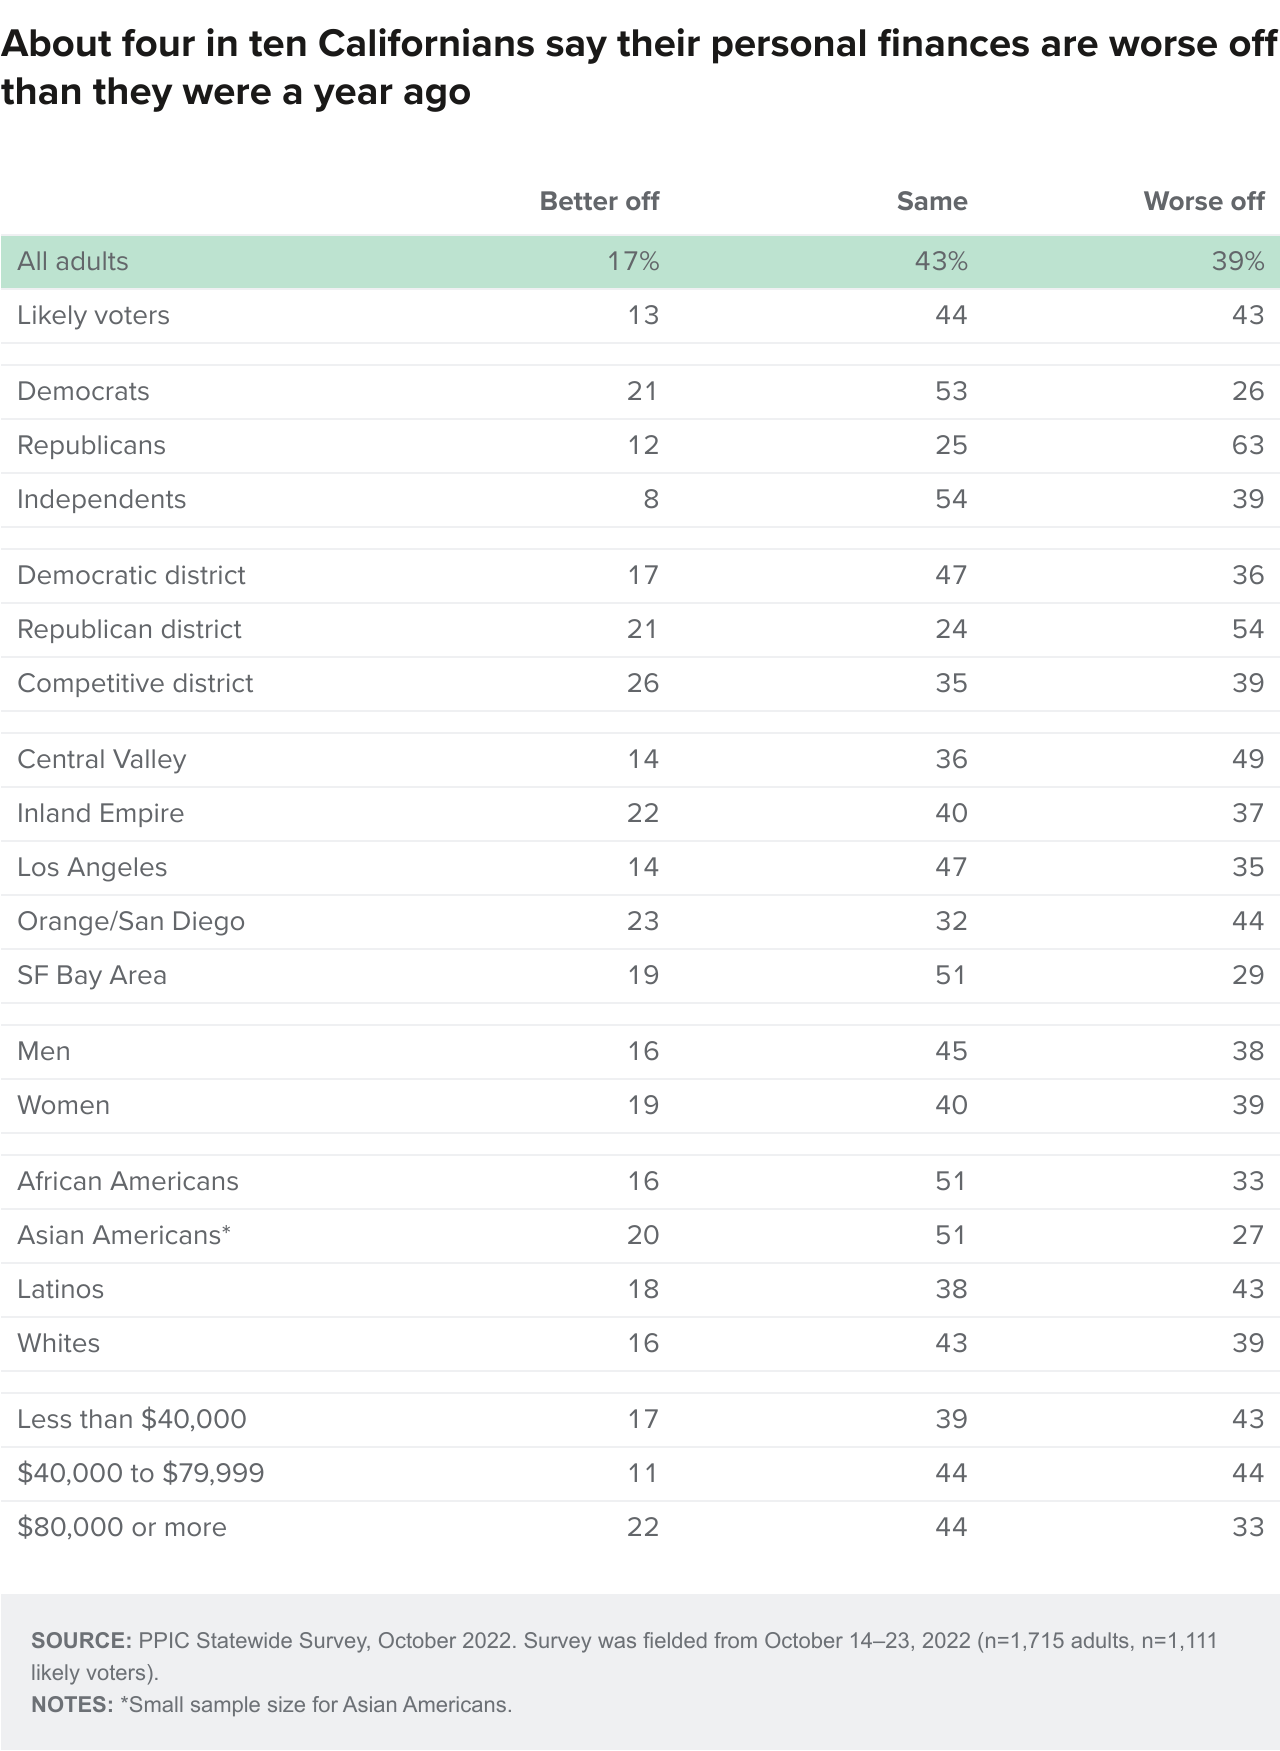
The state of the economy and inflation are likely to play a critical role in the upcoming election, and about four in ten adults (39%) and likely voters (43%) say they and their family are worse off financially than they were a year ago. Similar shares say they are financially in about the same spot (43% adults, 44% likely voters). The share who feel they are worse off has risen slightly among likely voters since May, but is similar among adults (37% adults, 36% likely voters). Fewer than two in ten Californians say they are better off than they were one year ago (17% adults, 13% likely voters). A wide partisan divide exists: most Democrats and independents say their financial situation is about the same as a year ago, while solid majorities of Republicans say they are worse off. Regionally, about half in the San Francisco Bay Area and Los Angeles say they are about the same, while half in the Central Valley say they are worse off; residents elsewhere are divided between being worse off and the same. Across demographic groups, pluralities say they are either financially about the same as last year or worse off, with the exception of African Americans (51% about the same, 33% worse off, 16% better off) and Asian Americans (51% about the same, 27% worse off, 20% better off). The shares saying they are worse off decline as educational attainment increases.
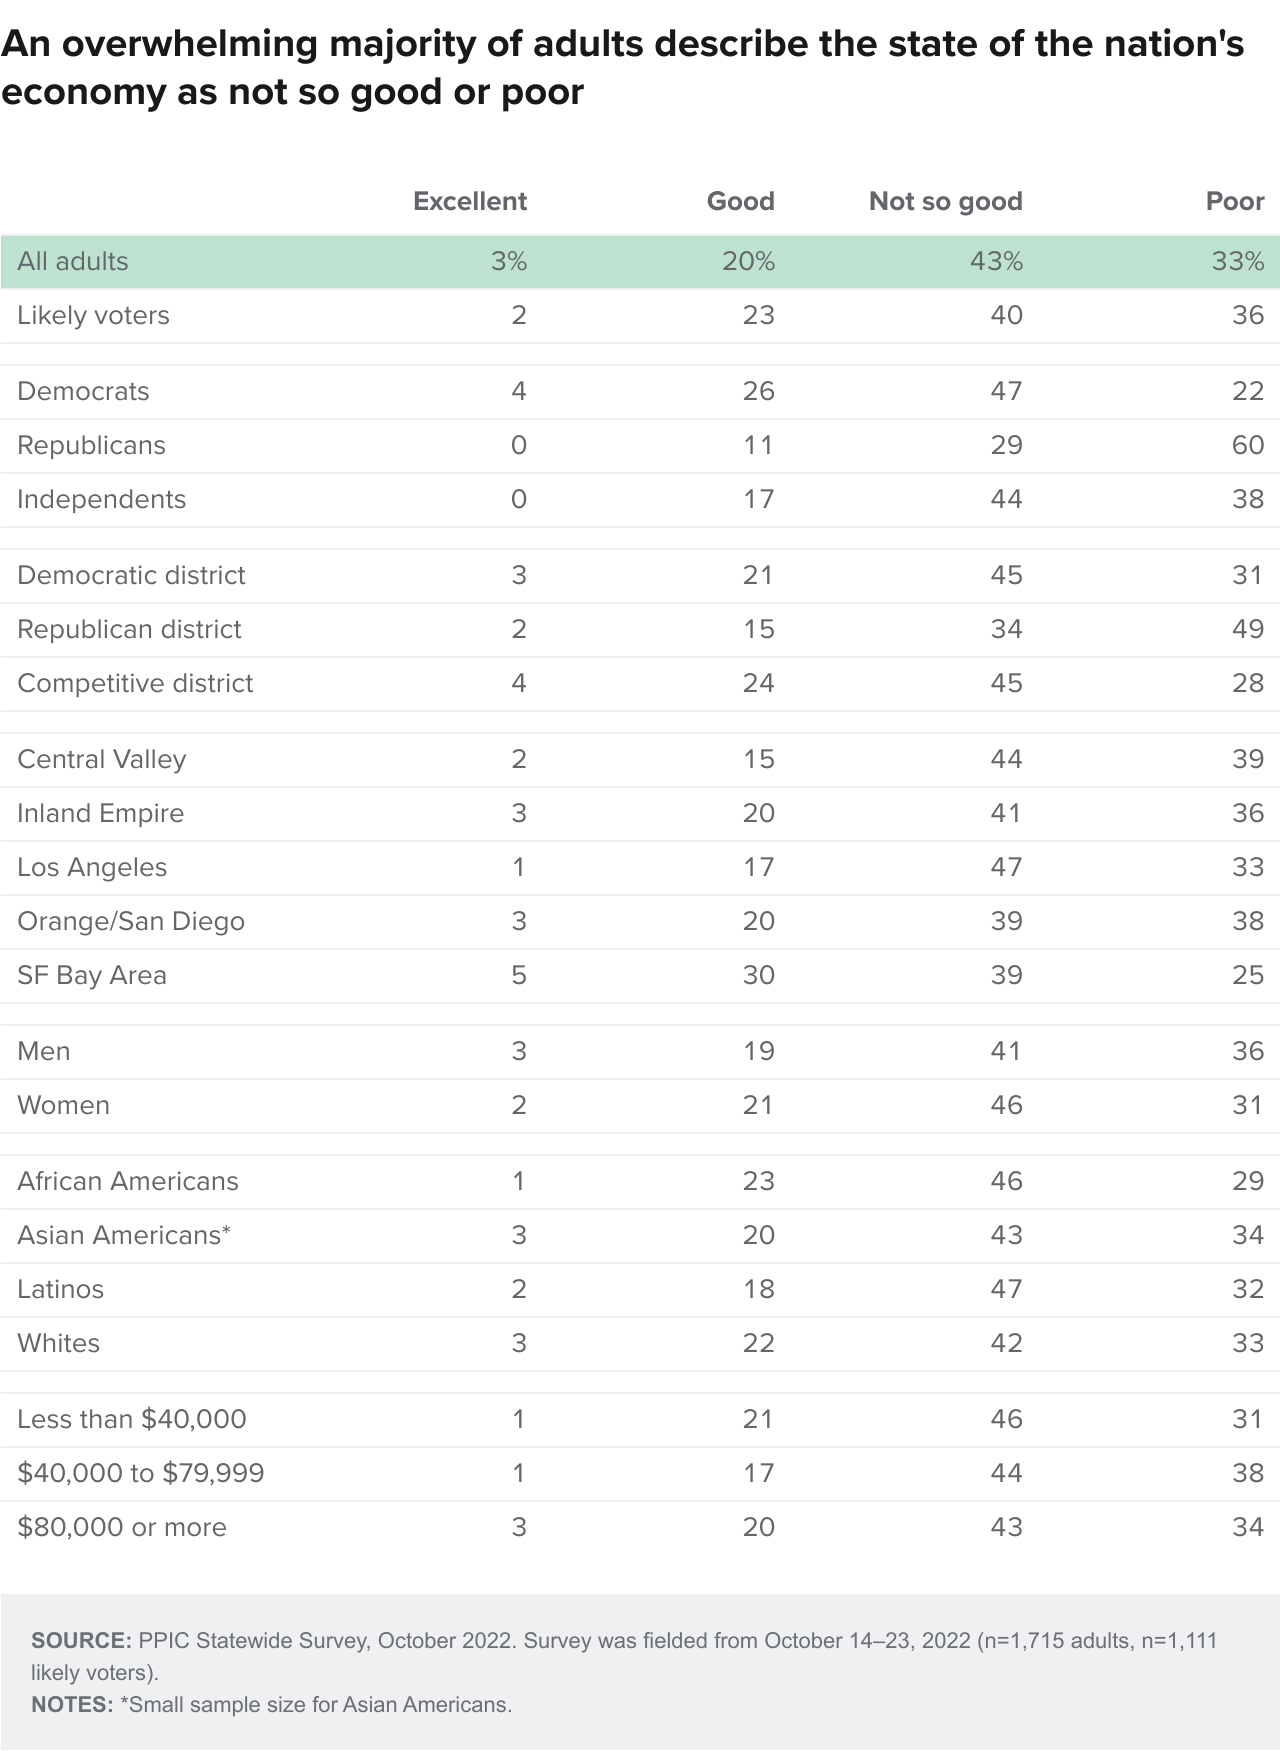
With persistent inflation and concerns about a possible recession in the future, an overwhelming majority of Californians believe the US economy is in not so good (43% adults, 40% likely voters) or poor (33% adults, 36% likely voters) shape. About a quarter of adults (3% excellent, 20% good) and likely voters (2% excellent, 23% good) feel positively about the national economy. Strong majorities across partisan groups feel negatively, but Republicans and independents are much more likely than Democrats to say the economy is in poor shape. Solid majorities across the state’s major regions as well as all demographic groups say the economy is in not so good or poor shape. In a recent ABC News/Washington Post poll, 24 percent (3% excellent, 21% good) of adults nationwide felt positively about the US economy, while 74 percent (36% not so good, 38% poor) expressed negative views.
Gubernatorial Election
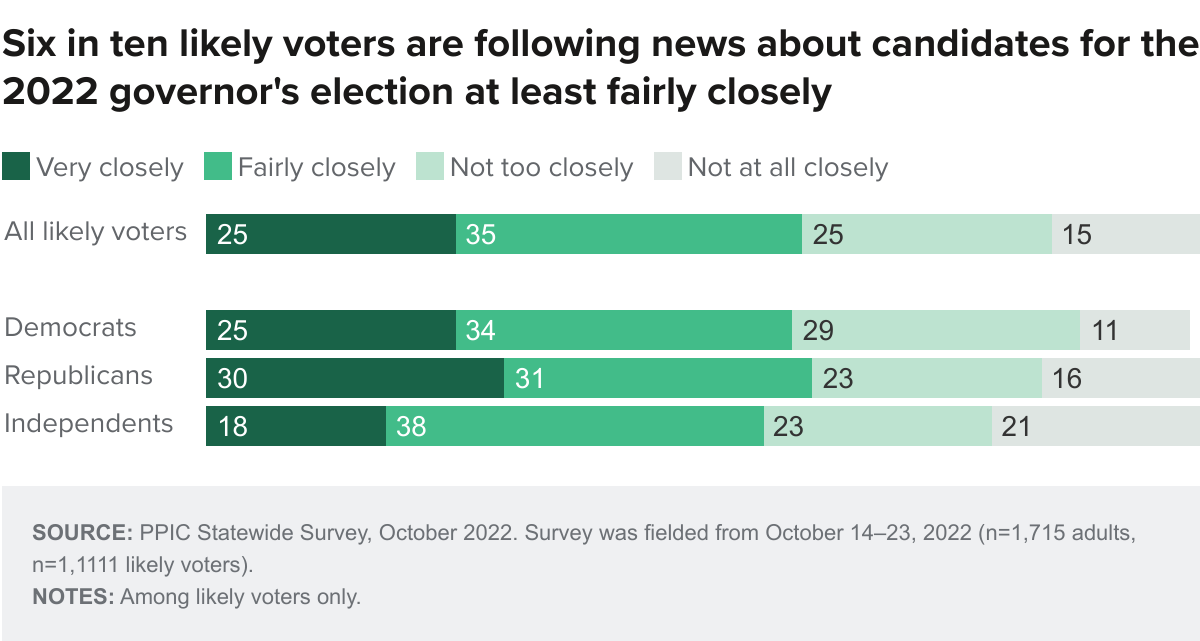
Six in ten likely voters say they are following news about the 2022 governor’s race very (25%) or fairly (35%) closely—a share that has risen from half just a month ago (17% very, 33% fairly). This finding is somewhat similar to October 2018, when 68 percent said this (28% very, 40% closely) a month before the previous gubernatorial election. Today, majorities across partisan, demographic, and regional groups say they are following news about the gubernatorial election either very or fairly closely. The shares saying they are following the news very closely is highest among residents in Republican districts (39%), Republicans (30%), whites (29%), and adults with incomes of $40,000 to $79,999 (29%). Older likely voters (27%) are slightly more likely than younger likely voters (21%) to say they are following the news closely.
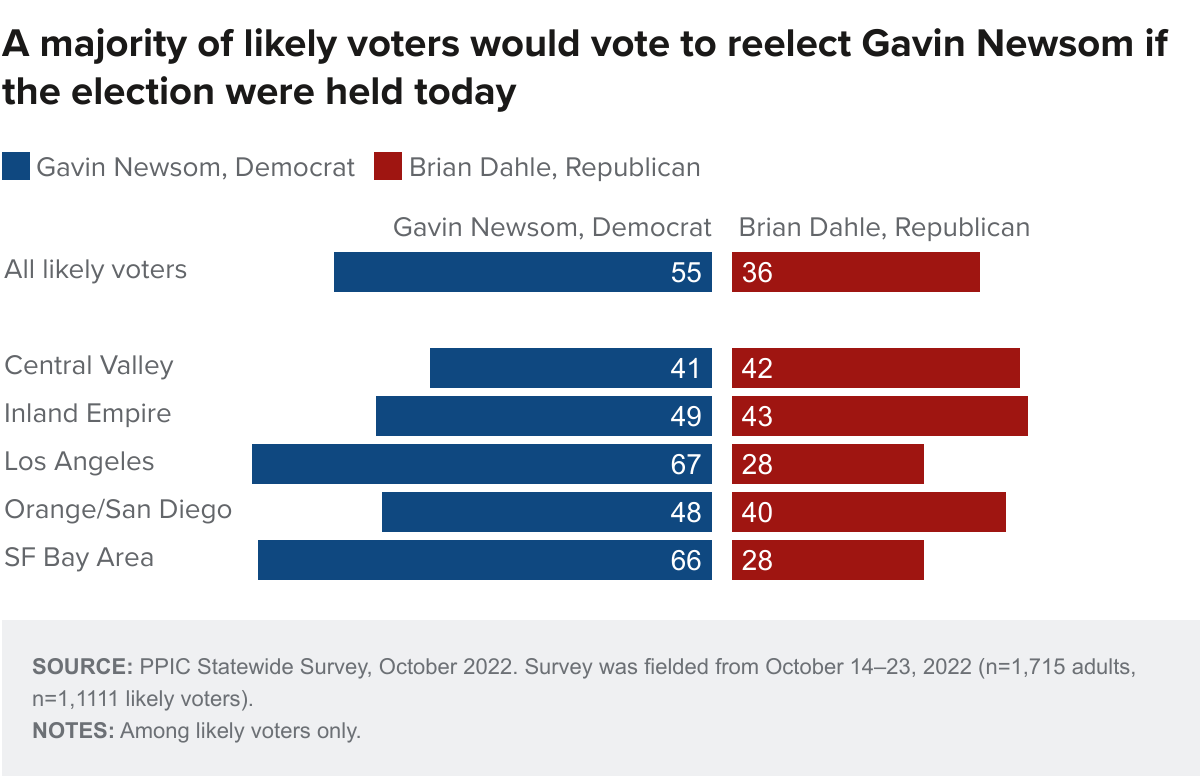
Democratic incumbent Gavin Newsom is ahead of Republican Brian Dahle (55% to 36%) among likely voters, while few say they would not vote, would vote for neither, or don’t know who they would vote for in the governor’s race. The share supporting the reelection of the governor was similar a month ago (58% Newsom, 31% Dahle). Today, Newsom enjoys the support of most Democrats (91%), while most Republicans (86%) support Dahle; Newsom has an edge over Dahle among independent likely voters (47% Newsom, 37% Dahle). Across the state’s regions, two in three in the San Francisco Bay Area and Los Angeles support Newsom, as do nearly half in the Inland Empire and Orange/San Diego; likely voters in the Central Valley are split. Newsom leads in all demographic groups, with the exception of men (45% Newsom, 44% Dahle) and those with a high school diploma only (46% Newsom, 49% Dahle). The share supporting Newsom grows as educational attainment increases (46% high school only, 56% some college, 60% college graduates), while it decreases with rising income (64% less than $40,000, 56% $40,000 to $79,999, 52% $80,000 or more).
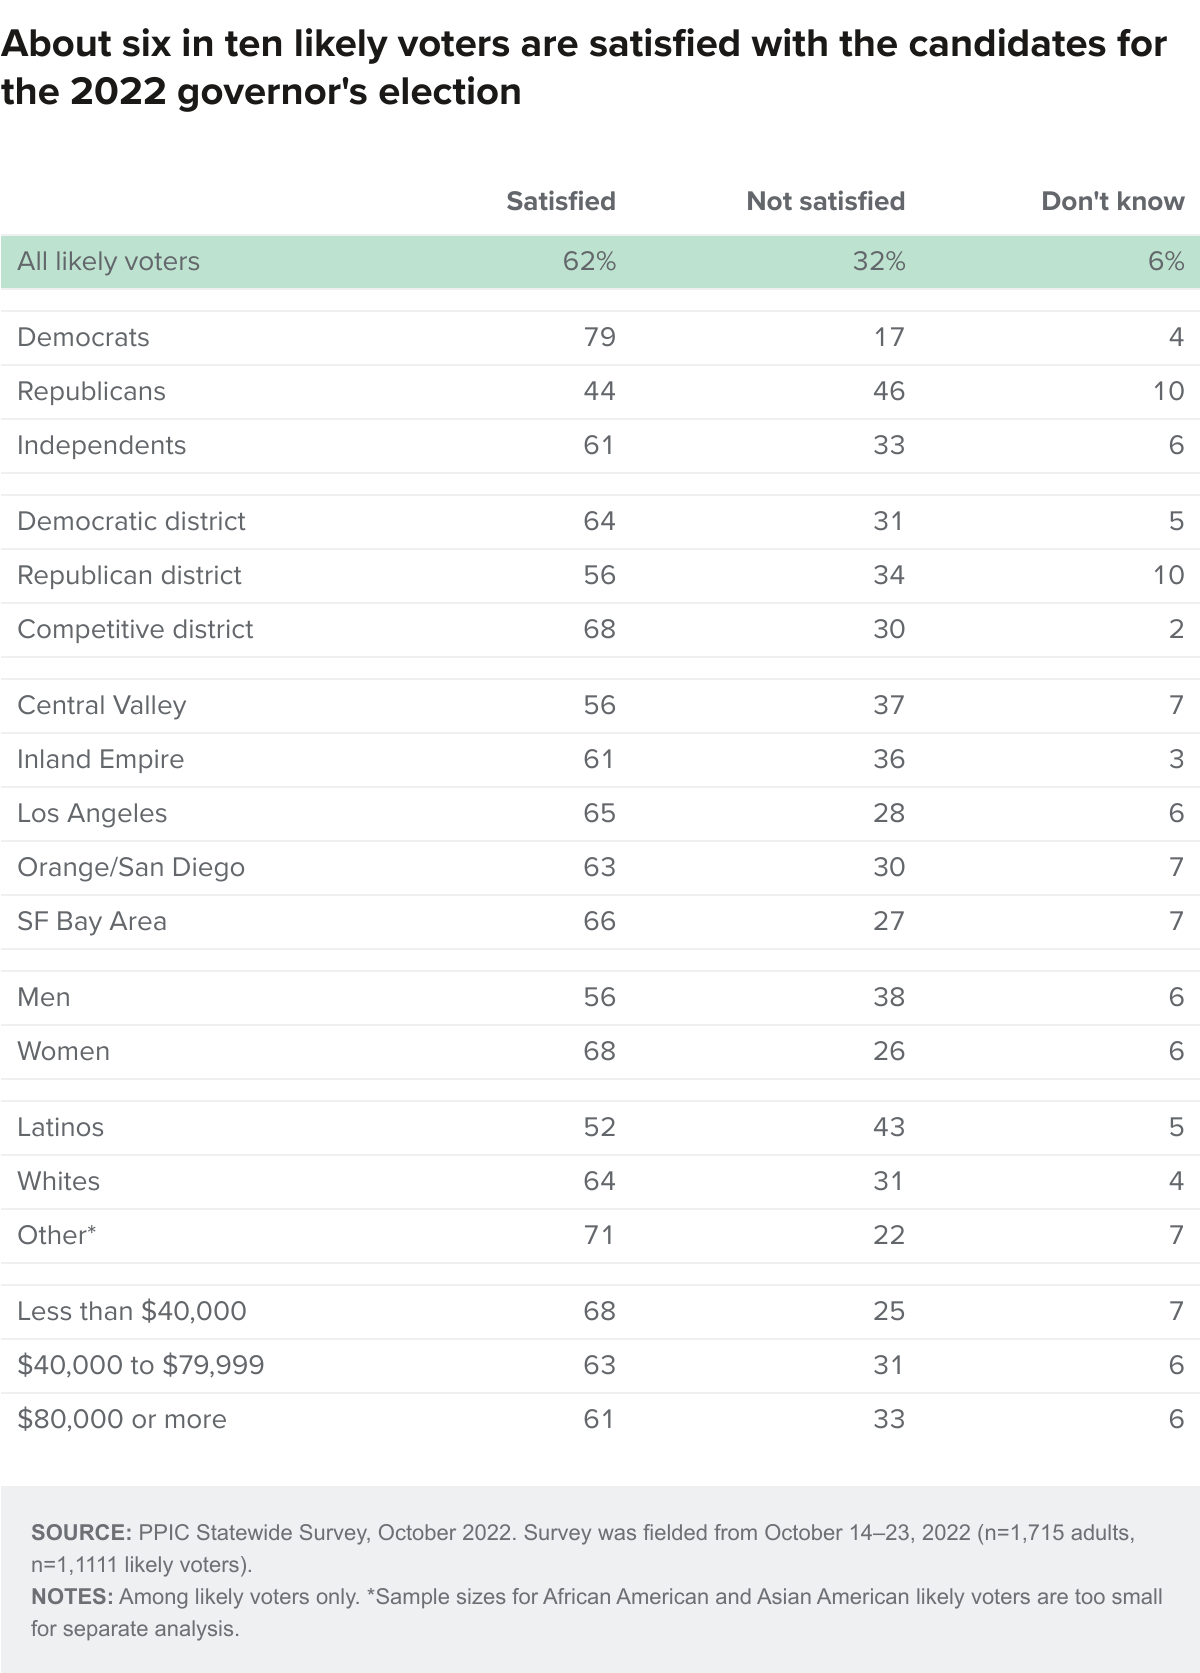
A solid majority of likely voters (62%) are satisfied with their choices of candidates in the November 8 election, while about three in ten (32%) are not satisfied. Shares expressing satisfaction have increased somewhat from a month ago (53%) and were similar prior to the 2018 gubernatorial election (60% October 2018). Today, a solid majority of Democrats (79%) and independents (61%) say they are satisfied, compared to fewer than half of Republicans (44%). Majorities across demographic groups say they are satisfied, and notably, women (68%) are more likely than men (56%) to say this. Majorities across the state’s regions say they are satisfied with their choices of candidates in the upcoming gubernatorial election.
State Propositions 26, 27, and 30
In the upcoming November 8 election, there will be seven state propositions for voters. Due to time constraints, our survey only asked about three ballot measures: Propositions 26, 27, and 30. For each, we read the proposition number, ballot, and ballot label. Two of the state ballot measures were also included in the September survey (Propositions 27 and 30), while Proposition 26 was not.
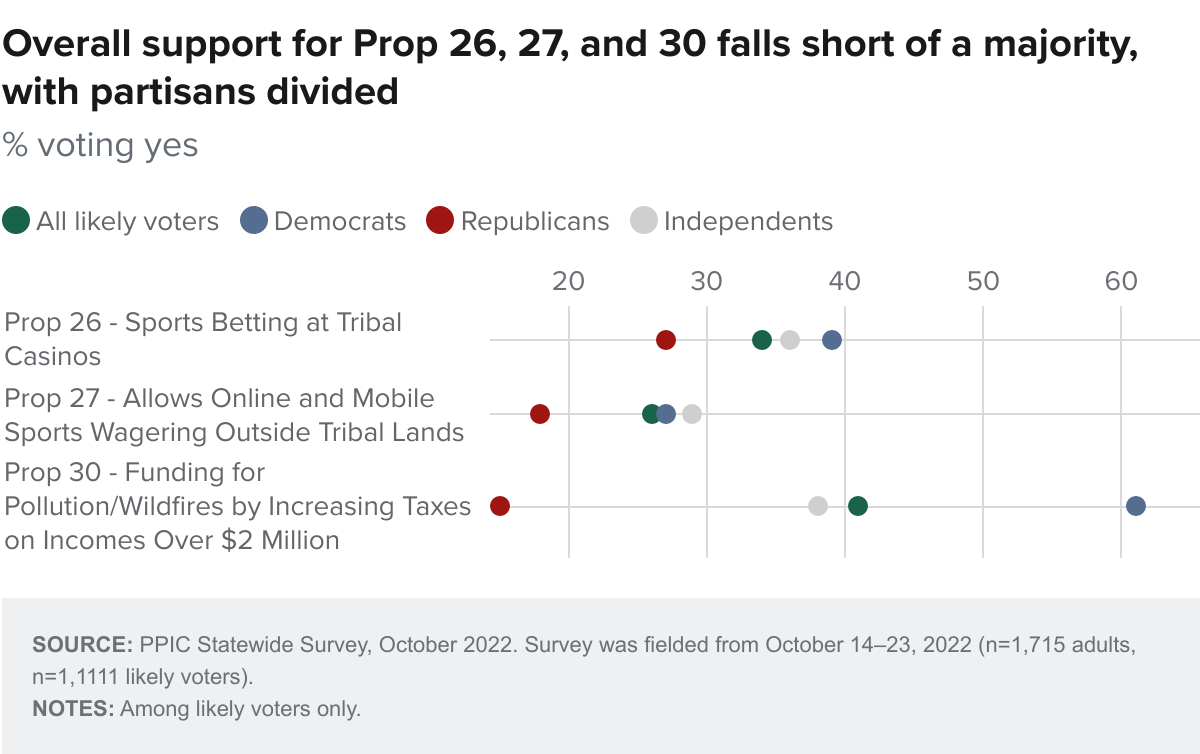
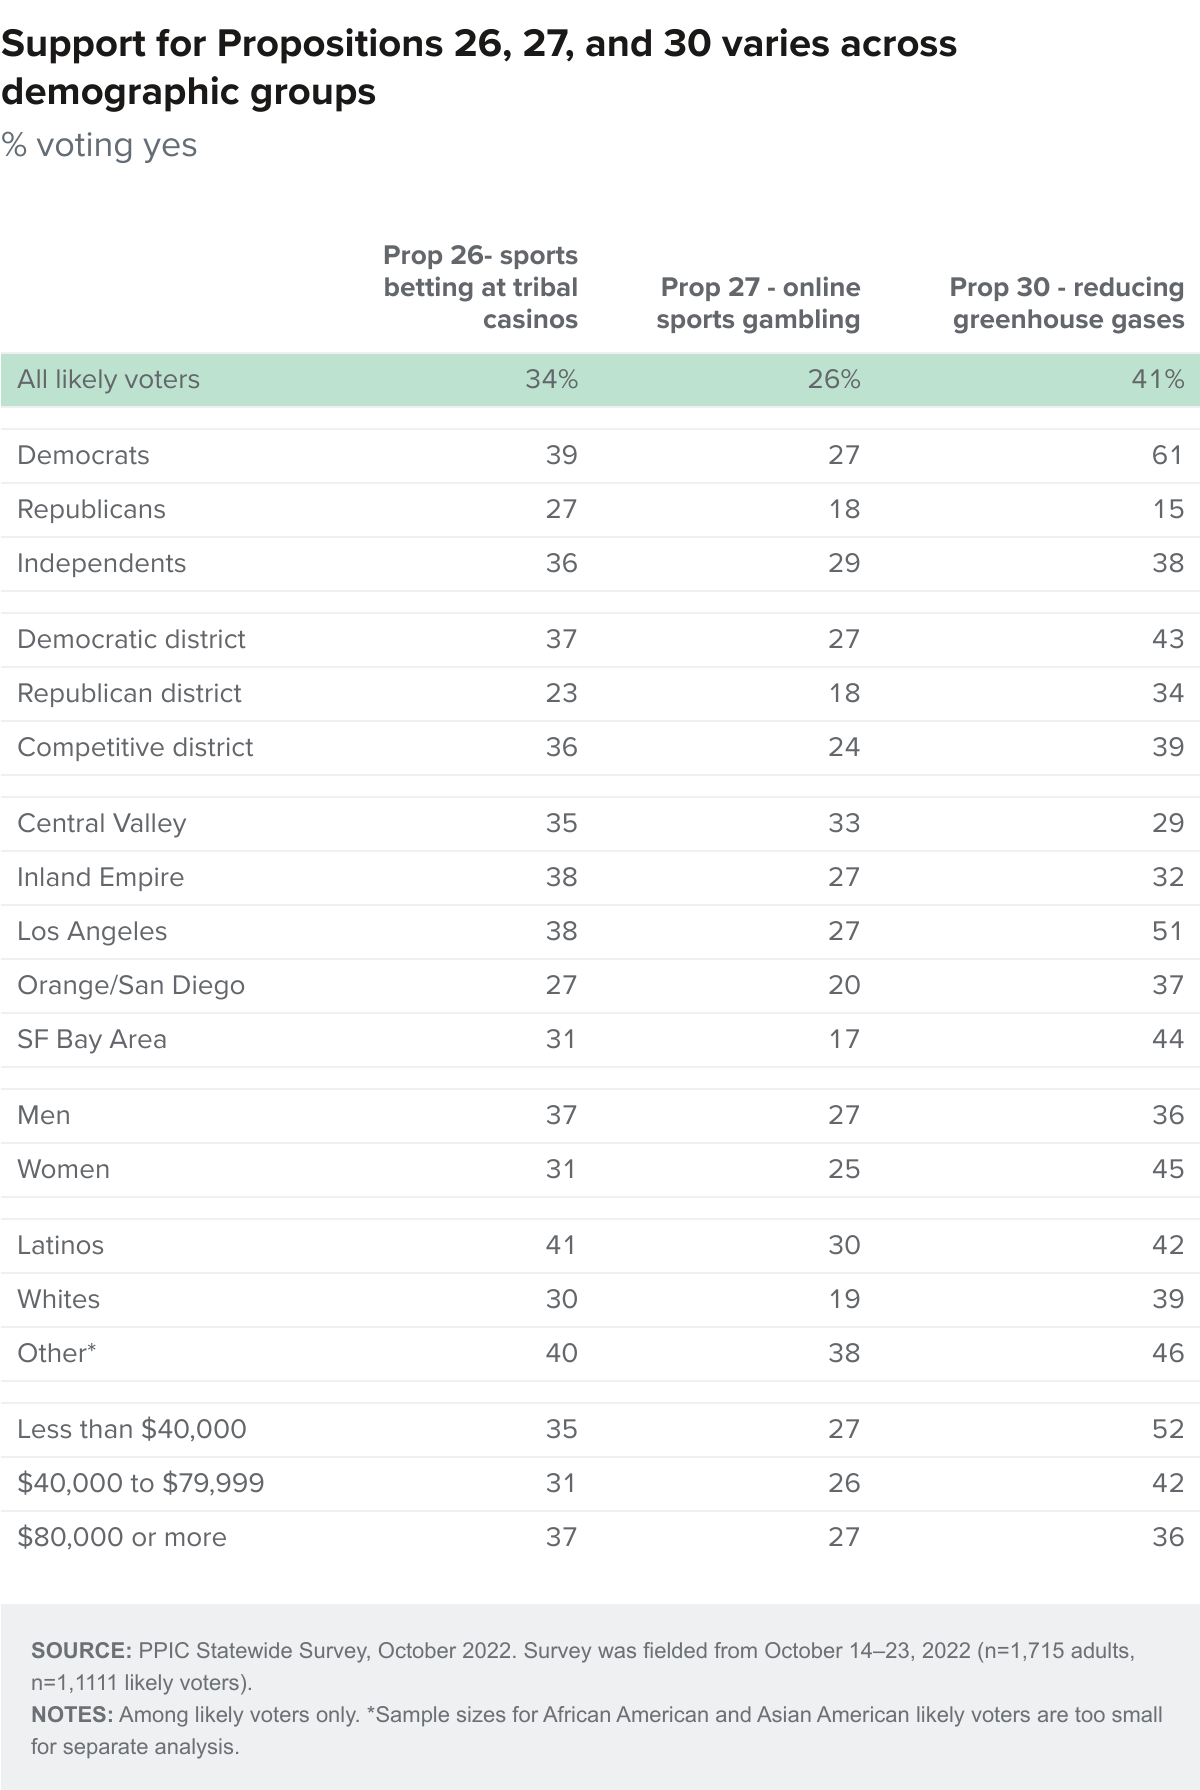
If the election were held today, 34 percent of likely voters would vote “yes,” 57 percent would vote “no,” and 9 percent are unsure of how they would vote on Proposition 26—Allows In-Person Roulette, Dice, Game, Sports Wagering on Tribal Lands. This measure would allow in-person sports betting at racetracks and tribal casinos, requiring that racetracks and casinos offering sports betting make certain payments to the state to support state regulatory costs. It also allows roulette and dice games at tribal casinos and adds a new way to enforce certain state gambling laws. There is partisan agreement on Prop 26: fewer than four in ten Democrats, Republicans, and independents would vote “yes.” Moreover, less than a majority across all regions and demographic groups—with the exception of likely voters ages 18 to 44 (51% yes, 44% no)—would vote “yes.”
If the election were held today, 26 percent of likely voters would vote “yes,” 67 percent would vote “no,” and 8 percent are unsure of how they would vote on Proposition 27—Allows Online and Mobile Sports Wagering Outside Tribal Lands. This citizens’ initiative would allow Indian tribes and affiliated businesses to operate online and mobile sports wagering outside tribal lands. Strong majorities across partisan groups would vote “no” on Prop 27. The share voting “yes” has decreased since a month ago (34% September). Today, fewer than three in ten across partisan groups would vote “yes” on Prop 27. Moreover, fewer than four in ten across regions, gender, racial/ethnic, education, and income groups would vote “yes.” Likely voters ages 18 to 44 (41%) are far more likely than older likely voters ages 45 and above (19%) to say they would vote “yes.”
If the election were held today, 41 percent of likely voters would vote “yes,” 52 percent would vote “no,” and 7 percent are unsure of how they would vote on Proposition 30—Provides Funding for Programs to Reduce Air Pollution and Prevent Wildfires by Increasing Tax on Personal Income over $2 Million. This citizens’ initiative would increase taxes on Californians earning more than $2 million annually and allocate that tax revenue to zero-emission vehicle purchase incentives, vehicle charging stations, and wildfire prevention. The share saying “yes” on Prop 30 has decreased from 55 percent in our September survey (note: since September, Governor Newsom has been featured in “no on Prop 30” commercials). Today, unlike Prop 26 and Prop 27, partisan opinions are divided on Prop 30: 61 percent of Democrats would vote “yes,” compared to far fewer Republicans (15%) and independents (38%). Across regions, and among men and women, support falls short of a majority (36% men, 45% women). Fewer than half across racial/ethnic groups say they would vote “yes” (39% whites, 42% Latinos, 46% other racial/ethnic groups). Just over half of likely voters with incomes under $40,000 (52%) would vote “yes,” compared to fewer in higher-income groups (42% $40,000 to $79,999, 36% $80,000 or more). Nearly half of likely voters ages 18 to 44 (49%) would vote “yes,” compared to 37 percent of older likely voters.
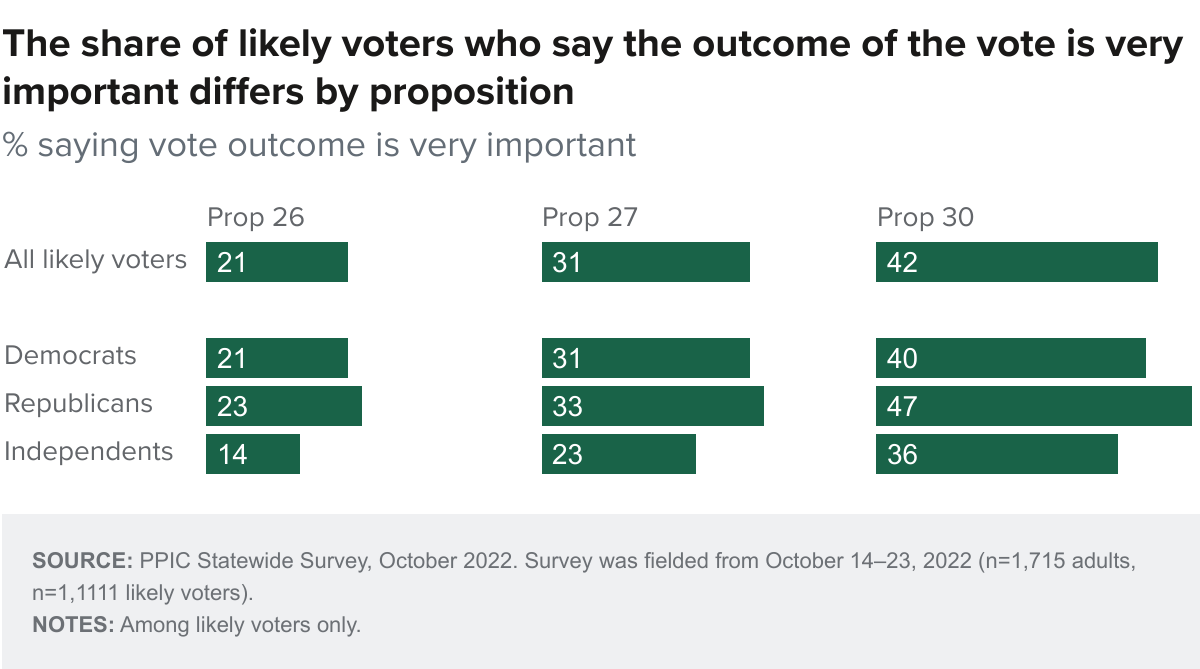
Fewer than half of likely voters say the outcome of each of these state propositions is very important to them. Today, 21 percent of likely voters say the outcome of Prop 26 is very important, 31 percent say the outcome of Prop 27 is very important, and 42 percent say the outcome of Prop 30 is very important. The shares saying the outcomes are very important to them have remained similar to a month ago for Prop 27 (29%) and Prop 30 (42%). Today, when it comes to the importance of the outcome of Prop 26, one in four or fewer across partisan groups say it is very important to them. About one in three across partisan groups say the outcome of Prop 27 is very important to them. Fewer than half across partisan groups say the outcome of Prop 30 is very important to them.
Congressional Elections
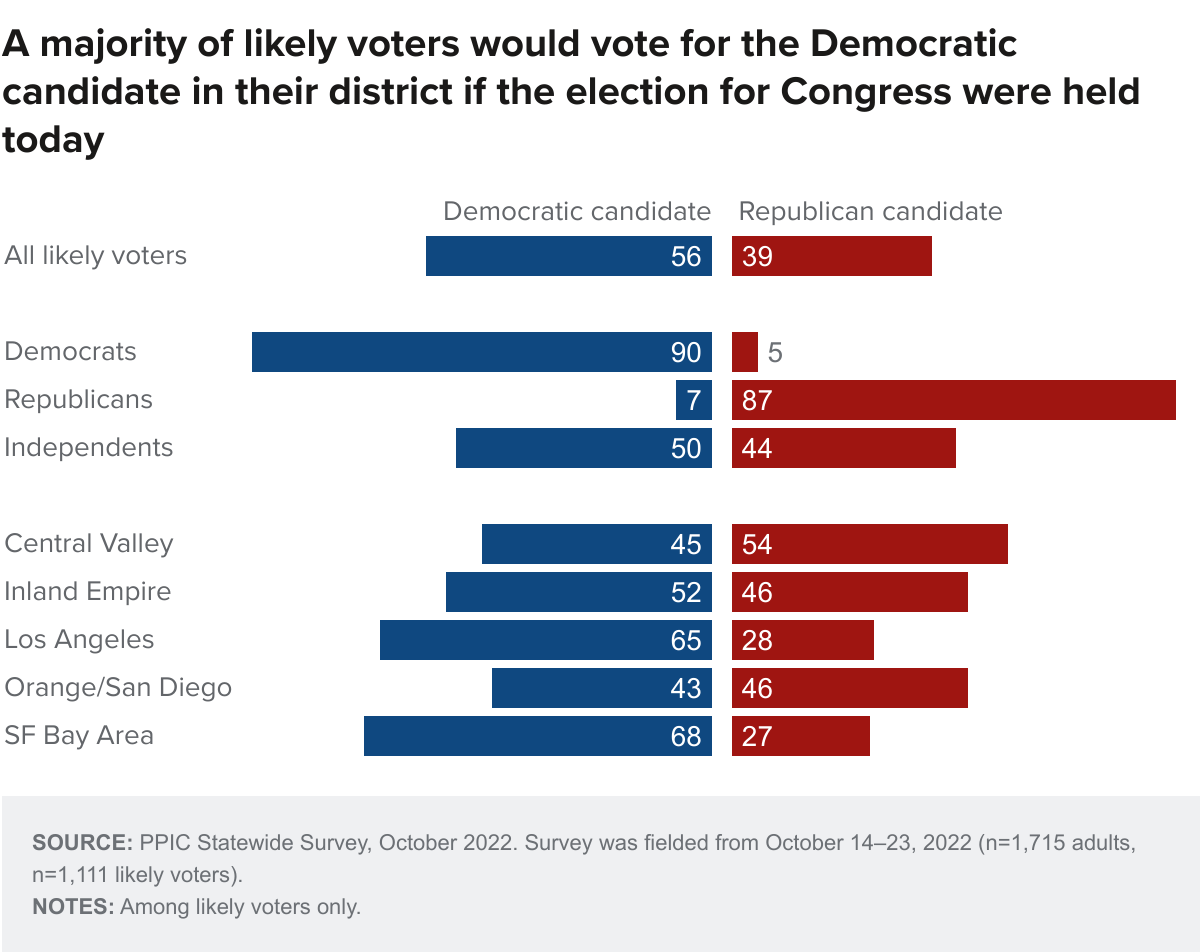
When asked how they would vote if the 2022 election for the US House of Representatives were held today, 56 percent of likely voters say they would vote for or lean toward the Democratic candidate, while 39 percent would vote for or lean toward the Republican candidate. In September, a similar share of likely voters preferred the Democratic candidate (60% Democrat/lean Democrat, 34% Republican/lean Republican). Today, overwhelming majorities of partisans support their party’s candidate, while independents are divided (50% Democrat/lean Democrat, 44% Republican/lean Republican). Democratic candidates are preferred by a 26-point margin in Democratic-held districts, while Republican candidates are preferred by a 23-point margin in Republican-held districts. In the ten competitive California districts as defined by the Cook Political Report, the Democratic candidate is preferred by a 22-point margin (54% to 32%).
Abortion is another prominent issue in this election. When asked about the importance of abortion rights, 61 percent of likely voters say the issue is very important in determining their vote for Congress and another 20 percent say it is somewhat important; just 17 percent say it is not too or not at all important. Among partisans, an overwhelming majority of Democrats (78%) and 55 percent of independents say it is very important, compared to 43 percent of Republicans. Majorities across regions and all demographic groups—with the exception of men (49% very important)—say abortion rights are very important when making their choice among candidates for Congress.

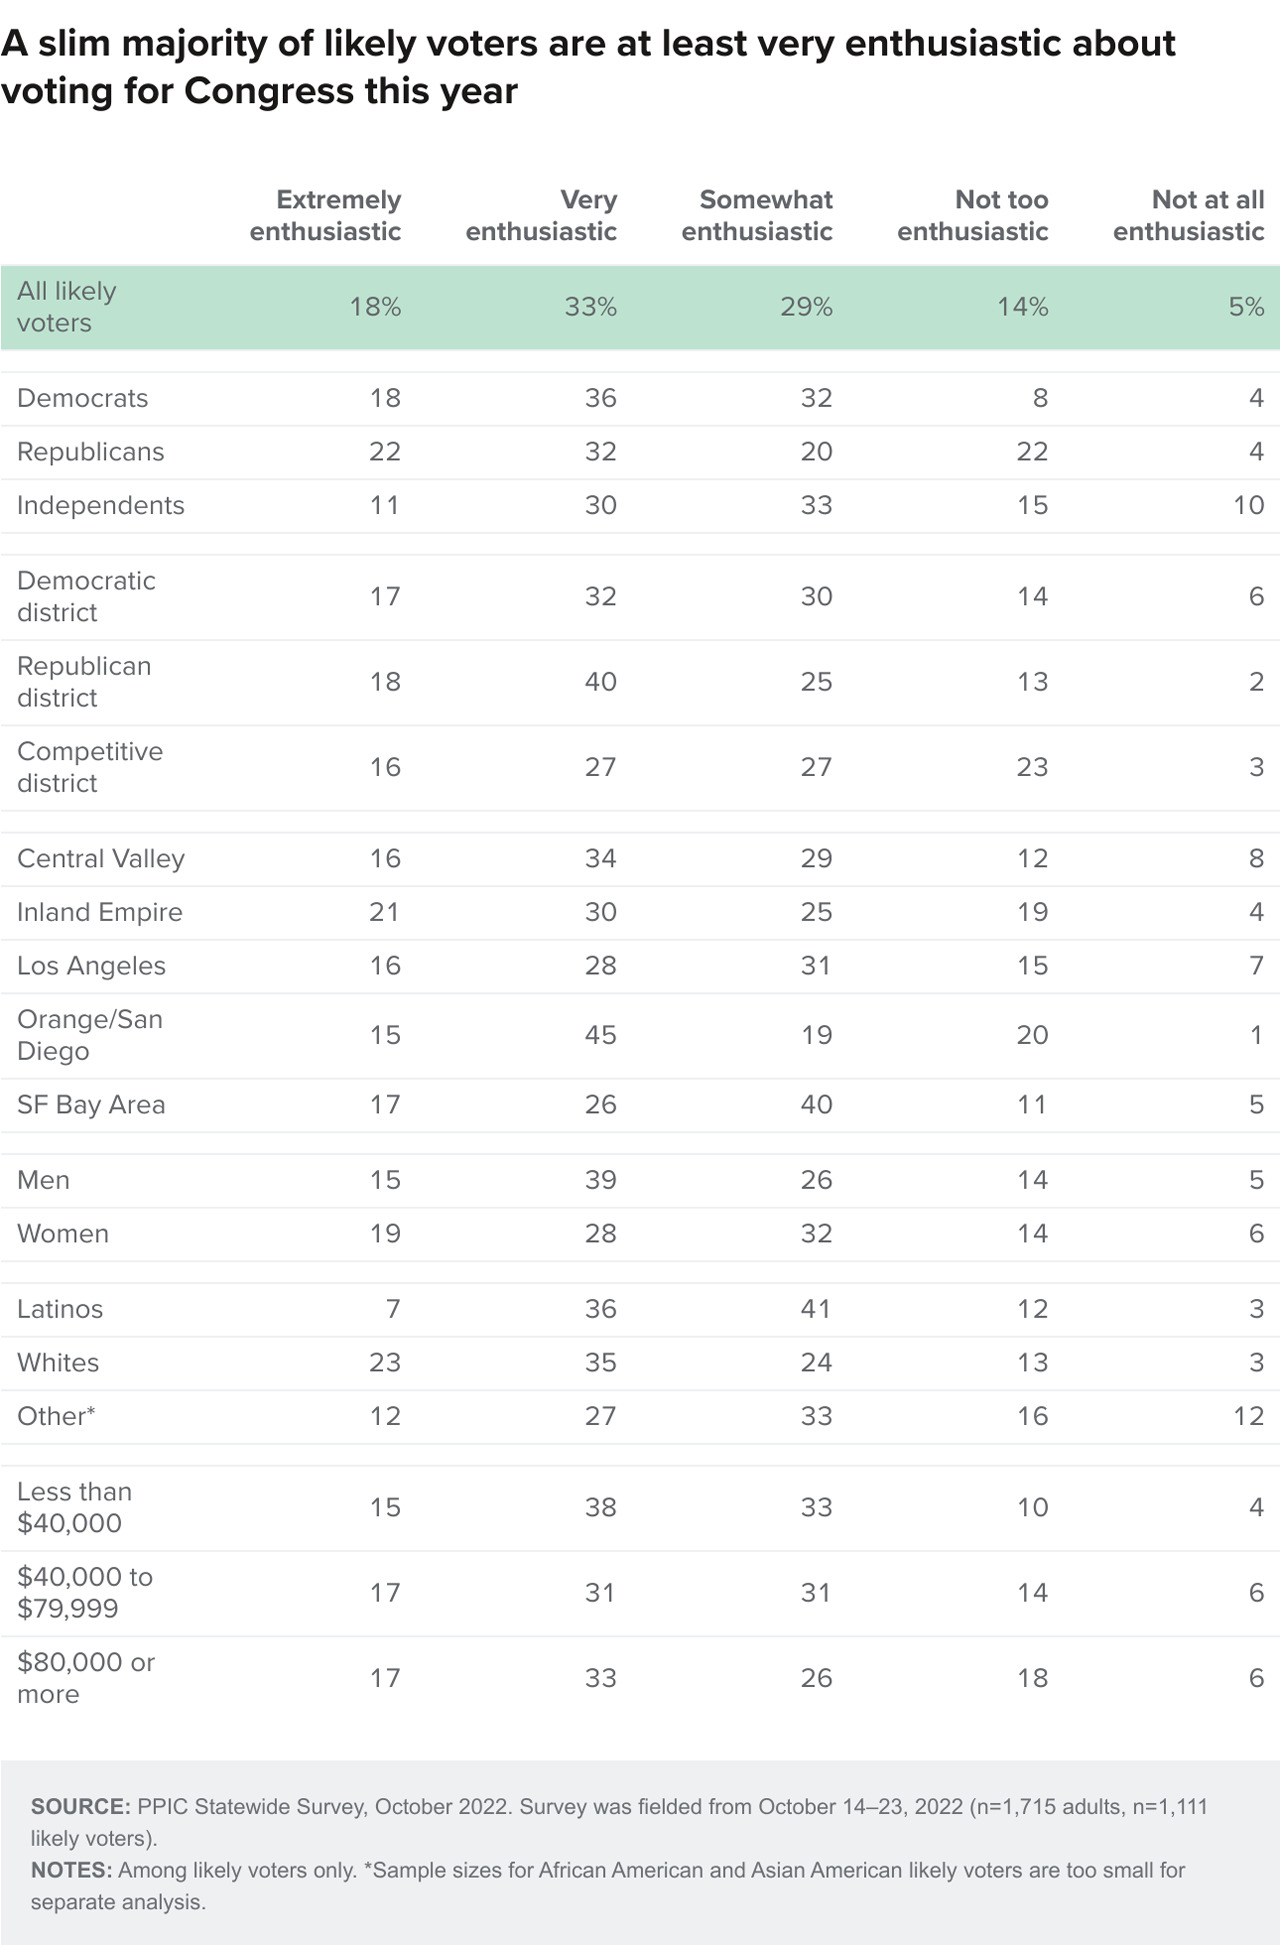
With the controlling party in Congress hanging in the balance, 51 percent of likely voters say they are extremely or very enthusiastic about voting for Congress this year; another 29 percent are somewhat enthusiastic while 19 percent are either not too or not at all enthusiastic. In October 2018 before the last midterm election, a similar 53 percent of likely voters were extremely or very enthusiastic about voting for Congress (25% extremely, 28% very, 28% somewhat, 10% not too, 8% not at all). Today, Democrats and Republicans have about equal levels of enthusiasm, while independents are much less likely to be extremely or very enthusiastic. Half or more across regions are at least very enthusiastic, with the exceptions of likely voters in Los Angeles (44%) and the San Francisco Bay Area (43%). At least half across demographic groups are highly enthusiastic, with the exceptions of likely voters earning $40,000 to $79,999 annually (48%), women (47%), Latinos (43%), those with a high school diploma or less (42%), renters (42%), and 18- to 44-year-olds (37%).
Democracy and the Political Divide
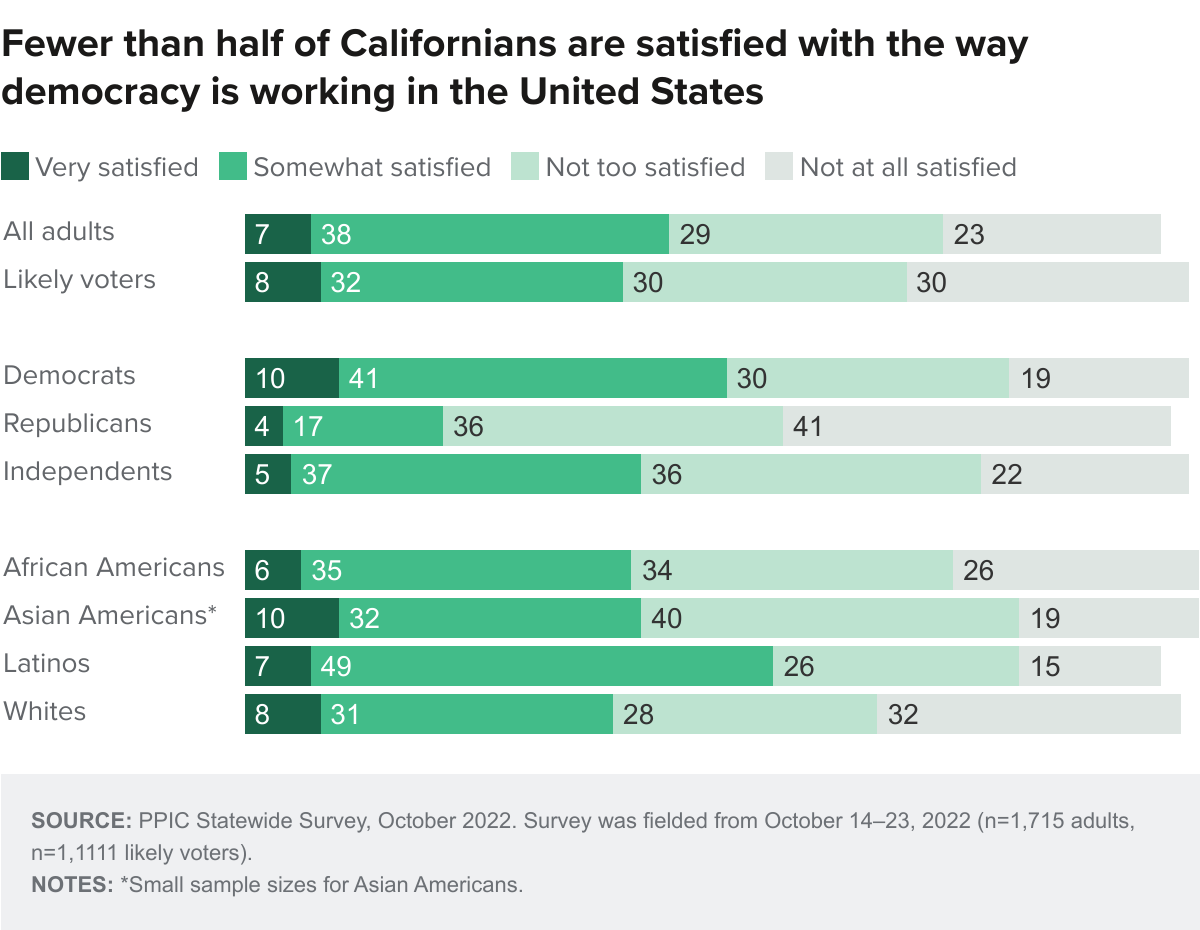
As Californians prepare to vote in the upcoming midterm election, fewer than half of adults and likely voters are satisfied with the way democracy is working in the United States—and few are very satisfied. Satisfaction was higher in our February survey when 53 percent of adults and 48 percent of likely voters were satisfied with democracy in America. Today, half of Democrats and about four in ten independents are satisfied, compared to about one in five Republicans. Notably, four in ten Republicans are not at all satisfied. Across regions, half of residents in the San Francisco Bay Area (52%) and the Inland Empire (50%) are satisfied, compared to fewer elsewhere. Across demographic groups, fewer than half are satisfied, with the exception of Latinos (56%), those with a high school degree or less (55%), and those making less than $40,000 (53%).
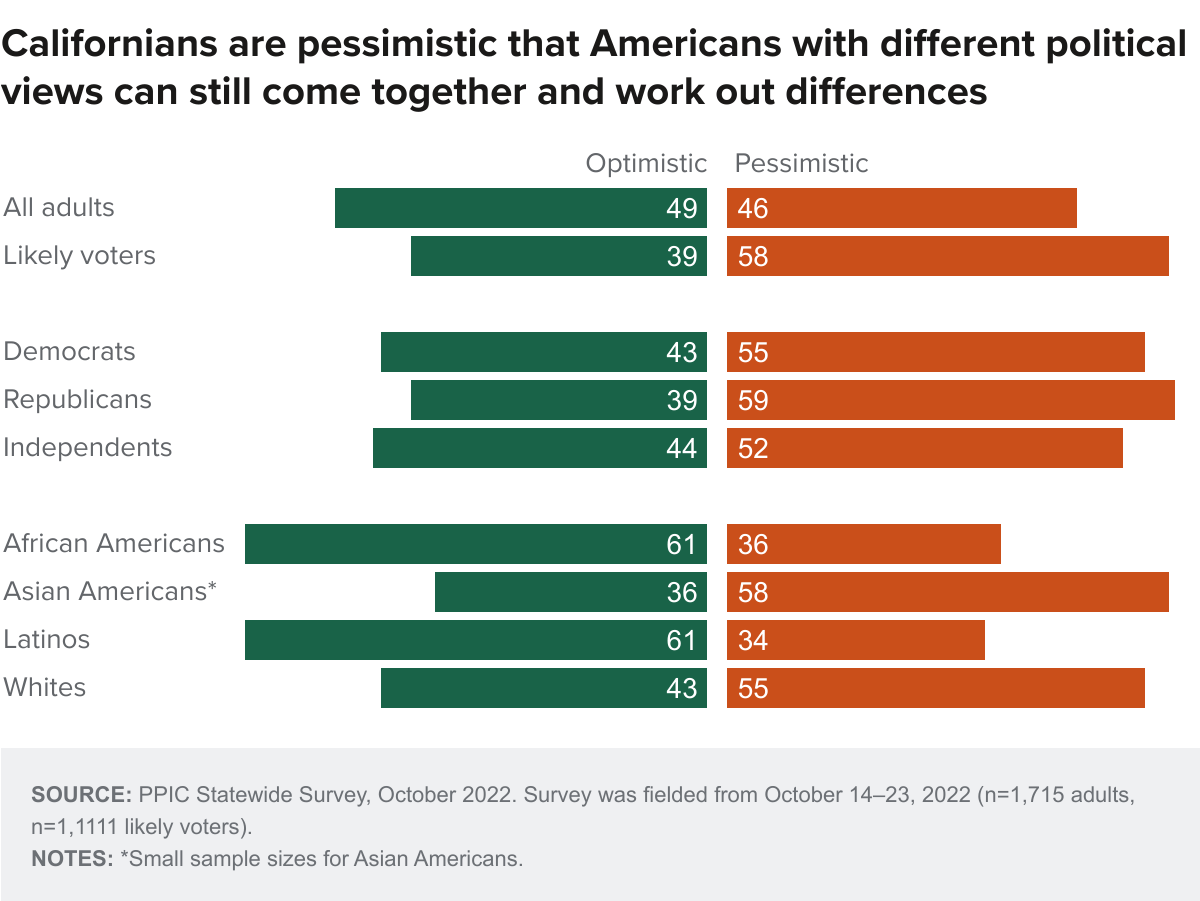
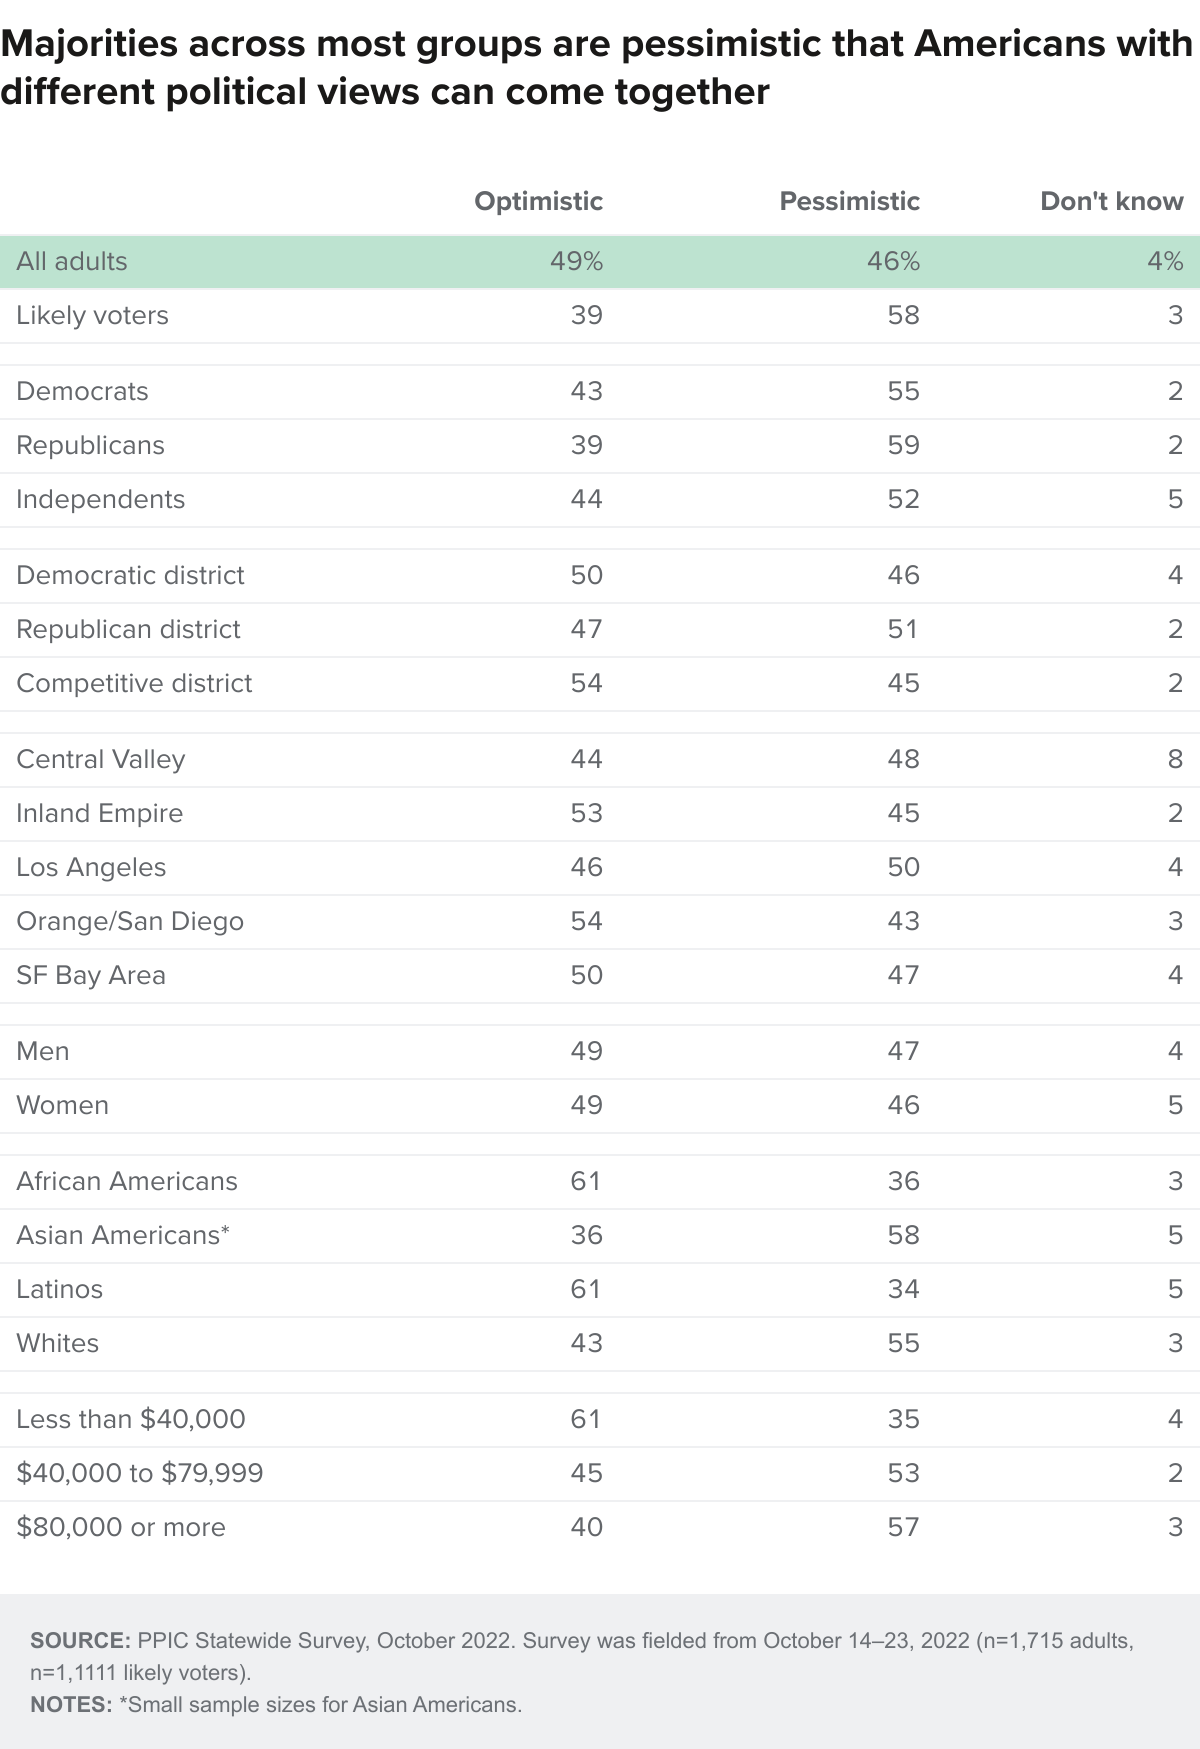
In addition to the lack of satisfaction with the way democracy is working, Californians are divided about whether Americans of different political positions can still come together and work out their differences. Forty-nine percent are optimistic, while 46 percent are pessimistic. Optimism has been similar in more recent years, but has decreased 7 points since we first asked this question in September 2017 (56%). In September 2020, just before the 2020 general election, Californians were also divided (47% optimistic, 49% pessimistic).
Today, in a rare moment of bipartisan agreement, about four in ten Democrats, Republicans, and independents are optimistic that Americans of different political views will be able to come together. Across regions, about half in Orange/San Diego, the Inland Empire, and the San Francisco Bay Area are optimistic. Across demographic groups, only the following groups have a majority or more who are optimistic: African Americans and Latinos (61% each), those with a high school diploma or less (63%), and those with household incomes under $40,000 (61%). Notably, in 2017, half or more across parties, regions, and demographic groups were optimistic.
Approval Ratings
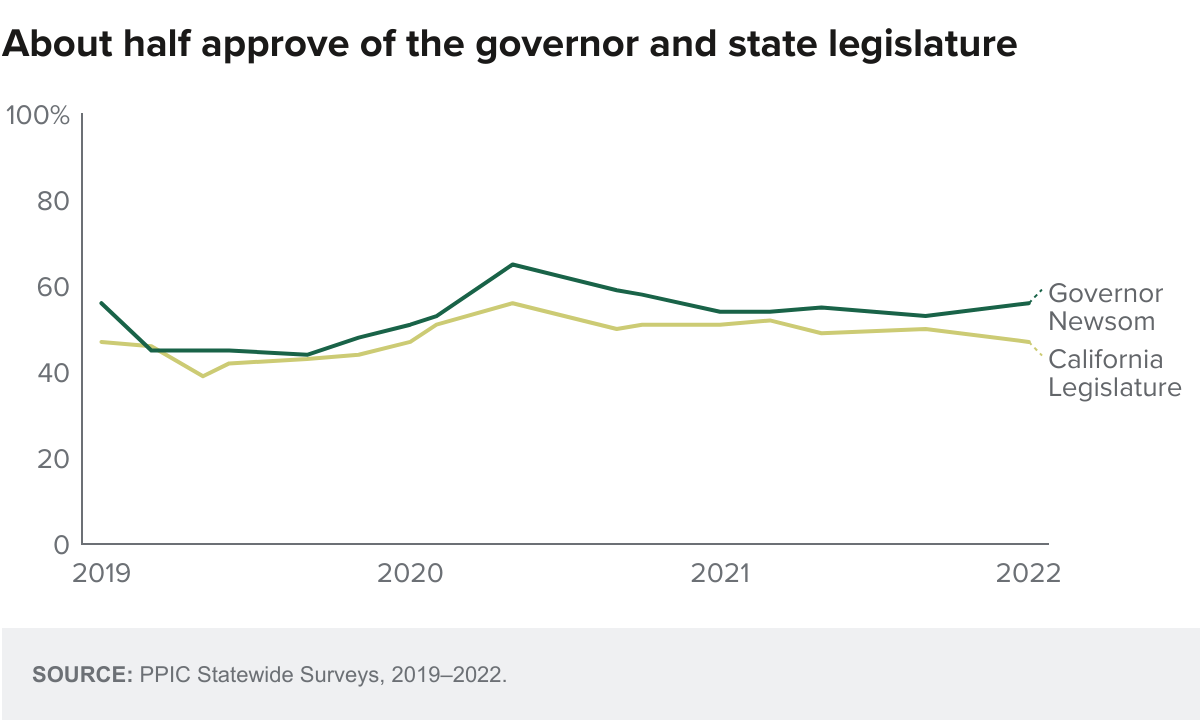
With about two weeks to go before Governor Newsom’s bid for reelection, a majority of Californians (54%) and likely voters (52%) approve of the way he is handling his job, while fewer disapprove (33% adults, 45% likely voters). Approval was nearly identical in September (52% adults, 55% likely voters) and has been 50 percent or more since January 2020. Today, about eight in ten Democrats—compared to about half of independents and about one in ten Republicans—approve of Governor Newsom. Half or more across regions approve of Newsom, except in the Central Valley (42%). Across demographic groups, about half or more approve of how Governor Newsom is handling his job.
With all 80 state assembly positions and half of state senate seats up for election, fewer than half of adults (49%) and likely voters (43%) approve of the way that the California Legislature is handling its job. Views are deeply divided along partisan lines; approval is highest in the San Francisco Bay Area and lowest in Orange/San Diego. About half across racial/ethnic groups approve, and approval is much higher among younger Californians.
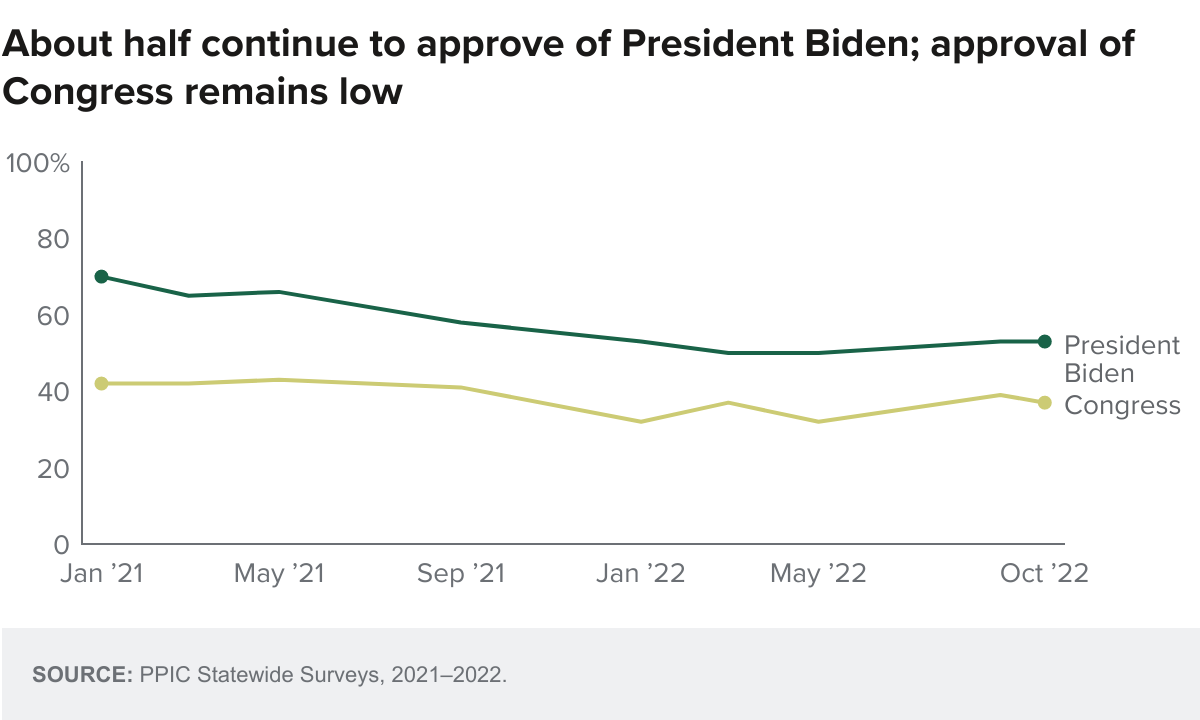
Majorities of California adults (53%) and likely voters (52%) approve of the way President Biden is handling his job, while fewer disapprove (43% adults, 47% likely voters). Approval is similar to September (53% adults and likely voters), and Biden’s approval rating among adults has been at 50 percent or higher since we first asked this question in January 2021. Today, about eight in ten Democrats approve of Biden’s job performance, compared to about four in ten independents and one in ten Republicans. Approval is higher in the San Francisco Bay Area and Los Angeles than in the Inland Empire, Orange/San Diego, and the Central Valley. About half or more across demographic groups approve of President Biden, with the exception of those with some college education (44%).
Approval of Congress remains low, with fewer than four in ten adults (37%) and likely voters (29%) approving. Approval of Congress among adults has been below 40 percent for all of 2022 after seeing a brief run above 40 percent for all of 2021. Democrats are far more likely than Republicans to approve of Congress. Fewer than half across regions and demographic groups approve of Congress.
US Senator Alex Padilla is on the California ballot twice this November—once for the remainder of Vice President Harris’s term and once for reelection. Senator Padilla has the approval of 46 percent of adults and 48 percent of likely voters (adults: 26% disapprove, 29% don’t know; likely voters: 31% disapprove, 22% don’t know). Approval in March was at 44 percent for adults and 39 percent for likely voters. Today, Padilla’s approval rating is much higher among Democrats than independents and Republicans. Across regions, about half in the San Francisco Bay Area, Los Angeles, and the Inland Empire approve of the US senator, compared to four in ten in Orange/San Diego and one in three in the Central Valley. Across demographic groups, about half or more approve among women, younger adults, African Americans, Asian Americans, and Latinos. Views are similar across education and income groups, with just fewer than half approving.
US Senator Dianne Feinstein—who is not on the California ballot this November—has the approval of 41 percent of adults and likely voters (adults: 42% disapprove, 17% don’t know; likely voters: 52% disapprove, 7% don’t know). Approval in March was at 41 percent for adults and 36 percent for likely voters. Today, Feinstein’s approval rating is far higher among Democrats and independents than Republicans. Across regions, approval reaches a majority only in the San Francisco Bay Area. Across demographic groups, approval reaches a majority only among African Americans
Topics
COVID-19 Health & Safety Net Political Landscape Statewide SurveyLearn More
Post Title
Post Title
Statewide Survey: Californians and Their Government
Video: Californians and Their Government
Views of Democracy from the Golden State
Voters’ Views on November’s Propositions
