This problem has been solved!
You'll get a detailed solution from a subject matter expert that helps you learn core concepts.
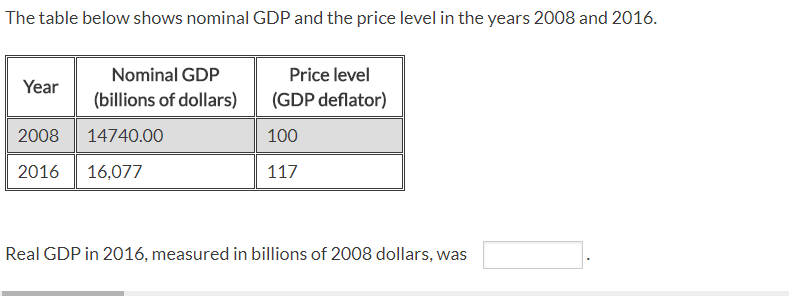
See AnswerSee Answer done loadingQuestion: The table below shows nominal GDP and the price level in the years 2008 and 2016. Nominal GDP Price level ear(billions of dollars) (GDP deflator) 2008 14740.00 2016 16,077 1000 Real GDP in 2016, measured in billions of 2008 dollars, was
 There are 2 steps to solve this one.Who are the experts?Experts have been vetted by Chegg as specialists in this subject.Expert-verified

Transcribed image text:
The table below shows nominal GDP and the price level in the years 2008 and 2016. Nominal GDP Price level ear(billions of dollars) (GDP deflator) 2008 14740.00 2016 16,077 1000 Real GDP in 2016, measured in billions of 2008 dollars, was
Not the question you’re looking for?
Post any question and get expert help quickly.