List of African countries by GDP growth
Last updatedThis article needs to be updated.(August 2022) |
This is a list of estimates of the real gross domestic product growth rate (not rebased GDP) in African states for the latest years recorded in the CIA World Factbook. Only fully recognised sovereign states with United Nations membership are included on this list.
Contents
List
| Real GDP Growth Rates in Africa [1] | ||||||||||||||||||||||||||||||||||||||||||||||||||||||||||||||||||||||||||||||||||||||||||||||||||||||||||||||||||||||||||||||||||||||||||||||||||||||||||||||||||||||||||||||||||||||||||||||||||||||||||||||||||||||||||||
| ||||||||||||||||||||||||||||||||||||||||||||||||||||||||||||||||||||||||||||||||||||||||||||||||||||||||||||||||||||||||||||||||||||||||||||||||||||||||||||||||||||||||||||||||||||||||||||||||||||||||||||||||||||||||||||
See also
Related Research Articles

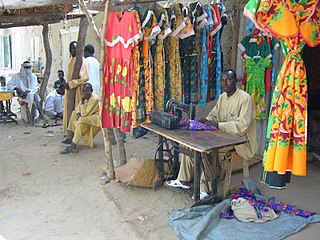
The economy of Chad suffers from the landlocked country's geographic remoteness, drought, lack of infrastructure, and political turmoil. About 85% of the population depends on agriculture, including the herding of livestock. Of Africa's Francophone countries, Chad benefited least from the 50% devaluation of their currencies in January 1994. Financial aid from the World Bank, the African Development Bank, and other sources is directed largely at the improvement of agriculture, especially livestock production. Because of lack of financing, the development of oil fields near Doba, originally due to finish in 2000, was delayed until 2003. It was finally developed and is now operated by ExxonMobil. In terms of gross domestic product, Chad ranks 143rd globally with $11.051 billion dollars as of 2018.

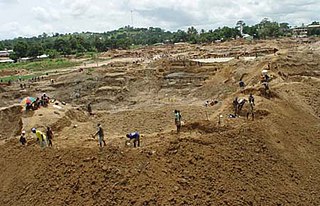
The economy of Sierra Leone is $4.082 billion by gross domestic product as of 2018. Since the end of the Sierra Leone Civil War in 2002, the economy is gradually recovering with a gross domestic product growth rate between 4 and 7%. In 2008 it in PPP ranked between 147th by World Bank, and 153rd by CIA, largest in the world.
The gross world product (GWP) is the combined gross national income of all the countries in the world. Because imports and exports balance exactly when considering the whole world, this also equals the total global gross domestic product (GDP). According to the World Bank, the 2013 nominal GWP was approximately 75.59 trillion United States dollars. In 2017, according to the CIA's World Factbook, the GWP was around $80.27 trillion in nominal terms and totaled approximately 127.8 trillion international dollars in terms of purchasing power parity (PPP). The per capita PPP GWP in 2017 was approximately 17,500 international dollars according to the World Factbook. According to the World Bank, the 2020 GWP in current dollars was approximately $84.705 trillion.

The economy of Central America is the eleventh-largest economy in Latin America, behind Brazil, Mexico, Argentina and Colombia. According to the World Bank, the nominal GDP of Central America reached 204 billion US dollar in 2010, as recovery from the crisis of 2009, where gross domestic product (GDP) suffered a decline to 3.8%. The major economic income are the agriculture and tourism, although the industrial sector is in strong growth, mainly in Panama.
References
- ↑ ""Country Comparison : GDP - Real Growth Rate", CIA World Factbook, accessed 28 July 2017". Cia.gov. Archived from the original on June 13, 2007. Retrieved 2017-07-28.
Text is available under the CC BY-SA 4.0 license; additional terms may apply.
Images, videos and audio are available under their respective licenses.