Maps
Ranked: The World’s Largest Cities By Population
Ranked: The World’s Largest Cities By Population
The world has experienced rapid urbanization over the last century.
Today, more than 4.3 billion people live in urban settings, or 55% of the world’s population.
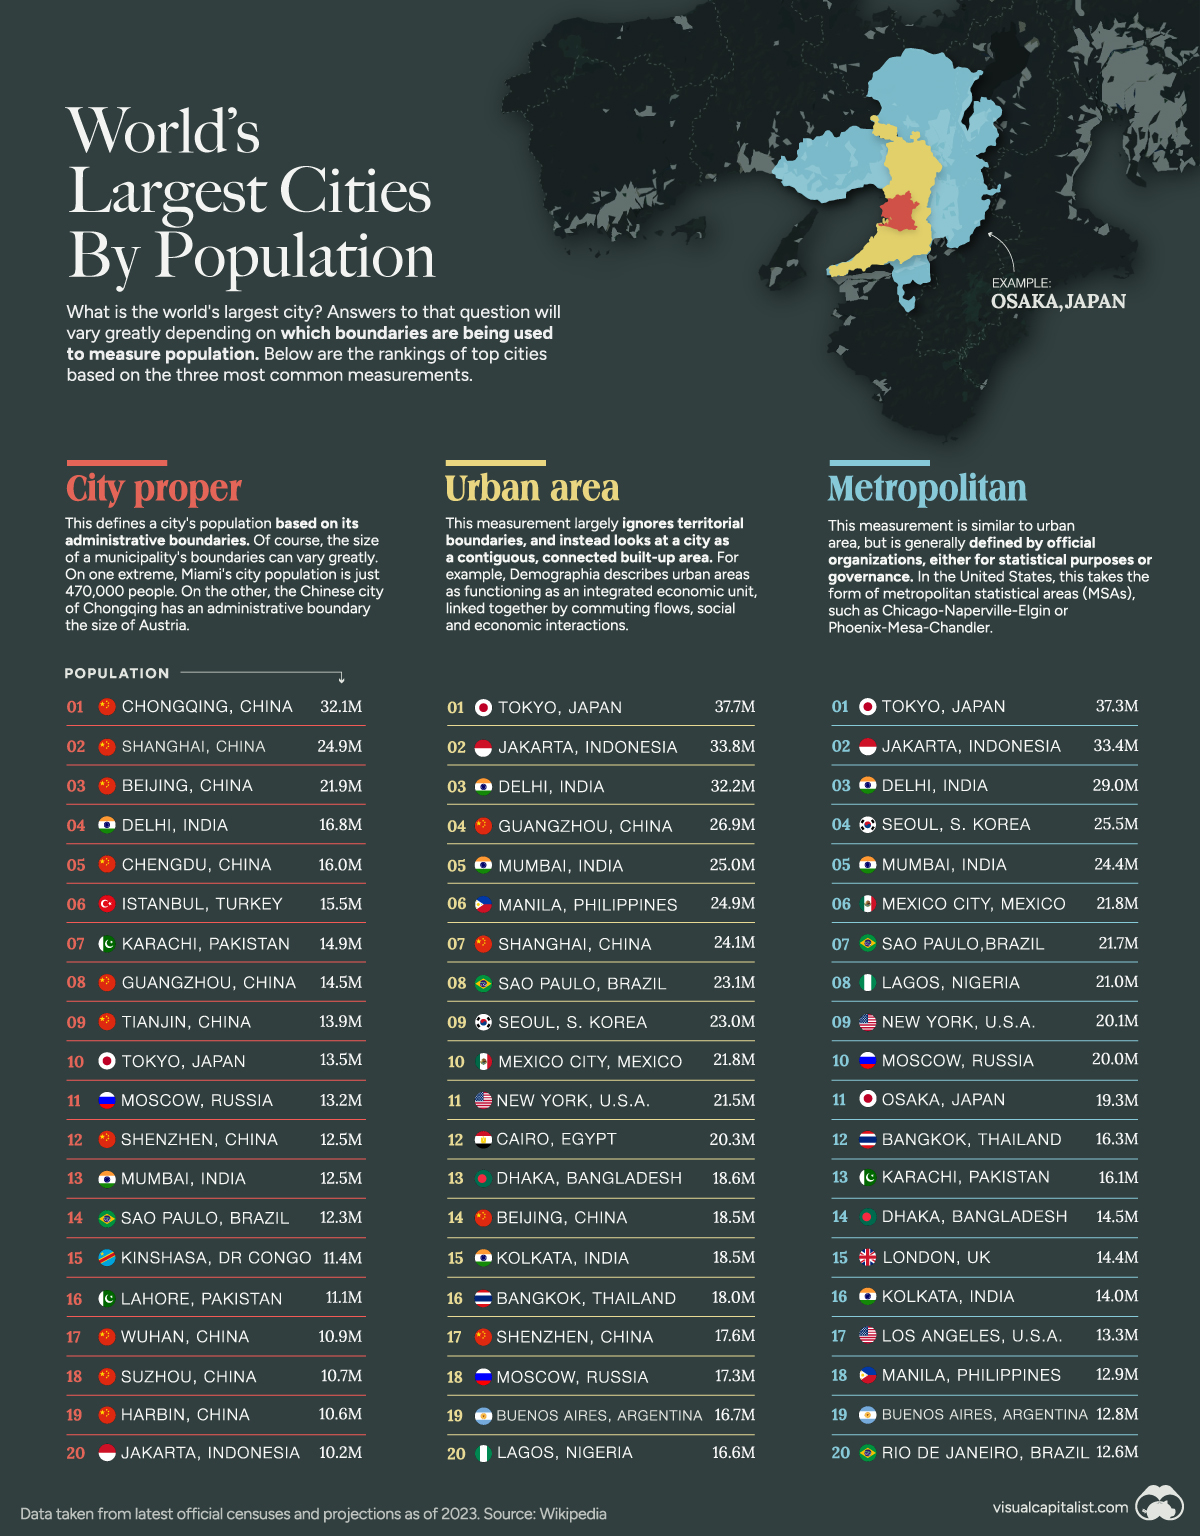
But what is the world’s largest city? Answers to that question will vary greatly depending on which lines are being used to demarcate city boundaries and measure their populations.
The graphic above uses data taken from the latest official censuses and projections to rank the top cities based on the three most common metrics.
The Largest Cities by City Proper
Our first metric is based on the city proper, meaning the administrative boundaries.
According to the United Nations, a city proper is “the single political jurisdiction which contains the historical city center.”
The Chinese city of Chongqing leads the ranks by this metric and has an administrative boundary the size of Austria, with an urban population of 32.1 million.
The city’s monorail system holds records for being the world’s longest and busiest, boasting 70 stations. Chongqing Jiangbei International Airport, is among the world’s top 50 busiest airports. Additionally, the city ranks among the globe’s top 50 hubs for scientific research.
Other Chinese cities dominate the ranking by this metric:
| Rank | City | Population (Million) |
|---|---|---|
| #1 | 🇨🇳 Chongqing | 32.1m |
| #2 | 🇨🇳 Shanghai | 24.9m |
| #3 | 🇨🇳 Beijing | 21.9m |
| #4 | 🇮🇳 Delhi | 16.8m |
| #5 | 🇨🇳 Chengdu | 16.0m |
| #6 | 🇹🇷 Istanbul | 15.5m |
| #7 | 🇵🇰 Karachi | 14.9m |
| #8 | 🇨🇳 Guangzhou | 14.5m |
| #9 | 🇨🇳 Tianjin | 13.9m |
| #10 | 🇯🇵 Tokyo | 13.5m |
The first non-Chinese city, Delhi, has been experiencing one of the fastest urban expansions in the world.
The United Nations projects India will add over 400 million urban dwellers by 2050, compared to 250 million people in China and 190 million in Nigeria.
The Largest Cities by Urban Area
This measurement largely ignores territorial boundaries and considers a city a contiguous, connected built-up area.
Demographia describes urban areas as functioning as an integrated economic unit, linked by commuting flows, social, and economic interactions.
By this metric, Tokyo leads the ranking:
| Rank | City | Population (Million) |
|---|---|---|
| #1 | 🇯🇵 Tokyo | 37.7m |
| #2 | 🇮🇩 Jakarta | 33.8m |
| #3 | 🇮🇳 Delhi | 32.2m |
| #4 | 🇨🇳 Guangzhou | 26.9m |
| #5 | 🇮🇳 Mumbai | 25.0m |
| #6 | 🇵🇭 Manila | 24.9m |
| #7 | 🇨🇳 Shanghai | 24.1m |
| #8 | 🇧🇷 Sao Paulo | 23.1m |
| #9 | 🇰🇷 Seoul | 23.0m |
| #10 | 🇲🇽 Mexico City | 21.8m |
The city proper houses about 10% of Japan’s population. If the greater Tokyo metro area is considered, including cities like Kanagawa, Saitama, and Chiba, then Tokyo’s total population surpasses 37 million—about 30% of the country total.
Consequently, even with one of the world’s largest railway systems, trains in Tokyo are incredibly crowded, with a boarding rate of 200% during peak time in the most overcrowded areas. The city is also famous for its Shibuya Crossing, the busiest intersection on the planet.
The Largest Cities by Metropolitan Area
Tokyo also leads by our final metric, metropolitan area.
This measurement is similar to urban area, but is generally defined by official organizations, either for statistical purposes or governance.
In the United States, this takes the form of metropolitan statistical areas (MSAs), such as Chicago-Naperville-Elgin or Phoenix-Mesa-Chandler.
| Rank | City | Population (Million) |
|---|---|---|
| #1 | 🇯🇵 Tokyo | 37.3m |
| #2 | 🇮🇩 Jakarta | 33.4m |
| #3 | 🇮🇳 Delhi | 29.0m |
| #4 | 🇰🇷 Seoul | 25.5m |
| #5 | 🇮🇳 Mumbai | 24.4m |
| #6 | 🇲🇽 Mexico City | 21.8m |
| #7 | 🇧🇷 Sao Paulo | 21.7m |
| #8 | 🇳🇬 Lagos | 21.0m |
| #9 | 🇺🇸 New York | 20.1m |
| #10 | 🇷🇺 Moscow | 20.0m |
As the global urban population continues to rise, new cities, especially in Africa and Asia, are expected to vie for the “largest” tag soon.
The UN projects that by 2050, 68% of the world will live in urban areas.


Maps
Mapped: The 10 U.S. States With the Lowest Real GDP Growth
In this graphic, we show where real GDP lagged the most across America in 2023 as high interest rates weighed on state economies.


The Top 10 U.S. States, by Lowest Real GDP Growth
This was originally posted on our Voronoi app. Download the app for free on iOS or Android and discover incredible data-driven charts from a variety of trusted sources.
While the U.S. economy defied expectations in 2023, posting 2.5% in real GDP growth, several states lagged behind.
Last year, oil-producing states led the pack in terms of real GDP growth across America, while the lowest growth was seen in states that were more sensitive to the impact of high interest rates, particularly due to slowdowns in the manufacturing and finance sectors.
This graphic shows the 10 states with the least robust real GDP growth in 2023, based on data from the Bureau of Economic Analysis.
Weakest State Economies in 2023
Below, we show the states with the slowest economic activity in inflation-adjusted terms, using chained 2017 dollars:
| Rank | State | Real GDP Growth 2023 YoY | Real GDP 2023 |
|---|---|---|---|
| 1 | Delaware | -1.2% | $74B |
| 2 | Wisconsin | +0.2% | $337B |
| 3 | New York | +0.7% | $1.8T |
| 4 | Missississippi | +0.7% | $115B |
| 5 | Georgia | +0.8% | $661B |
| 6 | Minnesota | +1.2% | $384B |
| 7 | New Hampshire | +1.2% | $91B |
| 8 | Ohio | +1.2% | $698B |
| 9 | Iowa | +1.3% | $200B |
| 10 | Illinois | +1.3% | $876B |
| U.S. | +2.5% | $22.4T |
Delaware witnessed the slowest growth in the country, with real GDP growth of -1.2% over the year as a sluggish finance and insurance sector dampened the state’s economy.
Like Delaware, the Midwestern state of Wisconsin also experienced declines across the finance and insurance sector, in addition to steep drops in the agriculture and manufacturing industries.
America’s third-biggest economy, New York, grew just 0.7% in 2023, falling far below the U.S. average. High interest rates took a toll on key sectors, with notable slowdowns in the construction and manufacturing sectors. In addition, falling home prices and a weaker job market contributed to slower economic growth.
Meanwhile, Georgia experienced the fifth-lowest real GDP growth rate. In March 2024, Rivian paused plans to build a $5 billion EV factory in Georgia, which was set to be one of the biggest economic development initiatives in the state in history.
These delays are likely to exacerbate setbacks for the state, however, both Kia and Hyundai have made significant investments in the EV industry, which could help boost Georgia’s manufacturing sector looking ahead.

-

 Personal Finance1 week ago
Visualizing the Tax Burden of Every U.S. State
-

 Misc6 days ago
Visualized: Aircraft Carriers by Country
-

 Culture6 days ago
How Popular Snack Brand Logos Have Changed
-

 Mining1 week ago
Visualizing Copper Production by Country in 2023
-

 Misc1 week ago
Charted: How Americans Feel About Federal Government Agencies
-

 Healthcare1 week ago
Which Countries Have the Highest Infant Mortality Rates?
-

 Demographics1 week ago
Mapped: U.S. Immigrants by Region
-

 Maps1 week ago
Mapped: Southeast Asia’s GDP Per Capita, by Country