Much forex trading by speculators is based on technical analysis. In this third part of an article series on trading forex, we’ll look at what technical tools you should focus on. Earlier in this series, I mentioned that forex trading is in many ways simpler than equity trading, since there are far fewer currency pairs than there are stocks. It is also important to understand that currency prices move differently. While a stock can climb or fall within a huge range — to pick an infamous example, Enron peaked at $90.56 per share in August 2000 and fell to $0.26 by November 30, 2001 just before its bankruptcy filing — currencies, by comparison, tend to move within a relatively narrow band or channel. This is because each currency represents buying power in its home country, which will only vary so much within the global economy, and because central banks intervene to affect valuation in the event their currency becomes too strong or too weak.
There are certainly fundamentals that affect currency values, and I will take a look at some of those in a later article. But much of the forex trading by speculators is based on technical analysis, particularly for short-term trading. That is what I will tackle here.
Know The Charts
Technical analysis is based on chart patterns. That means you need to first understand what charts are used and how to read them. If you are accustomed to equity charts, this will be simple for you. The most basic chart is the line chart. It shows a single price per trading session or other time period (virtually always the closing price) as a point, with each point connected to form a solid line. While such a chart does show price trends over time, it provides the least detail. Don’t automatically assume that a line chart shows daily prices; while that is a common format, on very long-term charts you may see weekly prices instead. Going the other way, a line chart can just as easily portray hours or even shorter increments.
Suggested Books and Courses About Candlestick Trading
More informative is the bar chart, often called an OHLC chart because each bar shows the open, intrasession high, intrasession low, and close. For each session, a vertical bar shows the day’s full price range, stretching from the low to the high. A small horizontal tick mark on the left side of the bar shows the opening price, and another horizontal tick on the right side shows the closing price. While it takes a little study, reading a bar chart provides plenty of information. The main drawback is that a chart covering a long time period can become crowded and difficult to read. As with line charts, a bar chart can also show weekly prices rather than daily, or shorter ranges, such as hourly.
A variation on the bar chart is the candlestick chart. The name candlestick comes from the bar being shaped like a narrow, vertical rectangle, with single lines extending from the top and bottom (Figure 1). In this sense, it resembles a candle with wicks on the top and bottom.
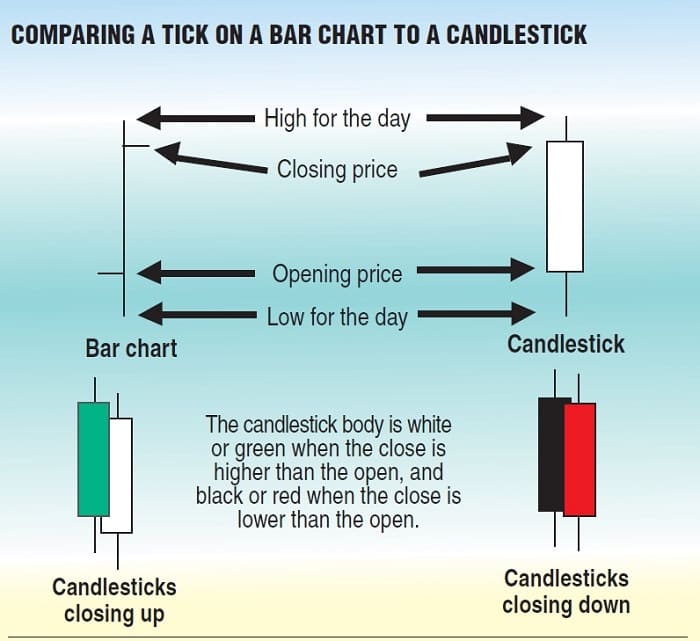
FIGURE 1: COMPARING A TICK ON A BAR CHART TO A CANDLESTICK. They have all the same components, but the candlestick emphasizes the direction and depth of the opening and closing prices.
The wicks show the full intrasession range, stretching from the low to the high. The candlestick body shows the range from the opening price to the closing price. To indicate a close higher than the open, the body will be colored green or white. To indicate a close below the open, the body will be red or black. Candlestick charts pack plenty of useful information into a compact, easy-to-read format. Candlesticks are much more intuitive to read than bars when determining up and down price movement thanks to the color coding. For that reason, they are the most commonly used chart type among forex traders.
Support & Resistance
The most fundamental indicators in forex technical analysis are the same as those in equity trading: support & resistance lines, trendlines, and channels & ranges. Support lines emerge when a currency hovers near a low for at least several sessions but remains above it. This is not an absolute; the price may fall below the support a time or two. This indicates that there are enough traders who are willing to buy the currency at or around that price to keep it from falling further.
Typically, once a currency reaches a support level, it will eventually reverse and begin trending upward. This can take a while, however; the more times a support line is tested and holds, the stronger it becomes. This process is called confirmation. The converse of the support line is the resistance line. It represents a price level that the currency cannot seem to push past and break higher. As with support lines, resistance lines are not absolute and form over at least several sessions, and can be confirmed in the same manner. Also similarly, after lingering near a resistance level for a while, a currency will often reverse and head down.
I cannot emphasize enough that support & resistance lines are guides, not absolute boundaries. Don’t think that one of these lines has been violated just because a currency crosses it a time or two, or even a few times if the currency lingers near its support or resistance for a while. In addition, support & resistance lines can swap roles in the event of a reversal. In other words, once a currency finally breaks through resistance, the resistance line will often become a support line, and the opposite is true for support lines. Be aware that in forex trading, these lines often form at psychologically significant prices like 1.5000, 1.7500, or other round numbers, simply because it is human nature to set trading triggers at such points.
Trendlines And Channels
When a currency isn’t moving along a support or resistance line, it is trending — and currencies do so about 70% of the time. A trendline is drawn along the bottoms (for an upward trend) or tops (for a downward trend) of closing prices. Naturally, as a currency advances in either direction, it will have periodic minor reversals, but the overall direction will be clear. An upward trend is essentially a series of higher highs and higher lows; a downward trend is just the opposite. The price needs to touch the trendline (that is, reach it but not break through it) at least three times to confirm it. Note that the steeper the trendline, the less reliable it is, and the more likely it is to quickly be broken or reversed. Lasting sharp price changes in either direction are simply less likely and less sustainable.
It may occur to you as you contemplate trendlines that as a currency heads up or down, or even moves sideways, it will only bounce so high or so low. Such an assumption would be correct, and in fact currencies tend to trend in channels. If you draw support & resistance lines along the price history of a trending currency, you will create a channel. (It is important that these lines be parallel. If it’s not possible to draw parallel lines based on price movement, then no channel exists. Never force a trendline to fit, because you’ll end up with an invalid and therefore useless line.)
Suggested Books and Courses About Chart Patterns
The value of a channel is that it shows you predictable highs & lows. Once you can see a consistent trading range, it becomes possible to buy at the bottom of the channel and sell at the top. The width of the channel will also show you the profit you can expect from the trade. If you are trading based on support or resistance lines, you are basically playing the bounce, or waiting for the currency pair to touch the line and reverse. If a channel exists, it provides a means to determine the best exit point for the trade.
In some cases, when support or resistance is broken, you may see instances of trader’s remorse. This is caused by uncertainty among a large number of traders as to whether what has occurred is a true breakout, and results in the price returning briefly to the support or resistance before breaking more definitively in the same direction once more. This return is a great place to trade, since you can be fairly certain it will be followed by a much stronger movement, but not all breakouts experience trader’s remorse, so it is an uncommon opportunity.
Reading The Candlesticks
I previously mentioned that candlestick charts are the most common type of chart that is used. Even though a candlestick represents a single trading session, you can glean important information from it. Since the candlestick body represents intrasession price movement, its size can indicate a couple of things. An unusually long body shows a drastic price change either up or down. An unusually short body means a lack of trading activity, that is, lack of trader interest, or buying & selling pressure that is approximately balanced equally.
The length of the wicks can be informative as well. When one or both wicks are long, it shows that the price tested higher highs or lower lows (or both) but did not hold there. Very short wicks show strong buying or selling pressure that resulted in a close near the intrasession high or low. The wicks are sometimes called shadows since they are echoes of price movements. Reading individual candlesticks becomes even more meaningful when they are compared to previous activity or trends.
When support or resistance is broken, you may see instances of trader’s remorse.
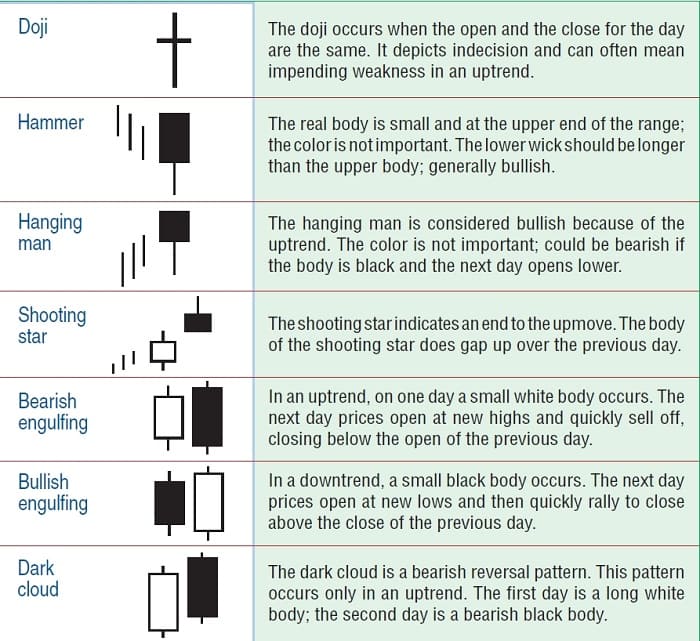
While single candlesticks can’t really be said to form patterns, there are terms for certain types of candlesticks. The spinning top is a short-bodied candlestick (the wick length is immaterial) which as I’ve already discussed represents either a lack of interest or roughly equal buying and selling pressure. Seen at a support or resistance line, it serves as confirmation of that line.
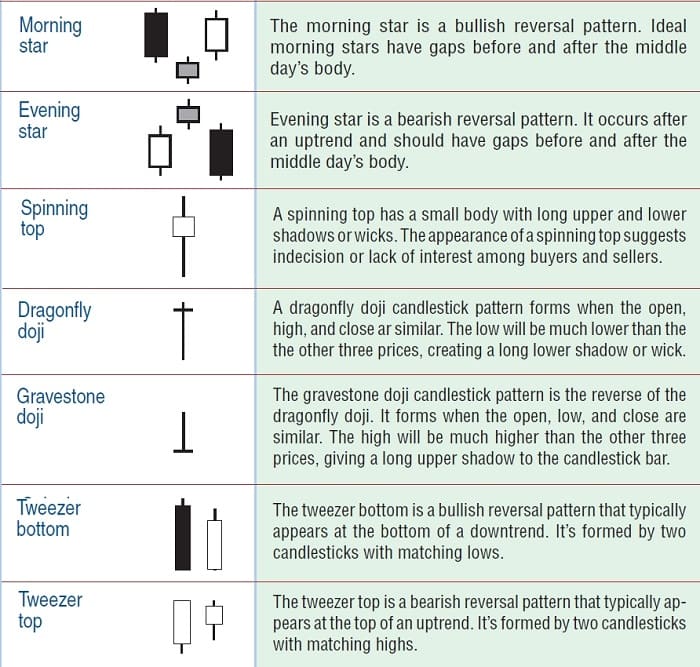
If the closing price ends up being the same as the opening price, the candlestick forms a doji. A basic doji looks like a cross and shows extreme indecision in the market — the price swung through an intrasession trading range but went nowhere in the end. If the bottom wick is very long and the top wick is very short, this forms a dragonfly doji, so named because it resembles a dragonfly with the wings formed by the candlestick body just behind the head of the top wick. It is typically an indicator of coming reversal. The converse of the dragonfly doji is the gravestone doji, which has a long top wick and short bottom wick. Not surprisingly since the close is very near the intrasession low, the gravestone is bearish and signals a likely coming downturn. In both the dragonfly and gravestone dojis, the length of the longer wick is a measure of the signal’s strength.
The hammer forms when the candlestick body is short and there is no upper wick, meaning the short body rests atop a lower wick and making it look like its namesake. When it follows a long downward trend, it is a bullish reversal signal. A hammer that appears after an uptrend is called a hanging man. An inverted hammer (long upper wick above a short body and no lower wick) is normally a signal for the reversal of a downtrend, since it shows price beginning to test upward movement.
Pairing two successive candlesticks creates double candlestick patterns. The first is the engulfing candlesticks, which results when the second candlestick is significantly larger than the first one (and can therefore engulf it). The pattern is bullish if the first candlestick represents downward movement and the second is upward; if the converse is true, the pattern is bearish. Both are reversal patterns.
Next is the tweezer, which like the engulfing pattern is made up of two opposite price movements. The difference is that in the tweezer, the candlestick bodies are the same size. The wicks should also be very close in size. Tweezers normally confirm support or resistance, with the second candlestick showing the reversal after the price touches the line. Finally, the double doji (two doji candlesticks in succession) is a signal for coming volatility. It is an important signal for breakouts. The triple candlestick patterns are rare, but for that reason they are also powerful. The morning star and evening star patterns are the most powerful bullish and bearish candlestick patterns known. The morning star is formed by two bearish candlesticks, the second of which must be short, followed by a long bullish candlestick. In some cases the second one will be a doji; this creates a morning doji star. The evening star is the opposite, composed of two bullish candlesticks followed by a bearish one. In either case, the pattern reveals the strong reversal of the prior trend indicated by the first two candlesticks. The short body of the second one shows uncertainty entering the market, followed by the reversal in the third session.
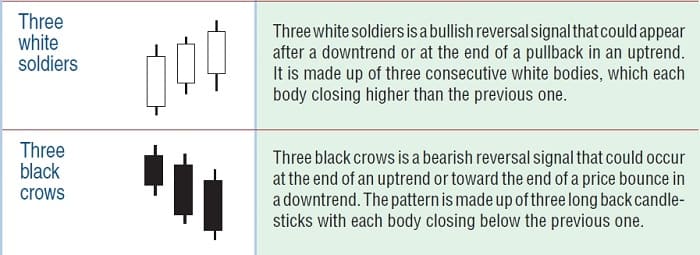
Three successive bullish candlesticks of approximately the same body length, which must be fairly long, are known as three soldiers. The top wicks should be fairly short, indicative of strong upward momentum. It is, needless to say, a bullish signal. Its opposite, made of three black-bodied bearish candlesticks, is the three crows. They signal strong downward momentum and are often seen following a downward breakout or reversal.
Imran Mukati is the Managing Director of fixed income securities at Fairbridge Capital Markets, Inc.