Unique Raindrop Pattern of Turquoise from Hubei, China

ABSTRACT
“Raindrop” turquoise is a recently recognized and characterized pattern with a saturated coloration resembling raindrops. This material is very rare but popular in the Chinese gem trade. This paper investigates the differences among the raindrops, veins, and substrates (the matrix portion) of turquoise with this unique pattern using X-ray diffraction, electron probe micro-analysis, laser ablation–inductively coupled plasma–mass spectrometry, and micro-spectroscopic techniques (Raman, FTIR, and UV-Vis). The raindrops and veins were identified as mixtures of turquoise and fluorapatite, which were distinct from the substrates. Nearly pure fluorapatite and turquoise were also discovered in the veins. The color origin of the brownish yellow raindrops and substrates are discussed, as well as the formation mechanism of the raindrop pattern.
INTRODUCTION
Turquoise has been widely used in jewelry and artifacts because of its attractive color. It has a very long history and has played a crucial role in various cultures worldwide (Khazeni, 2014; Kostov, 2019), such as ancient Egypt (Mansour, 2014), Iran (Beale, 1973; Ovissi et al., 2017), Mexico, and the Americas (Harbottle and Weigand, 1992; Weigand and Harbottle, 1993; Hedquist, 2016). Turquoise was used even earlier in Eurasia, between 8000 and 7000 BCE (Kostov, 2019). Turquoise is also closely interwoven with Chinese culture and civilization (Hao and Hao, 2002). Archaeologists proved that the Chinese used it for decoration in Peilligang culture beginning in the Neolithic age (Pang, 2014). The earliest turquoise artifacts in China were found at the Jiahu site in Wuyang County, Henan Province, and traced back to 7000–5800 BCE (Zhang and Pan, 2002; Yang et al., 2017). Their origin has not been confirmed yet (Feng et al., 2003; Mao et al., 2005; Wang et al., 2007). Throughout the long development of Chinese culture and history, turquoise has been endowed with abundant connotations and functions related to political, decorative, economic, and religious aspects. It has always been regarded as a unique and precious gemstone in China, especially in Tibet and Inner Mongolia. Turquoise artifacts not only recorded the development of human society but also reflected exchanges between cultures.
Researchers have succeeded in developing methods of origin traceability of turquoise in the southwestern United States and northern Mexico using hydrogen and copper isotopes (Hull et al., 2008; Hull and Fayek, 2012; Hull et al., 2014) as well as lead and strontium isotopes (Thibodeau et al., 2012; Thibodeau et al., 2015; Thibodeau et al., 2018) to identify the source of turquoise artifacts. Similar approaches were applied to investigate the turquoise artifacts from different regions of China (Ye et al., 2014; Li et al., 2018; Xian et al., 2018).
Turquoise deposits are widespread in China, including Zhushan County (Chen et al., 2012) in Hubei Province; the cities of Ma’anshan (Chen and Qi, 2007) and Tongling (Zuo et al., 2018) in Anhui Province, Baihe County (Shi and Cai, 2008; Zhao et al., 2017) and the city of Shangluo (Luo et al., 2017) in Shanxi Province, Xichuan area of Henan Province (Zhou and Jiang, 2005); and the city of Kumul (or Hami in Chinese) in Xinjiang Uyghur Autonomous Region (Luan, 2001; Liu et al., 2018). Numerous detailed characteristics of turquoise from these locations have been reported in recent years, including its spectra, structure, and chemical and mineral compositions (Chen and Qi, 2007; Chen et al., 2012; Luo et al., 2017; Zhao et al., 2017; Liu et al., 2018; Xian et al., 2018; Zuo et al., 2018; Li et al., 2019; Liu et al., 2019a).
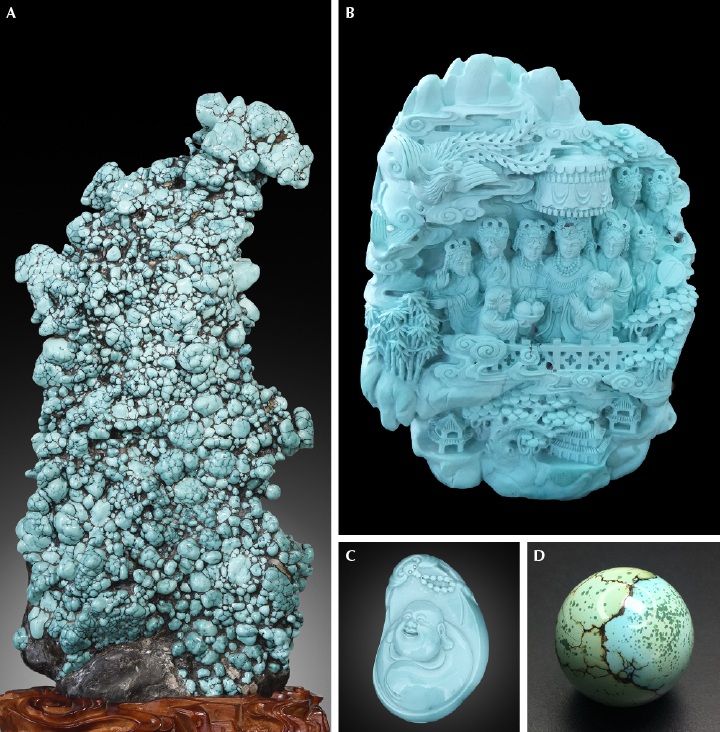
However, Hubei Province is the largest commercial source in the world. Turquoise (a supergene mineral) from this province occurs mainly in the carbon-bearing siliceous rocks, siliceous rocks, and schist of the Lower Cambrian (Tu, 1996). Rich phosphate, iron, and copper ores are the main sources for turquoise formation (Tu, 1997a). Most of the rough turquoise mined from these deposits is surrounded by black rocks that easily distinguish them from those mined in other locations. In 2015, a massive blue rough turquoise, together with its enclosing rocks weighing more than 11 tons, was extracted in Zhushan County, Hubei Province (figure 1). Consequently, miners had to divide it into two parts to transfer them out of the mine. The mines located in Hubei Province have produced many high-quality (figure 2) and unique turquoise with special patterns (detailed in box A) that were interpreted in Turquoise Grading, National Standard of the People’s Republic of China, GB/T36169-2018 (see He et al., 2018).
BOX A: UNIQUE PATTERNS OF TURQUOISE FROM HUBEI PROVINCE |
|
Growth layer pattern: A pattern in which the regular color-zoning bands of turquoise resemble water ripples (Ku and Yang, 2021) (see image A in figures A-1 and A-2). 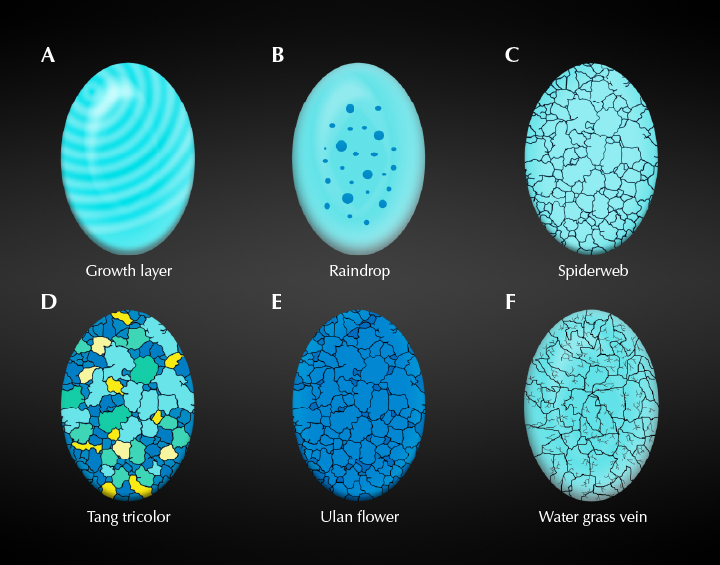
Figure A-1. Schematic of turquoise patterns. Illustrated by Ling Liu.
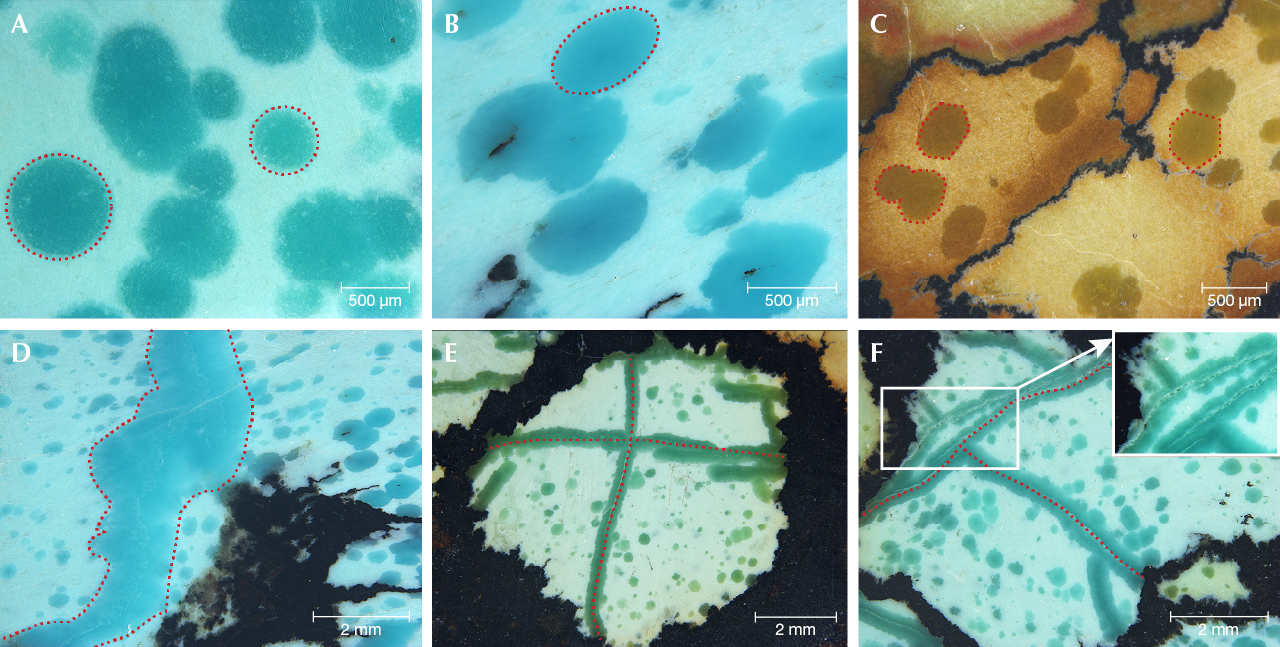
Raindrop pattern: A rare turquoise pattern with a distribution of numerous drop-shaped spots (image B in figures A-1 and A-2). Spiderweb pattern: This type has fine and uniform black net veins, usually referred to as “iron lines” in Chinese, that resemble a spiderweb (image C in figures A-1 and A-2). Spiderweb turquoise can display a wide range of color, including light to deep blue, green-blue, and green. 
Figure A-2. Turquoise patterns from Hubei Province: growth layer (A), raindrop (B), spiderweb (C), Tang tricolor (D), Ulan flower (E), and water grass vein (F). Photos by Ling Liu (B, C, and F); courtesy of Jiang Li (A), an anonymous jewelry dealer (D), and Mingxing Yang (E).
Tang tricolor pattern: A term used to describe multicolored turquoise with typically blue, green, and yellow colors (image D in figures A-1 and A-2). The term was originally applied to a kind of multicolored glazed pottery prevalent in the Tang Dynasty (Yu and Zhang, 1994; Zhang, 2008; Ma et al., 2014). Ulan flower pattern: An extremely valuable subtype of spiderweb turquoise. It shows similar uniform black net veins but possesses a much deeper and more saturated blue color (“Ulan”) (image E in figures A-1 and A-2). “Flower” refers to the pattern formed by the fine black veins. Water grass vein pattern: The iron lines of this turquoise resemble waterweeds (image F in figures A-1 and A-2). |
In China, rough turquoise was traditionally treated with wax, resin, or polymers due to its high porosity. However, Chinese consumers prefer natural turquoise rather than artificially treated and synthetic counterparts. Thus, resin and polymer treatments are not as acceptable in the Chinese turquoise trade or as common as in the past. The most popular treatment is “porcelain enhancement,” designed to improve the compactness, densification, and luster of turquoise. Its key techniques are still confidential and not publicly available. The identification characteristics of this porcelain-enhanced turquoise and the fillers used were investigated by Deng et al. (2019) and Liu et al. (2019b).
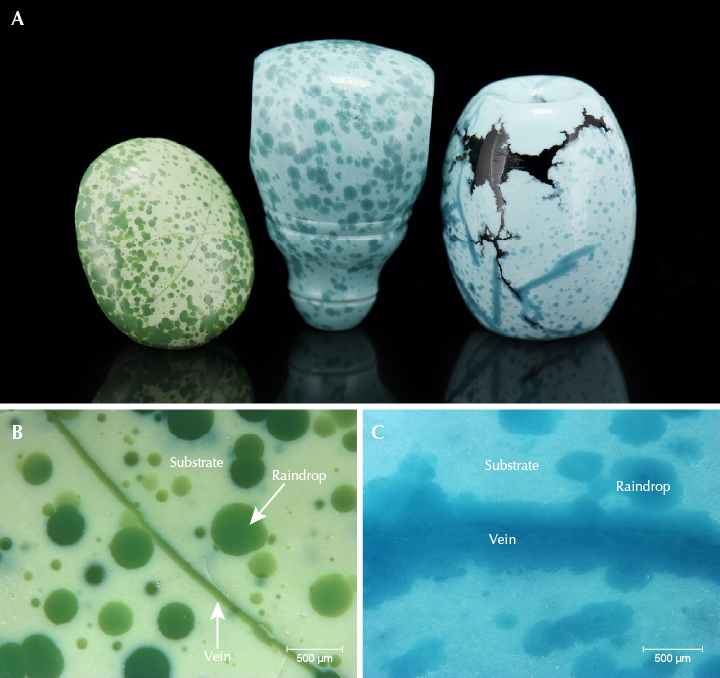
Recently, the authors discovered a particular surface pattern of turquoise (figure 3, A–C) in the Hubei market. Material with this pattern displays blue and blue-green color spots resembling raindrops, occasionally accompanied by veins (figure 3, B and C). This pattern is called “raindrop” turquoise in the trade.
Researchers have made great effort to investigate gem turquoise’s gemological and mineralogical characteristics (Abdu et al., 2011; Chen et al., 2012; Čejka et al., 2015; Rossi et al., 2017), color origin (Zhang et al., 1982; Luan et al., 2004; Reddy et al., 2006), and concentration of trace elements and rare earth elements (Wang et al., 2007; She et al., 2009; He et al., 2011; Rossi et al., 2017; Shirdam and Aslani, 2017). Additionally, the identification characteristics of treated and imitation turquoise have drawn many researchers’ attention (Moe et al., 2007; Krzemnicki et al., 2011; Bernardino et al., 2016; Schwarzinger and Schwarzinger, 2017; Xu and Di, 2018; Liu et al., 2019b). However, previous research has paid little attention to this unique raindrop pattern. The authors collected samples displaying this pattern to investigate their gemological and mineralogical characteristics.
MATERIALS AND METHODS
Specimens. Three representative specimens of raindrop turquoise were collected from the Hubei market, chosen for the color of the raindrops and the presence of veins. Local gem dealers informed the authors that the raindrop turquoise was mined in Zhushan. Specimens B-1 and B-2 were medium greenish blue and blue, respectively, while specimen B-3 was multicolored, including yellowish green, brownish yellow, and brownish red (figure 4). Specimens B-2 and B-3 contained veins in addition to raindrops, whereas specimen B-1 contained only raindrops.
Standard Gemological Testing. Specific gravity of the three specimens was determined hydrostatically. All three specimens were tested for fluorescence reactions under short-wave (254 nm) and long-wave (365 nm) UV. Microscopic observations were performed with a Leica M205A at the Gemmological Institute, China University of Geosciences, Wuhan.
X-Ray Diffraction (XRD). XRD analysis was performed on a micro X-ray diffractometer (Rigaku Rapid IIR) using a collimator 0.1 mm in diameter and Cu-Kα radiation at a voltage of 40 kV and current of 250 mA with a scan step size of 1°/second. The XRD data obtained was analyzed by MDI Jade5.0 software (Materials Data, Inc., Livermore, California). Micro XRD is a nondestructive technique to characterize a mineral’s crystalline structure for phase identification and quantification. Each mineral has its own characteristic diffraction angles and intensities, and the microstructural parameters can be provided by interpretation of the XRD pattern (Lavina et al., 2014).
Electron Probe Micro-Analyzer. Backscattered electron (BSE) imaging and electron probe micro-analysis (EPMA) were carried out by a JEOL JXA-8230 on differently colored areas of two specimens (B-2 and B-3). BSE imaging can reveal differences in the components according to the brightness displayed, since the contrast is determined by the mean atomic number Z or chemical composition of the studied sample. It can also display the topographical contrast, but its resolution is poorer than that of secondary electron images. Thus, EPMA was performed and BSE images were generated to investigate the composition variation of the raindrops and substrates. The operating conditions were: 15 kV accelerating voltage, 20 nA cup current, and a 1-micron beam diameter. A series of natural and synthetic standards was utilized for calibration (i.e., apatite for P, magnetite for Fe, orthoclase for Si and K, pyrope for Al and Mg, diopside for Ca, jadeite for Na, sphalerite for Zn, and chalcopyrite for Cu). Raw X-ray intensities were corrected using a ZAF algorithm (Schiffman et al., 2013). Compositional ranges and mean values of the tested substrates, raindrops, and veins were reported.
Spectroscopy. Micro-Raman spectroscopy (Bruker Optics Senterra R200L) was utilized with a 532 nm laser, an aperture of 50 μm, and spectral resolution of 9–15 cm–1. The laser power was 20 mW, and 10 scans were set with a 5 s integration time for each scan. Baseline correction was performed with OPUS spectroscopic software (Wartewig, 2003). Raman spectra were normalized to the intensity of the ~1041 cm–1 band. Fourier-transform infrared (FTIR) spectra were recorded in the 400–4000 cm–1 range by a Bruker Optics Hyperion 3000 micro-infrared spectrometer with 64 scans and 4 cm–1 spectral resolution. Data were smoothed and Kramers-Kronig transformed using OPUS spectroscopic software. FTIR spectra were normalized to ~1112 cm–1. Micro-ultraviolet-visible spectroscopy (Jasco MSV-5200) was performed on different color areas using an aperture of 50 μm, medium response, and a scan speed of 200 nm/min with the photometric mode of %R. The UV-Vis and NIR bandwidths were 5.0 nm and 20.0 nm, respectively. Spectra were carried out from 200 to 850 nm with a data interval of 0.2 nm.
Laser Ablation–Inductively Coupled Plasma–Mass Spectrometry (LA-ICP-MS). Some color-causing transition metal and other trace elements were analyzed by LA-ICP-MS (Agilent 7700e) combined with a GeolasPro laser ablation system consisting of a COMPexPro 102 ArF excimer laser (wavelength of 193 nm and maximum energy of 200 mJ) and a MicroLas optical system. Analytical conditions were as follows: a 44 μm diameter laser spot size, laser frequency of 6 Hz, 80 mJ laser energy, and an energy density of 5.5 J/cm2. NIST glass standard SRM 610 and USGS glass standards BHVO-2G, BCR-2G, and BIR-1G were used for external standardization. Due to the lack of a phosphate standard, a specimen of turquoise, the element homogeneity and stability of which was evaluated, was selected as a measurement standard (not a calibration standard) to monitor the drift of the instrument and ensure the quality of the data in the whole experiment.
RESULTS
Gemological Properties. The SG values of the three specimens ranged from 2.59 to 2.67 (table 1). The substrates of the specimens were all opaque, while the raindrops and veins appeared slightly translucent. The luster of the raindrops was glassy, while that of the substrate was waxy. However, the luster of the brownish yellow raindrops and substrate was earthy (dull) in this study. All three specimens exhibited medium to strong yellowish green fluorescence under long-wave UV radiation but weak yellowish green fluorescence under short-wave UV. In addition, the scratch hardness of the raindrops and veins was relatively higher than that of the substrates.

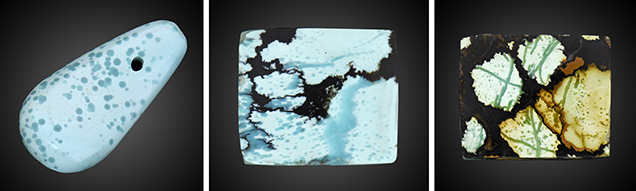
Morphological Characteristics. Most of the saturated raindrops of the turquoise specimens were isolated or in clusters. The raindrops displayed approximately round, elliptical, and hexagonal shapes under magnification (figure 5, A–C), ranging from 0.1 to 0.8 mm in length. The boundaries between raindrops and lighter-colored substrates were clear. Furthermore, the saturated veins with different sizes (0.4–2.8 mm in width) occurred in specimens B-2 and B-3 (figure 5, D–F). The veins were typically curved but sometimes nearly straight. The appearance of the veins and raindrops was extremely similar in terms of color, luster, and transparency. When one vein was interspersed by the other, they formed an “X” or “Y” shape (figure 5, E–F). The veins often had a whitish crack at the center (figure 5F, inset). In addition, black irregular veins and patches, often the primary indications of turquoise from around Hubei Province, were noticeable in specimens B-2 and B-3 (again, see figure 4).
X-Ray Diffraction. All specimens were identified as predominantly turquoise by the XRD patterns of the substrates. However, the diffraction patterns of the veins and raindrops had some differences from those of the substrates. The diffraction patterns of the veins and raindrops showed additional diffraction lines that were easy to distinguish from those of turquoise, especially in a vein of sample B-3 (figure 6). These strong lines aligned well with the diffraction lines of the mineral fluorapatite (http://rruff.info/R050529). Therefore, the XRD patterns demonstrated that the veins and raindrops were both composed of turquoise and fluorapatite. The intensity of the fluorapatite diffraction lines varied when XRD was performed on different areas of the veins and raindrops, indicating that their relative proportions of turquoise and fluorapatite also varied.

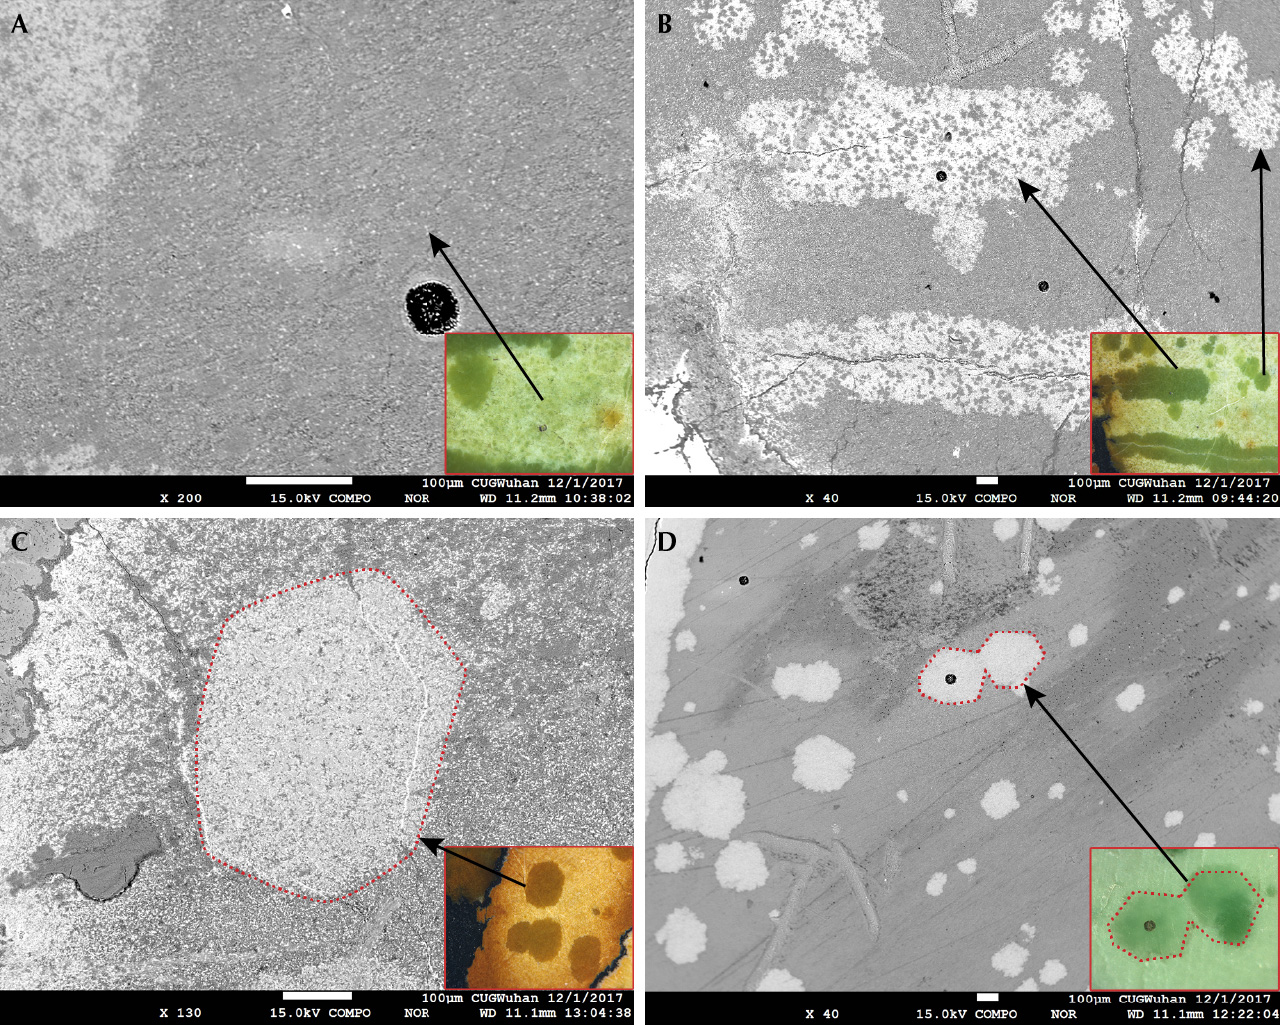
Backscattered Electron Imaging. The substrates were dark overall but showed tiny bright grains when examined under high-contrast BSE imaging (figure 7A). However, the raindrops and veins (figure 7B) tended to be brighter than the substrates in specimens B-2 and B-3. There were still numerous small dark grains unevenly distributed in the raindrops and veins (figure 7B), and the gray value of these dark grains was similar to that of the substrates. Meanwhile, some individual or adjacent raindrops were approximately hexagonal in shape, similar to the habit of apatite, under high-contrast BSE imaging (figure 7, C and D). The difference in gray value between the raindrops and the substrates revealed a difference in their mineral phases. The gray values of the raindrops and veins were comparable, indicating a similar chemical composition.
Chemical Composition. Quantitative chemical compositions of the substrates, raindrops, and veins, obtained by EPMA and LA-ICP-MS, are summarized below and in tables 2 and 3, respectively.


Substrates. The major components of the substrates (the blue, yellowish green, brownish yellow, and light green areas in samples B-2 and B-3) were Al2O3 (27.11–37.981 wt.%), P2O5 (26.446–31.791 wt.%), and CuO (5.615–6.636 wt.%). The real content of major components was slightly inconsistent with those of ideal turquoise, which has a chemical formula of [CuAl6(PO4)4(OH)8•4H2O] (Foord and Taggart, 1998; Čejka et al., 2015). The substrates also contained SiO2 and FeO, in addition to Al2O3, P2O5, and CuO. The contents of SiO2 and FeO were relatively high in several of the testing areas, ranging from 0.252 wt.% to 14.288 wt.% for SiO2 and from 2.274 wt.% to 19.586 wt.% for FeO. The enrichment of SiO2 in the substrates of all samples might result from the substitution of P by Si in the turquoise structure and the existence of clay minerals (e.g., kaolinite). Clay minerals often occur together with turquoise (Tu, 1996; Huang, 2003; Abdu et al., 2011). Trace element data of the substrates demonstrated that V (86.0–810 ppm), Ni (44.0–1458 ppm), and Mo (0.71–2124 ppm) had a wide range of concentrations (table 3). The brownish yellow substrate resulted in the high contents of V (810 ppm), Ni (1458 ppm), and Mo (2124 ppm). The substrates contained abundant Ba (570–626 ppm) but low Sr (9.61–17.2 ppm) and U (4.53–16.6 ppm).
Raindrops and Veins. Conversely, the values of Al2O3 (24.058–27.919 wt.%) and SiO2 (0.864–4.000 wt.%) were lower in the raindrops than in the substrates. The CuO value had similar ranges in the raindrops and substrates. The raindrops had significantly higher contents of CaO (8.487–14.747 wt.%) and P2O5 (33.096–34.813 wt.%) than the substrates, as well as enriched F (0.584–0.753 wt.%), a consequence of the presence of fluorapatite [Ca5(PO4)3F]. And the FeO content, from a minimum value of 1.694 wt.% to a maximum of 4.481 wt.%, was correlated to the color of the raindrops. The major components of the veins were essentially identical to that of the raindrops. Compared to the substrates, the raindrops and veins had lower concentrations of Ni (13.9–408 ppm) and Mo (2.33–532 ppm), but higher concentrations of Sr (98.8–478 ppm), Ba (782–945 ppm), and U (30.2–187 ppm).
Raman and FTIR Spectroscopy. Although the characteristic bands of turquoise related to phosphate, hydroxyl, and water units (Čejka et al., 2015) could be observed in the Raman and FTIR spectra of raindrops, veins, and substrates, there were still significant differences.
Raman Peak at Approximately 966 cm–1 and Shoulder at 1070 cm–1. A strong and sharp peak at 965–968 cm–1 in the Raman spectra of the raindrops and veins (figure 8) has not been reported in previous studies of turquoise. Based on the XRD and EPMA results, the tested spectra were compared with the spectra of fluorapatite from the RRUFF database (http://rruff.info/R050529) for peak assignment and matched well. This significant peak was attributed to the ν1 symmetrical stretching vibration of the phosphate group (PO4)3– in the fluorapatite structure (Penel et al., 1997). The ν4 (PO4)3– bending vibrations of fluorapatite (Penel et al., 1997), which occurred at approximately 594 cm–1, strongly overlapped with the band at 593 cm–1 related to the (PO4)3– group in turquoise (Frost et al., 2006; Čejka et al., 2015).

Another important feature in the Raman spectra of the raindrops and veins was that the band at ~1041 cm–1 was more asymmetric than that of the substrates (figure 8). The peak at 1041 cm–1, assigned to the ν1 (PO4)3– symmetric stretching vibrations (Čejka et al., 2015), appeared to consist of more than one band and had a weak shoulder at 1070 cm–1. This shoulder was assigned to ν1 carbonate bands associated with the substitution of the (PO4)3– group by (CO3)2– in the fluorapatite structure (Awonusi et al., 2007). With increasing CaO, the relative intensity of the bands at 1070 and ~966 cm–1 became stronger (figure 8). For example, when the CaO value in a vein reached 14.354 wt.% and the F value was high (up to 0.878 wt.%), the Raman spectrum showed a distinct shoulder at 1070 cm–1. The band at 966 cm–1 was even more intense than the band at 1041 cm–1, implying a high concentration of fluorapatite in this vein. Furthermore, the Raman spectra of the raindrops and veins had a slightly broader band, shifting at the 420–429 cm–1 region in different analyzed areas. This band was unresolved due to a combination of the ν2 (PO4)3– bending vibrations at 432 cm–1 (Penel et al., 1997) for fluorapatite and 421 cm–1 for turquoise (Chen et al., 2009; Čejka et al., 2015), respectively. The position and shape of this band, a consequence of the same (PO4)3– unit in the structure of both fluorapatite and turquoise, also appeared to be linked to the value of CaO.
In conclusion, the distinguishing features of the Raman spectra in the raindrops and veins were the presence of the sharp peak at 965–968 cm–1 and a weak but significant shoulder at 1070 cm–1, both of which became more intense with increasing CaO when compared to the bands at ~1041 cm–1.
Double FTIR Absorption Bands Near 1460 and 1430 cm–1. The FTIR absorption spectra of veins, raindrops, and substrates were similar, all characterized by the stretching and bending vibrations of water molecules, hydroxyl ions, and tetrahedral phosphate (Chen and Qi, 2007; Čejka et al., 2015). One significant exception was the occurrence of additional double weak bands near 1460 and 1430 cm–1 in the FTIR absorption spectra of all raindrops and veins but not in the substrates (figure 9). Similar double weak bands were also observed in two altered turquoise samples mixed with calcium carbonate, as in the study of Abdu et al. (2011). However, the double weak bands near 1460 and 1430 cm–1 in this study were assigned to ν3 (CO3)2, and the asymmetric stretching vibration was due to the substitution of the (PO4)3– group by (CO3)2– in the fluorapatite structure (Fleet, 2009). Other very weak bands at 962, 870, and 608 cm–1 related to ν1 (PO4)3– symmetrical stretching vibration, ν4 (PO4)3– bending vibration (Penel et al., 1997), and ν2 (CO3)2– bending vibration (Fleet, 2009) of fluorapatite, respectively, were also observed in the vein of sample B-3.

Spectral Comparisons Between Raindrops (Veins) and Substrates of Different Colors. In the visible range (figure 10), the absorption from the color-causing elements of turquoise was different for each color. For a specific color, the absorption bands of the raindrops (veins) and substrates had approximately similar positions and shapes. The most significant difference between them was the overall weaker reflectance intensity of the raindrops (veins), corresponding to their deeper color. The two combined effects caused the raindrops (veins) and substrates to vary in saturation while always being consistent in hue.

DISCUSSION
Color Origin of Brownish Yellow Raindrops and Substrates. The amounts of Fe, V, and Ni analyzed by LA-ICP-MS were higher in the brownish yellow raindrop and substrate than in the blue and yellowish green raindrops and substrates (figure 11). Previous work on color origin concluded that the brownish yellow color of turquoise with high Fe and low Al2O3 content was associated with the substitution of Al3+ by Fe3+ in the turquoise structure (Zhang et al., 1982; Luan et al., 2004). However, the authors assumed that the existence of secondary iron-bearing minerals in the pores was responsible for the brownish yellow tone. As expected, significant spectral signals for iron minerals only occurred in the Raman spectra of brownish yellow raindrops and substrates.

For instance, when the value of FeO increased to 4.481 wt.% analyzed by EPMA in brownish yellow raindrops, its Raman spectra (figure 12) showed strong bands centered at 416 cm–1, which enveloped the bands in the 420–429 cm–1 range, and was even stronger than the peaks at 1043 and 968 cm–1. Similarly, a strong band at 411 cm–1, accompanied by bands at 309 and 558 cm–1, was observed in the Raman spectrum of brownish yellow substrate due to rich Fe (FeO up to 19.586 wt.% analyzed by EPMA). But other bands of turquoise in the Raman spectrum of the brownish yellow substrate were very weak, such as the ones at 1042 and 3469 cm–1. The band at 411–416 cm–1 was related to goethite (Hanesch, 2009; Liu, 2018). It was very distinct in the Raman spectra of the brownish yellow raindrops and substrates, suggesting the existence of numerous secondary iron minerals in the pores. The brownish yellow or red hue of the raindrops and substrates was presumably generated by the alteration of secondary iron minerals.

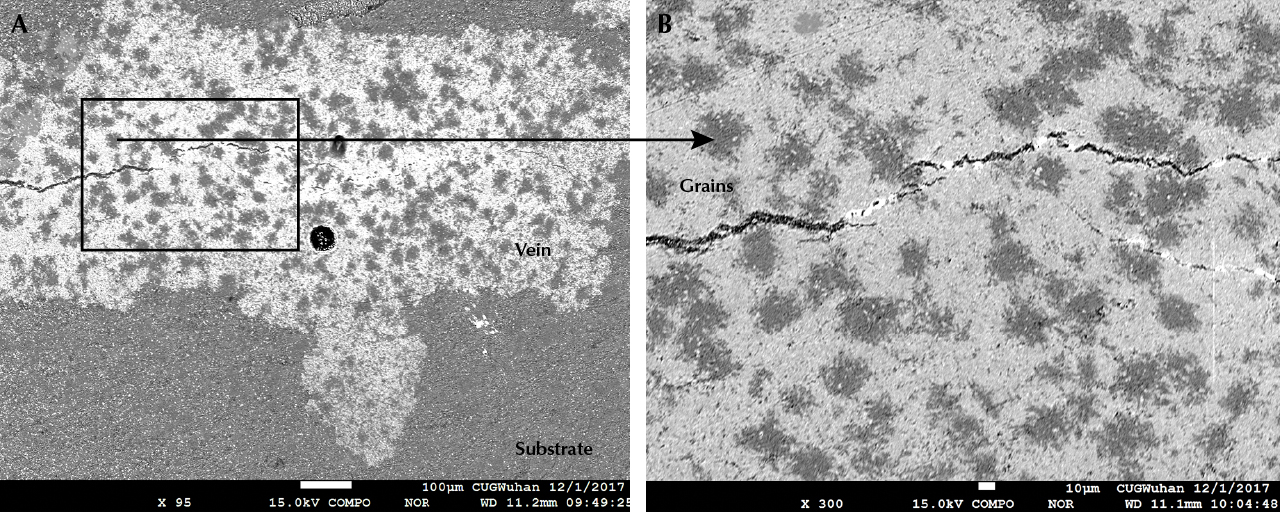
Discovery of Nearly Pure Fluorapatite and Turquoise in the Raindrops and Veins. Interestingly, a bright and narrow line (~20 μm in width) was observed in the middle of the vein when specimen B-3 was observed under high-contrast BSE imaging (figure 13, inset). And its Raman spectrum showed strong characteristics of fluorapatite (figure 13). However, only very weak bands at 3455, 3474, and 3499 cm–1, were assigned to the ν(OH) stretching vibrations of turquoise, with weaker bands over the 3000–3300 cm–1 range attributed to the ν(OH) stretching vibrations of water molecules in turquoise. In addition, the bright and narrow line mainly consisted of CaO, P2O5, and F with minor Al2O3, CuO, and FeO, which were consistent with the Raman results. The mean values for CaO (up to 48.159 wt.%) and F (up to 1.988 wt.%) analyzed from the bright and narrow line were notably higher than those of other areas (table 4). The P2O5 content was 28.323–28.975 wt.%, while the contents of other important elements including Al, Cu, and Fe were all below 0.640 wt.% and greatly distinct from the substrates, raindrops, and veins.


Hence, both the Raman spectra and the chemical compositions proved that the bright and narrow line was indeed nearly pure fluorapatite. And there were at least three mineral assemblages (turquoise, fluorapatite, and a mixture of the two) occurring simultaneously in the raindrop turquoise. Yang et al. (2003) and Hull et al. (2008) discovered apatite inclusions in turquoise from Ma’anshan in Anhui Province and the Castilian mine in New Mexico, respectively. Additionally, fluorapatite also occurred in turquoise from Nishapur, Iran (Rossi et al., 2017). However, this study was the first to find fluorapatite coexisting with turquoise from Hubei Province, forming a distinct raindrop pattern. Previous studies have made it clear that a turquoise-blue material, odontolite, which was also fluorapatite [Ca5(PO4)3F], was an occasional turquoise imitation used in art objects or historical jewels and previously considered turquoise (Reiche et al., 2001; Krzemnicki et al., 2011).
Moreover, numerous small dark grains were distributed in the raindrops and veins under high-contrast BSE imaging (figure 14). According to the EPMA results, their major chemical compositions were Al2O3 (38.25–39.566 wt.%), P2O5 (30.144–31.273 wt.%), CuO (6.464–6.896 wt.%), and FeO (2.051–2.613 wt.%), with minor contents of SiO2, CaO, and F (table 4), corresponding to turquoise.
Speculation about the Formation Mechanism of Raindrop Turquoise. The raindrops and veins may be the byproducts of weathering and leaching. As suggested by Jiang et al. (1983) and Tu (1996), the turquoise deposits in Shaanxi and Hubei areas resulted from leaching and mineralization. The mineralization of turquoise was controlled by tectonic movement and could be achieved through weathering, erosion, transportation, leaching, and deposition. Most of the turquoise orebodies occur in fissures and pores of carbon-bearing silicic rocks as veinlets, lentoid and massive (Tu, 1996, 1997a, b). Rainwater is active along tectonic fractures, creating favorable conditions for leaching and mineralization. And it must dissolve the ore-forming elements of Cu, P, and Al in bedrock and host rocks. Turquoise tends to be deposited in fracture zones under the high Eh and low pH environment (Tu, 1997a).
When phosphorites are exposed to an acidic environment, their components such as carbonate can be easily dissolved. Then, the secondary apatite mineral can be formed (Huang, 1991; Liu et al., 1994; Tian, 1995). Moreover, the original phosphate minerals were dissolved and migrated after strong weathering and leaching. The secondary mineral fluorapatite can be redeposited under appropriate conditions. And it was usually accompanied by some supergene weathered minerals, such as wavellite, variscite, woodhouseite, and limonite (Liu et al., 1994). These mineral assemblages also occurred in the turquoise deposits of Hubei and Shaanxi Province, indicating secondary genesis (Jiang et al., 1983). The formation and enrichment of fluorapatite bore similarities to the turquoise from Hubei.
Accordingly, the formation mechanism of raindrop turquoise can be speculated as follows: The freely soluble substances of the carbonaceous phosphate rocks were lost under acidic conditions, while the relatively insoluble phosphate was left in-situ and then formed the mixtures of fluorapatite and turquoise. On the other hand, after the phosphate nodules and phosphate minerals of the ore-bearing rock series were strongly weathered and leached, they experienced dissolution, migration, and redeposition (Tu, 1996, 1997a). The secondary phosphate enriched, and then solutions formed the mixed aggregates of turquoise and apatite under appropriate physical and chemical conditions. The similar formation of turquoise and apatite was referred to by Jiang et al. (1983) and Tian (1995), respectively. After the phosphate solutions migrated, they might have been precipitated in the pores and recrystallized as raindrops. They would appear as veins if the phosphate solutions were precipitated in the cracks or fissures. The formed veins could be ruptured by tectonic activities, then providing space for pure apatite crystallizing. The pure apatite filling in the veins was the last phase of mineralization in raindrop turquoise.
In addition, the approximately hexagonal shapes of the raindrops may have been determined by the well-developed hexagonal crystal shapes of apatite. In the Ma’anshan areas of Anhui Province, there is a rare variety of pseudomorphic turquoise (figure 15) of metasomatic origin (Yue, 1995). In these specimens, the primary apatite prepared the matrix for the formation of pseudomorphic turquoise. And the strong alteration of the metallogenic mother rock is beneficial to the participation of surface water (Yue, 1995). Under the actions of alkalescent surface solution containing copper, aluminum, iron, and other elements, apatite metasomatism occurs, generating the pseudomorphic turquoise that inherits the original shape of apatite. Similarly, some raindrops adopt the hexagonal habit of the apatite crystals.
CONCLUSIONS
The saturated raindrops and veins of turquoise from Hubei Province (figure 16) were characterized by the presence of both turquoise and fluorapatite. In addition to Al2O3, P2O5, CuO, FeO, and SiO2, the raindrops and veins had other major chemical compositions of CaO and F differing from the substrates. Raman spectra of raindrops and veins showed intense peaks at ~966 cm–1 related to the ν1 symmetrical stretching vibration of the phosphate group (PO4)3– in fluorapatite. Moreover, the bands at 1070 cm–1 for Raman spectra and double weak bands near 1460 and 1430 cm–1 for FTIR spectra attributed to (CO3)2– confirmed that (PO4)3– was replaced by (CO3)2– in the fluorapatite structure. The brownish yellow color present in some of the raindrop turquoise was caused by goethite. The raindrops and veins were potentially the byproducts of weathering and leaching because of similar enrichment and formation of fluorapatite and turquoise. Pure apatite found in the veins formed after the raindrops and veins.