Social Media Statistics (How Many People Use Social Media?)
Social media is a global phenomenon unlike any other.
As of this year, over half the world’s population has social media presence—a mighty feat considering the technology has only been around a few short decades.
But what does the current social media landscape look like? Exactly how many people use social media? And is there still room for further growth?
We’ve compiled a roundup of over 100 eye-opening social media statistics to answer these questions and more.
From here on out, we’ll be looking at stats on all the most popular social media platforms and revealing some incredible insights about the people who use social networks, why they use them, and how they interact with their favorite platforms.
Ready? Let’s get started!
Social media statistics (top picks)
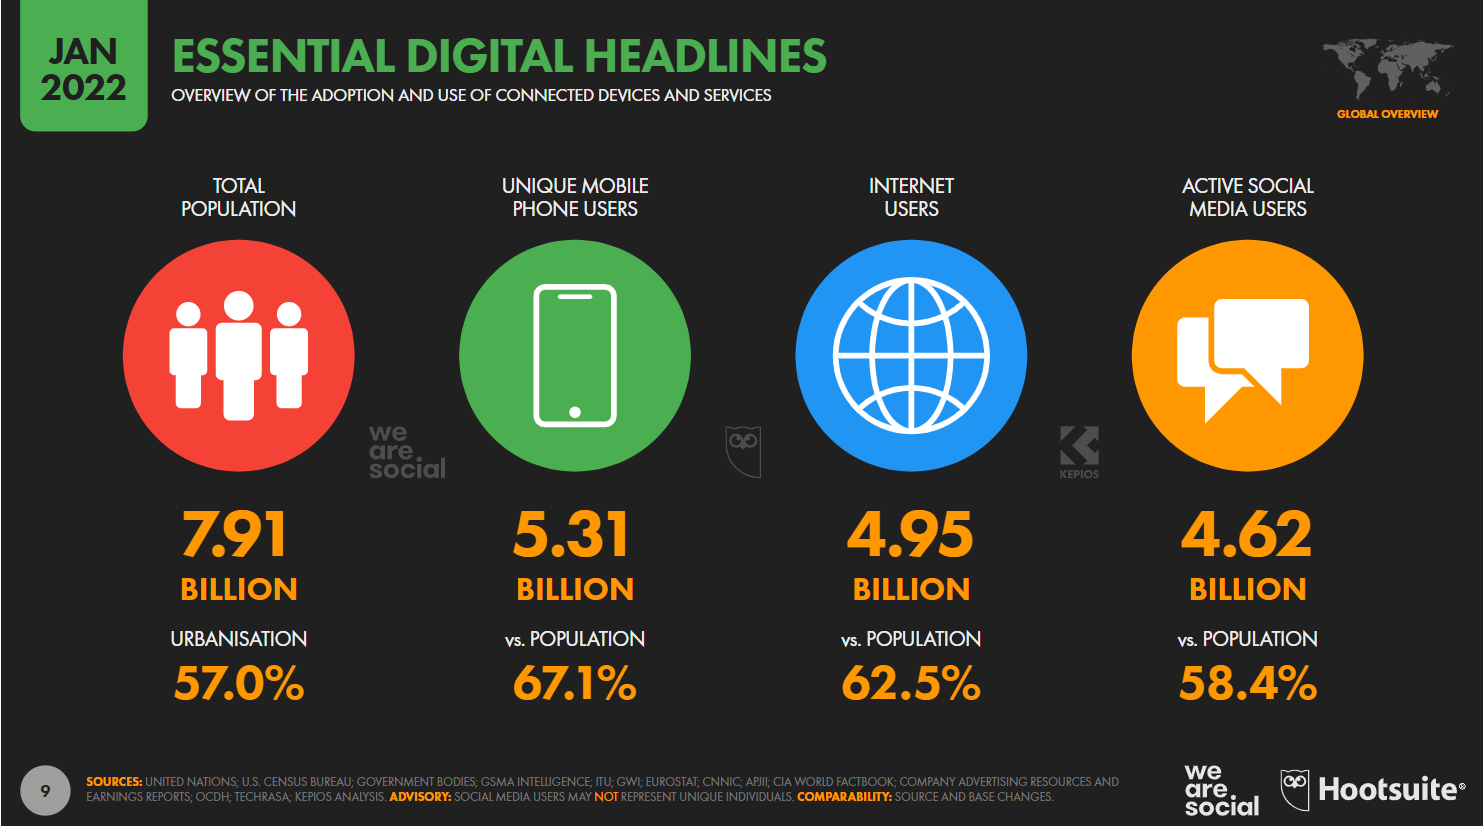
- There are 4.62 billion social media users worldwide (10.1% more than last year).
- That represents 58.4% of the global population, 93.3% of the global online population, and 74.8% of the global adult population (over 18).
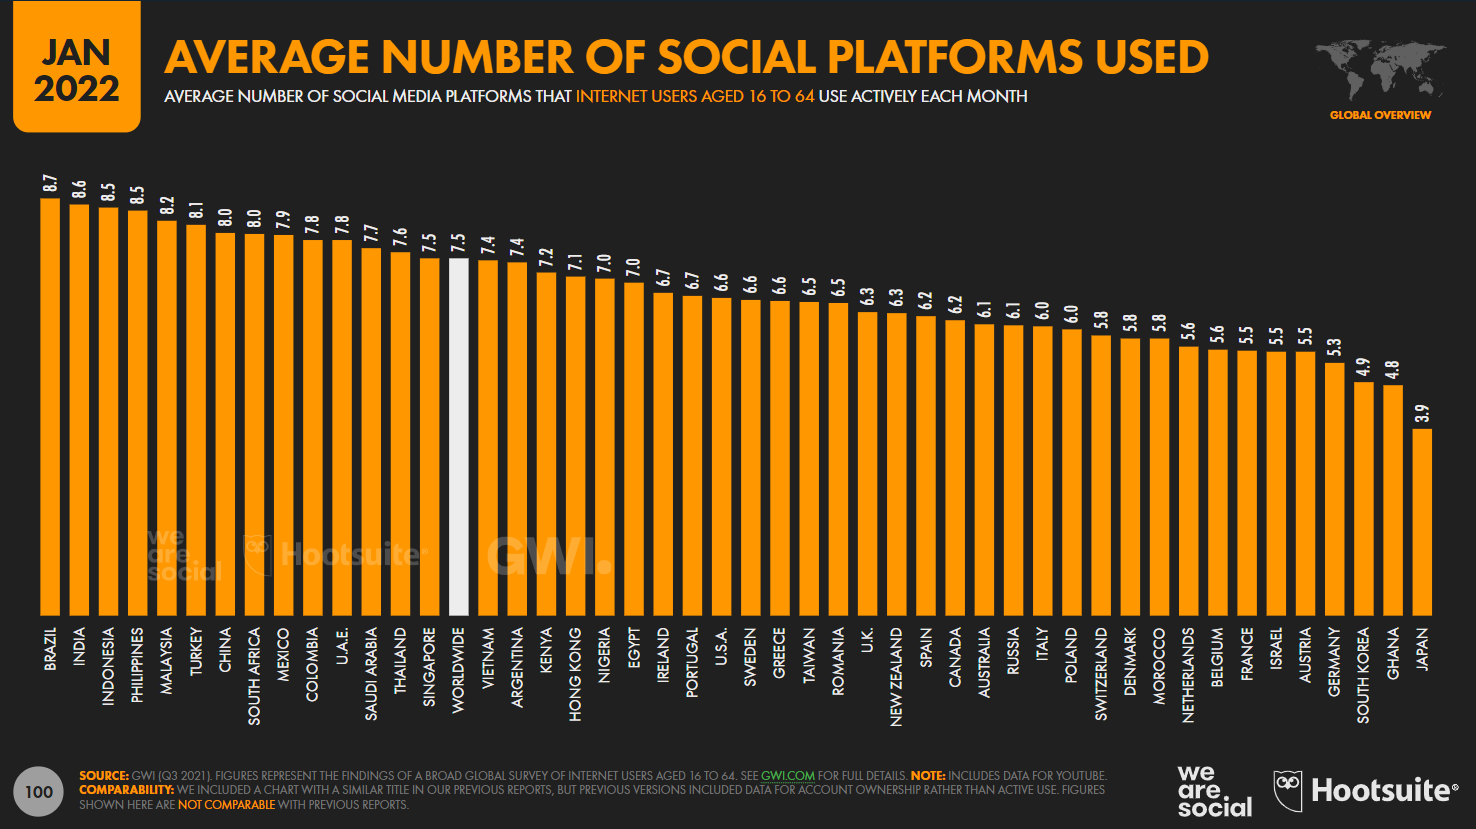
- The average person uses 7.5 social media platforms and spends 2 hours 27 minutes on social media every day.
- TikTok is the fastest growing social media network and has grown 18.3% year over year.
- Almost half of social media users say they use social media to keep in touch with their friends and family.
- China has the most social media users (1b+) but Brunei has the highest social media penetration rate (116.5%)
- Facebook is the most used social media platform with 2.9 billion users, but WhatsApp is the people’s ‘favorite’ platform.
- Facebook also earns the highest annual revenues, earning $117 billion last year
- Brands and marketers spent $153 billion on social media advertising last year.
- The top goal of social media marketing is to raise brand awareness, and engagement is the top metric that marketers track.
How many people use social media?
Approximately 4.62 billion people use social media globally. And although this meteoric figure already represents over half of the population of the earth, it’s still growing. According to the latest projections, there will be almost 6 billion social media users by 2027.
What percentage of the population uses social media?
The global population currently stands at 7.91 billion, which means 58.4% of the population uses social media.
According to projections, that figure is expected to rise to 74% by 2026 as more people worldwide get access to the internet.
There are currently only 4.95 billion global internet users, which means 93.3% of the online global population uses social media. This is arguably a more accurate representation of social media’s true global penetration rate.
It’s also interesting to note that 74.8% of the global population over 18 uses social media. Given that most social platforms have minimum age requirements, it makes sense that penetration rates would be higher when we look exclusively at the adult population.
How many accounts do social media users have?
On average, social media users have 7.5 accounts on different platforms that they log into monthly. However, this varies sharply based on age and location. Younger users are more likely to have a great number of social accounts, while older users typically have fewer.
Sources: Hootsuite, Statista4, Statista5, Hootsuite2
Social media growth rates
Although social media is already ubiquitous around the world, the number of social media users is still on the rise. Here are some social media statistics that illustrate this growth.
How fast is social media use growing?
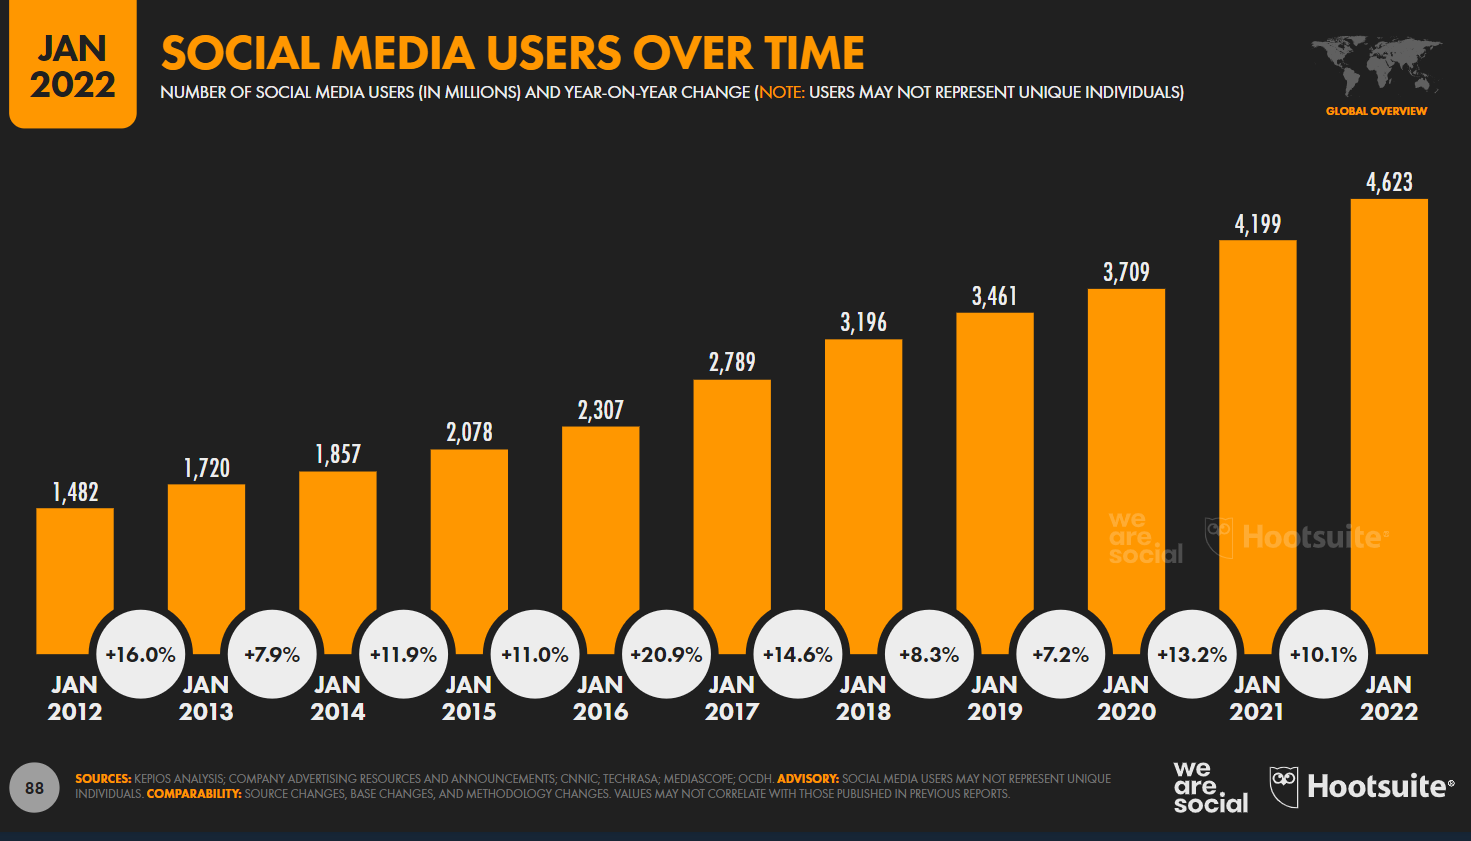
The number of social media users grew by 10.1% over the last year, and the current social media user growth rate is faster than it was pre-pandemic. There were around 420 million more social media users in 2022 compared to 2021.
Social media user growth over time (YOY change):
Here’s how the number of social media users has grown over the last decade:
- 2022 – 4.62b (+10.1%)
- 2021 – 4.20b (+13.2%)
- 2020 – 3.71b (+7.2%)
- 2019 – 3.46b (+8.3%)
- 2018 – 3.20b (+14.6%)
- 2017 – 2.79b (+20.9%)
- 2016 – 2.31b (+11%)
- 2015 – 2.08b (+11.9%)
- 2014 – 1.86b (+7.9%)
- 2013 – 1.72b (+16%)
- 2012 – 1.48b
What’s the fastest-growing social media platform?
Unsurprisingly, TikTok was the fastest-growing social media network in 2021, with a YOY growth rate of 18.3%.
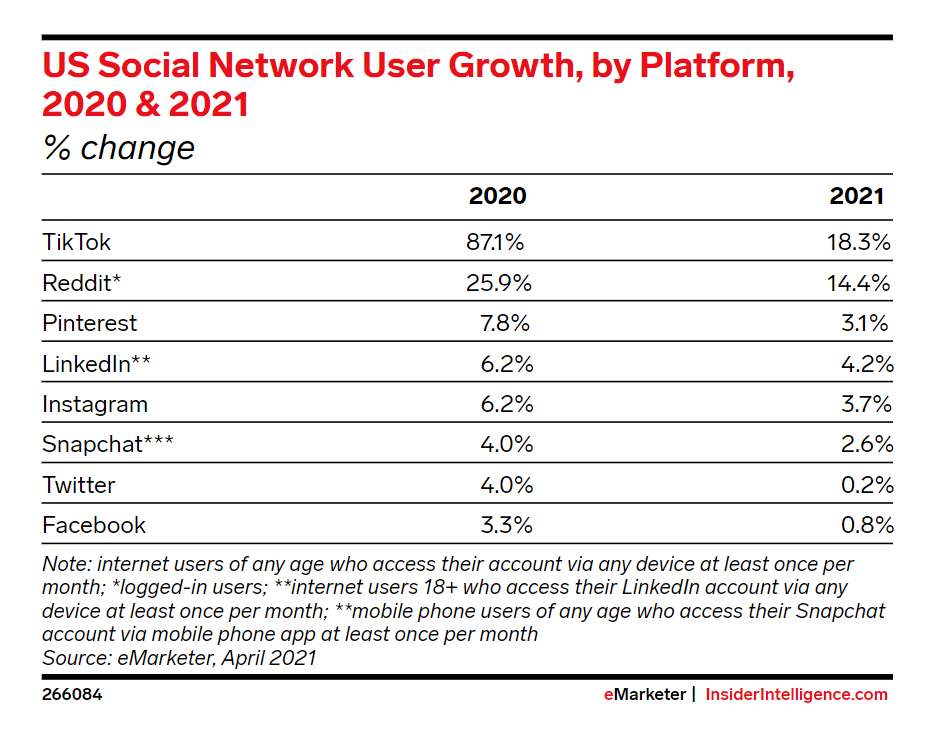
And the year before was even more impressive: The number of TikTok users grew by a mindblowing 87.1% in 2020. This meteoric growth has secured TikTok’s place in the cultural zeitgeist and it now ranks as one of the biggest social media platforms.
Its success can no doubt mainly be attributed to the obvious consumer demand for the kind of short-form video content TikTok is famous for, but its rapid growth may have also been accelerated by the global pandemic, which caused hundreds of millions of consumers to turn to new forms of digital entertainment at home.
Reddit is the second fastest-growing social media platform, with an impressive 14.4% year-over-year growth rate. Like TikTok, 2020 was an especially good year for Reddit, when its user base grew by 25.9%.
Social media user growth rate by platform (YOY):
- TikTok – 18.3%
- Reddit – 14.4%
- LinkedIn – 4.2%
- Instagram – 3.7%
- Pinterest – 3.1%
- Snapchat – 2.6%
- Facebook – 0.8%
- Twitter – 0.2%
Why do people use social media?
Connecting is very much still the heart of social media. The data shows that 47.6% of people use social media to keep in touch with their family and friends, making this the number one use case.
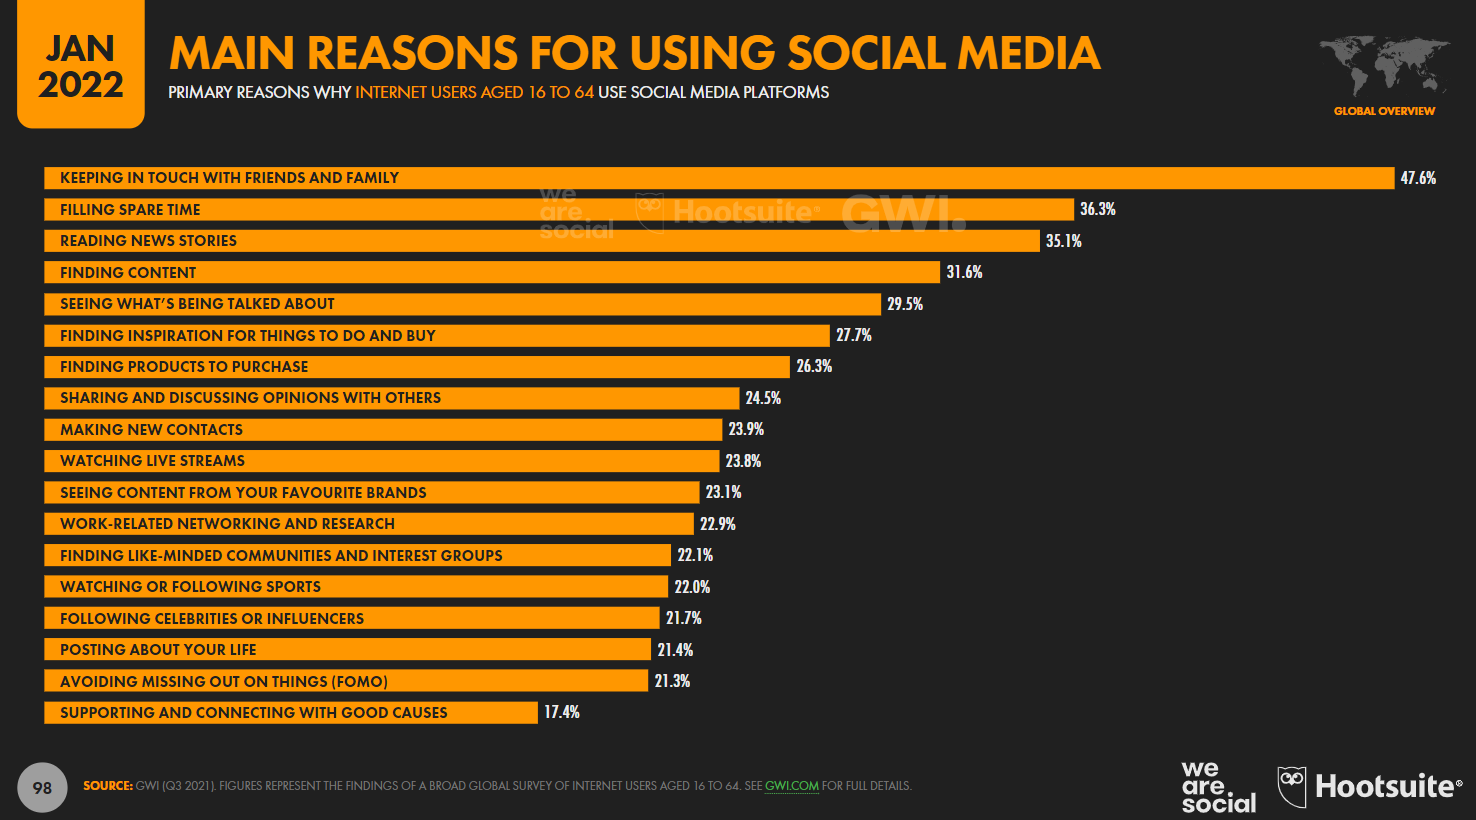
Top 10 reasons people use social media
Here are some other popular reasons people use social media, according to social media statistics from Hootsuite:
- 47.6% use social media to keep in touch with family and friends
- 36.3% use social media to fill their spare time
- 35.1% use social media to read news stories
- 31.6% use social media to find content
- 29.5% use social media to see what’s being talked about
- 27.7% use social media to find inspiration for things to do and buy
- 26.3% use social media to find products to purchase
- 24.5% use social media to share and discuss opinions with others
- 23.9% use social media to make new contacts
- 23.8% use social media to watch live streams
Top 5 reasons Gen Z use social media
Reasons for using social media tend to vary across generations. Here are the biggest reasons Gen Z use social media, according to a survey by GWI:
- 48% use it to keep in touch with friends/family
- 43% use it to fill their spare time
- 39% use it to find content
- 35% use it to see what’s trending
- 33% use it to read news stories
Top 5 reasons Baby Boomers use social media
And for comparison, here are the main reasons Baby Boomers use social media, according to the same survey:
- 54% use it to keep in touch with friends/family
- 36% use it to read news stories
- 28% use it to fill their spare time
- 21% use it to find products to purchase
- 21% use it to share/discuss opinions with others
How much time do people spend on social media?
Internet users spend 2 hours 27 minutes using social media per day, on average.
That’s an increase of 1.4% year-over-year and over 50% longer than the average time spent on social media in 2013 when it was just 1 hour 37 minutes per day.
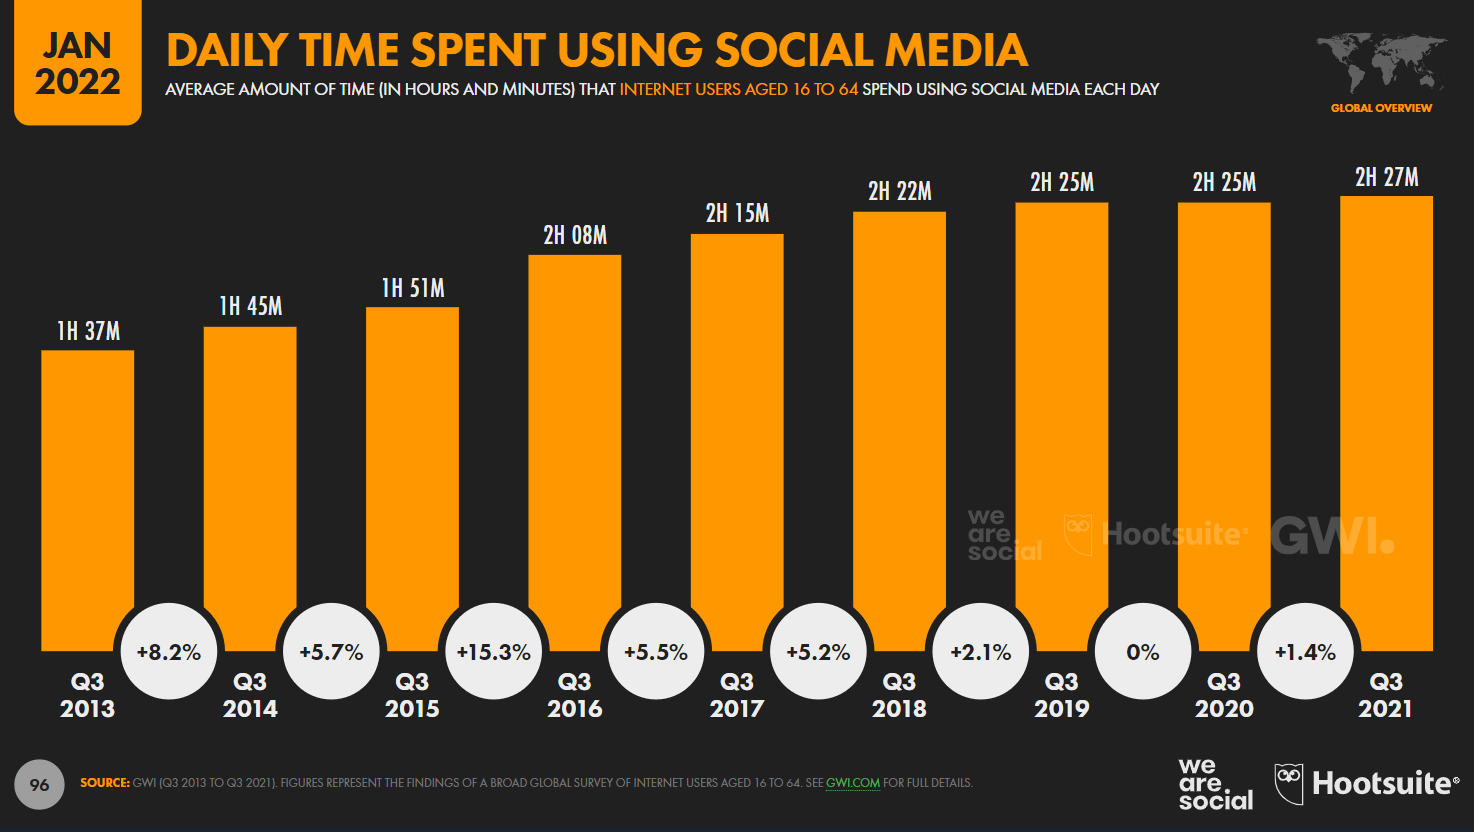
It’s also almost half an hour more than the average time spent reading press media daily, and almost an hour more than time spent listening to music streaming services. In total, people spend over a third of the total time using the internet on social media.
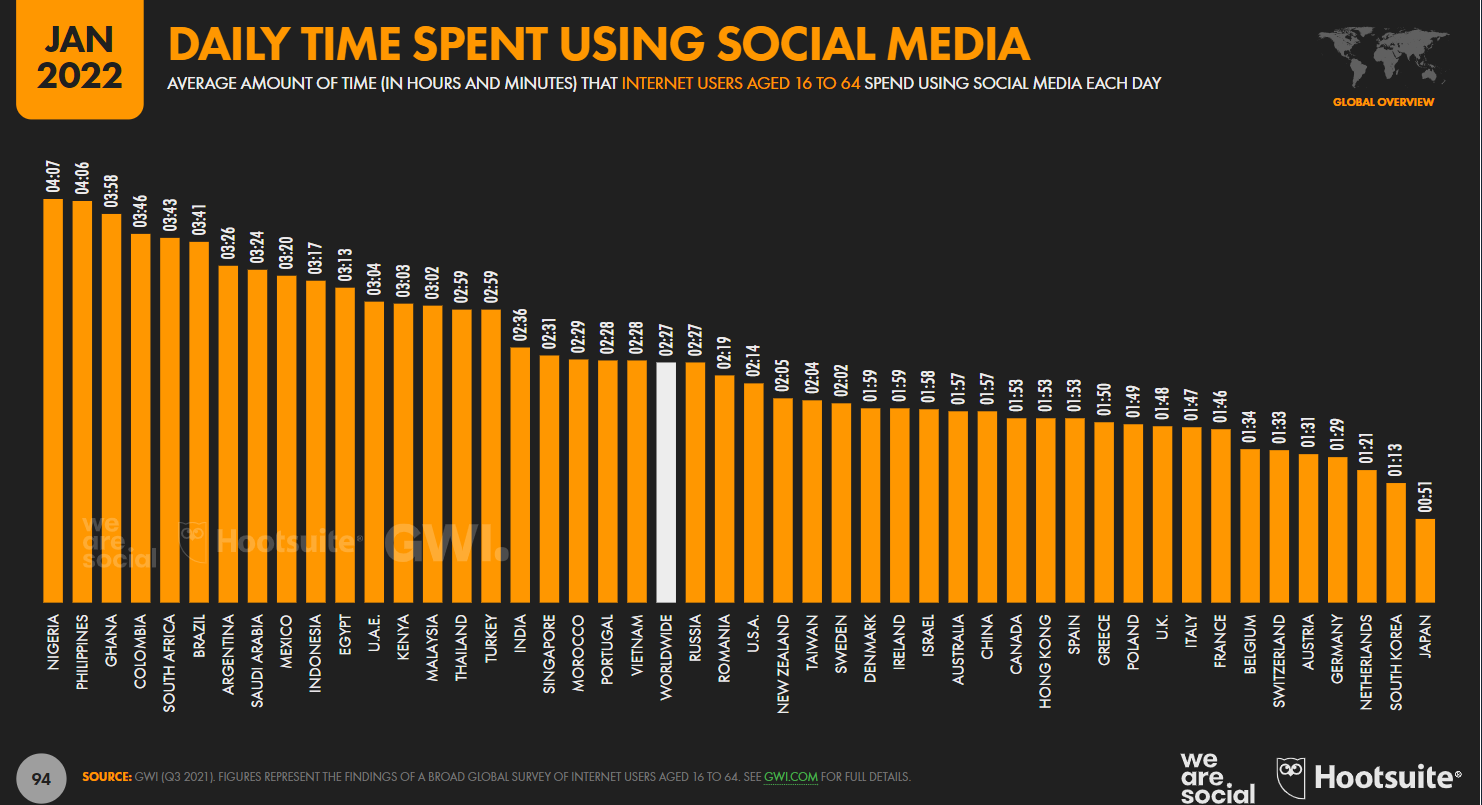
Which country spends the most time on social media?
Time spent using social media varies substantially by country. Despite having one of the lowest social media adoption rates, social media users in Nigeria spend the most time on social networks: 4 hours 7 minutes per day, on average
On the other end of the scale, people in Japan spend the least time on social media, clocking it at just 51 minutes per day, on average
And in the USA, people spend 2 hours 14 minutes using social media on average
Which generation spends the most time on social media?
Gen Z spends more time on social media than any other generation, and the amount of time users spend on social media per day seems to inversely correlate with age.
16-24-year-olds spend longer than any other age group on social media. On average, males aged between 16 and 24 spend 2 hours 43 minutes and females in the same age range spend 3 hours 13 minutes on social media per day.
55-64-year-olds spend less time on social media than any other age group. On average, males aged between 55 and 64 spend 1 hour 18 minutes and females in the same age range spend 1 hour 33 minutes on social media per day.
Which social media platform do people spend the most time on?
Users spend more time on YouTube than on any other platform. The average person spends 23.7 hours on YouTube every month.
Facebook and TikTok rank in joint second place, with the average person using these platforms for around 19.6 hours every month. WhatsApp ranked third with an average usage time of 18.6 hours per month.
Sources: Hootsuite
Social media user demographics
Next, let’s look at some social media statistics that tell us more about the people who use social networks and how usage varies across different demographics.
Social media use by gender
There are more male than female social media users. Globally, 53.9% of social media users are male, compared to 46.1% female.
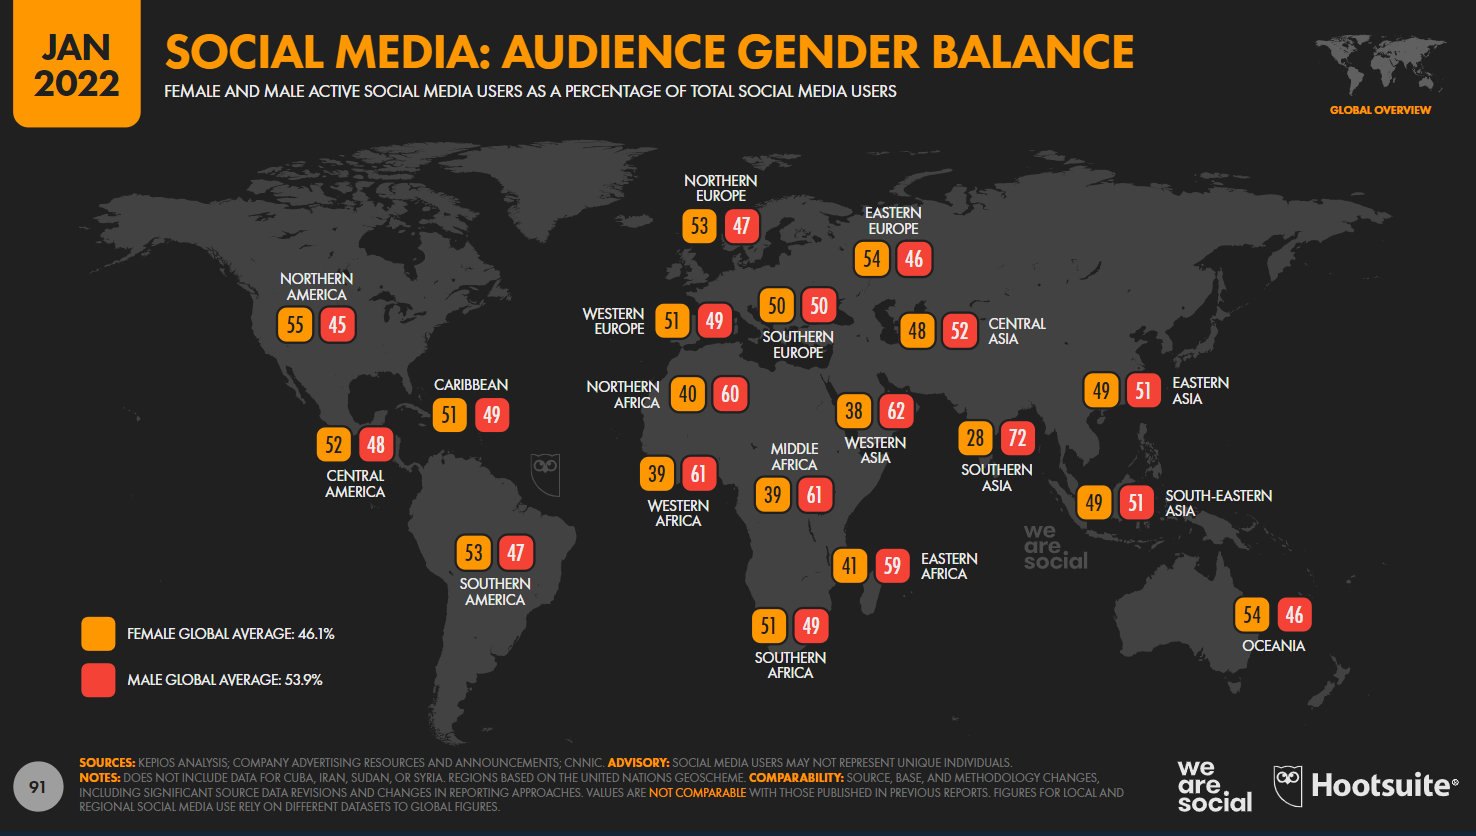
However, this varies depending on the country. There are more female social media users in the US than male, for example.
Social media use by age
The largest age group of social media users is 20-29. This age group makes up 32.2% of all social media users. Here’s a breakdown of social media use across age ranges.
- 13 to 19-year-olds – 13.1%
- 20 to 29-year-olds – 32.2%
- 30 to 39-year-olds – 22.2%
- 40 to 49-year-olds – 14.4%
- 50 to 59-year-olds – 9.8%
- 60+ year-olds – 8.4%
Sources: Hootsuite
Social media usage across the world
China has more social media users than any other country, but the data tells a different story when we factor in population sizes. North America (the region) and Brunei (the country) have the highest number of social media users as a percentage of their total population (i.e. social media penetration rate).
Which country has the most social media users?
China has the most social media users of any country, with 1.02 billion social media users as of 2022. India had the second most social media users of any country, at around 755 million. And the US ranked a distant third, with around 302 million users.
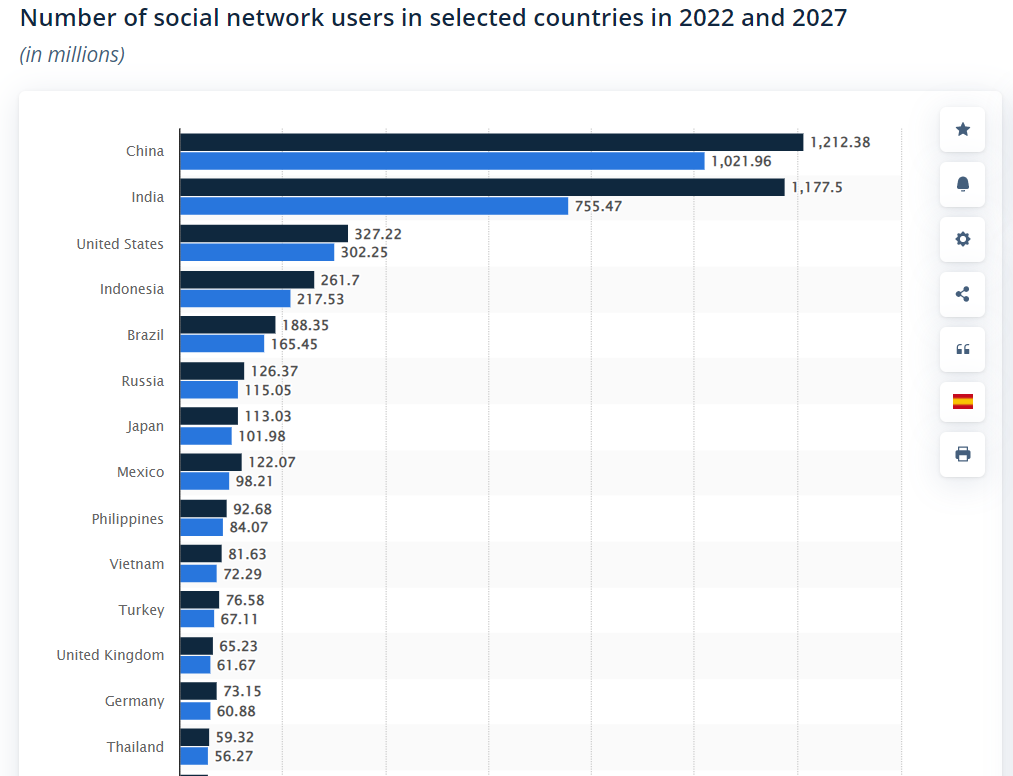
This isn’t surprising given that China, India, and the US are the first, second, and third most populous countries.
Social media penetration by country
We can calculate a country’s social media penetration rate by dividing the total number of social media users in that country by its total population. The social media penetration rate indicates how ‘popular’ social media is within a given country.
Brunei has the highest social media penetration rate of any country at 116.5%. Note that this suggests there are more social media users than citizens in Brunei, which seems nonsensical.
This statistical oddity is mostly due to duplicate and ‘fake’ social media accounts. In other words, the number of social media users in Brunei (and in other countries with penetration rates exceeding 100%) likely doesn’t represent unique individuals. Differences between census data and resident populations also contribute to the high penetration rate.
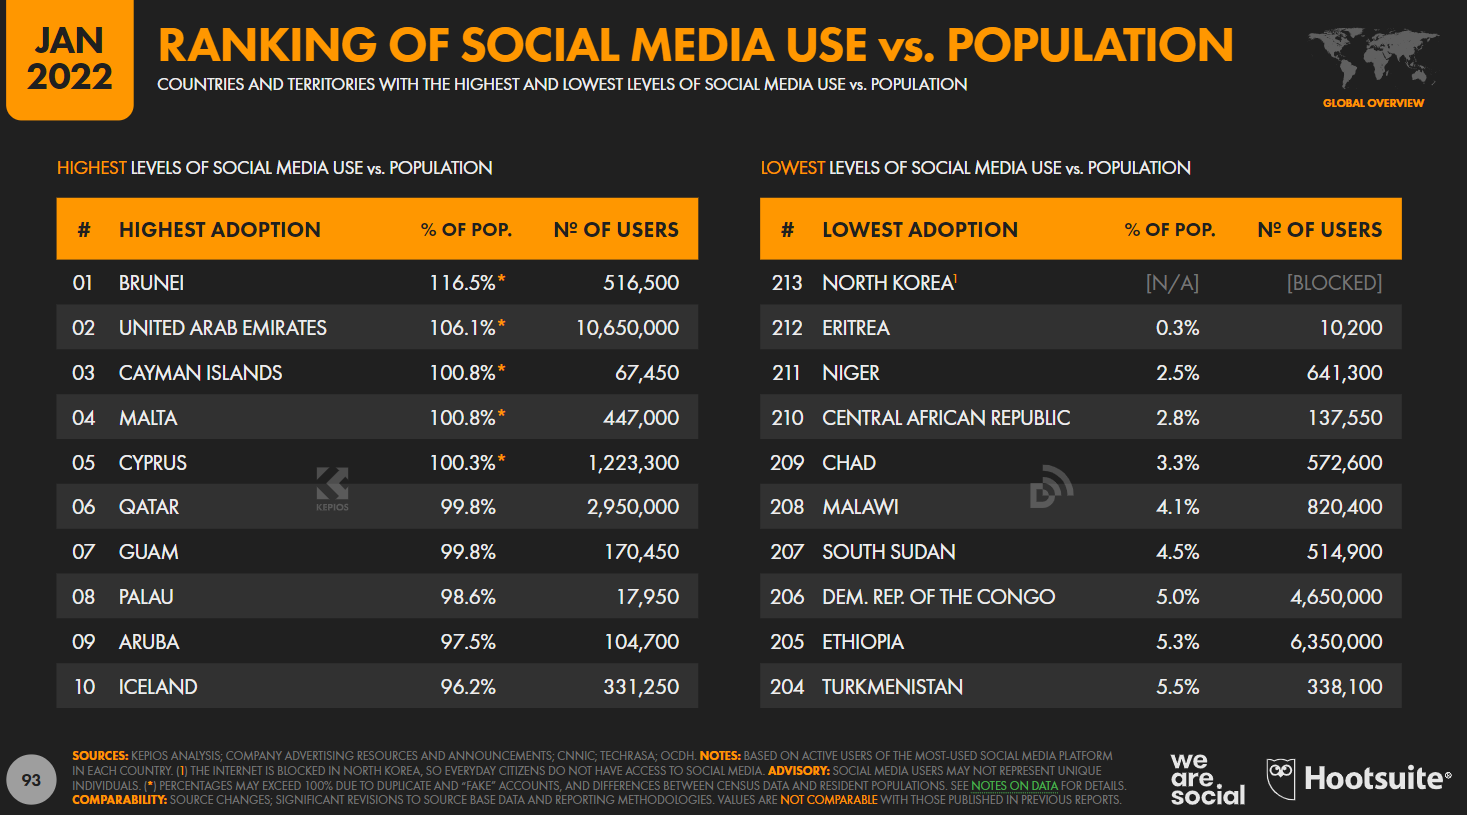
Top 10 countries by social media penetration:
- Brunei – 116.5%
- UAE – 106.1%
- Cayman Islands – 100.8%
- Malta – 10.8%
- Cyprus – 100.3%
- Qatar – 99.8%
- Guam – 99.8%
- Palau – 98.6%
- Aruba – 97.5%
- Iceland – 96.2%
The lowest social media adoption rate (excluding North Korea) is in Eritrea, where the total number of social media accounts is equal to less than 0.3% of the population. Other low adoption countries are Niger (2.5%), Central African Republic (2.8%), and Chad (3.3%).
Social media penetration by region
If we broaden it out to look at larger regions, rather than individual countries, North America has the highest social media penetration rate at 82%. And Oceania has the lowest penetration rate at 66%.
- North America – 82%
- Central America – 73%
- Southern America – 79%
- Caribbean – 55%
- Northern Europe – 85%
- Western Europe – 84%
- Southern Europe – 76%
- Eastern Europe – 70%
- Northern Africa – 56%
- Western Africa – 16%
- Middle Africa – 8%
- Southern Africa – 45%
- Eastern Africa – 10%
- Western Asia – 70%
- Central Asia – 33%
- Southern Asia – 34%
- Eastern Asia – 69%
- South-Eastern Asia – 72%
- Oceania – 66%
Sources: Hootsuite, Statista10
What is the most popular social media platform?
Facebook is still the most popular social media platform on earth with 2.9 billion monthly active users (MAUs). However, it’s growing more slowly than most of its competitors, who are catching up quickly. And it’s not the people’s ‘favorite’ platform—that title belongs to WhatsApp.
Leading social media platforms used by marketers worldwide as of August 2023
Interesting statistics about Facebook:
- Facebook is the third most-visited website in the world, according to Semrush data from November 2021, with 11.74 billion visits
- Facebook was the second most-searched query on Google in 2021
- Over a billion Facebook users engage with groups regularly
- 87% of social media users don’t understand what the Facebook Metaverse is
How many users does each social media network have?
Here’s the number of users each social media network has based on the latest available data at the time of writing:
- Facebook – 2.9 billion
- YouTube – 2.5 billion
- WhatsApp – 2 billion
- Instagram – 1.5 billion
- WeChat – 1.3 billion
- TikTok – 1 billion
- FB Messenger – 988 million
- Douyin – 600 million
- QQ – 574 million
- Sina Weibo – 573 million
- Twititer – 217 million
- Snapchat – 347 million
- Pinterest – 433 million
What is the most downloaded social media app?
TikTok was the world’s most downloaded social media app last year, with 656 million downloads in 2021. That surpassed all Meta-owned social media mobile apps.
Instagram came second with 545 million downloads. Facebook ranked third (416 million), Whatsapp fourth (395 million), and Chinese super-app WeChat fifth (110 million).
What is the best social media platform?
If we consider the ‘best’ social media platform the most social media users consider their favorite, then WhatsApp comes out on top.
In a recent survey, 15.7% of social media users said WhatsApp is their ‘favorite platform’, higher than any other platform. Instagram came second at 14.8%, and Facebook was third at 14.5%

However, user favorites vary by age. Amongst younger users, Instagram was overwhelmingly the favorite, with 15.6% of 16-24-year-olds and 17.8% of 25-34-year-olds voting it their favorite.
Sources: Hootsuite, Hootsuite2, Statista1, Twitter report, Statista9, Statista10
Social media marketing statistics for SME
Facebook is the most-used social media platform by marketers and the most effective, with the greatest ROIs. The top reason marketers use social media is to boost brand awareness, and engagement is widely considered to be the most important metric to track.
How much is spent on social media advertising?
$153 billion was spent on social media advertising in 2021. That’s 33.1% (almost a third) of global digital ad spend. Moreover, the cost of social media ad impressions has risen by 20% over the last 12 months.
And we can expect even more to be spent on social media advertising. According to a survey of 18,100 marketers in 2021, 51.4% said they plan to increase paid social spend in 2022.
The amount spent on social media advertising per user was $28.3 in 2020. This is projected to increase to 40 USD by 2025.
Which social media platforms do marketers use?
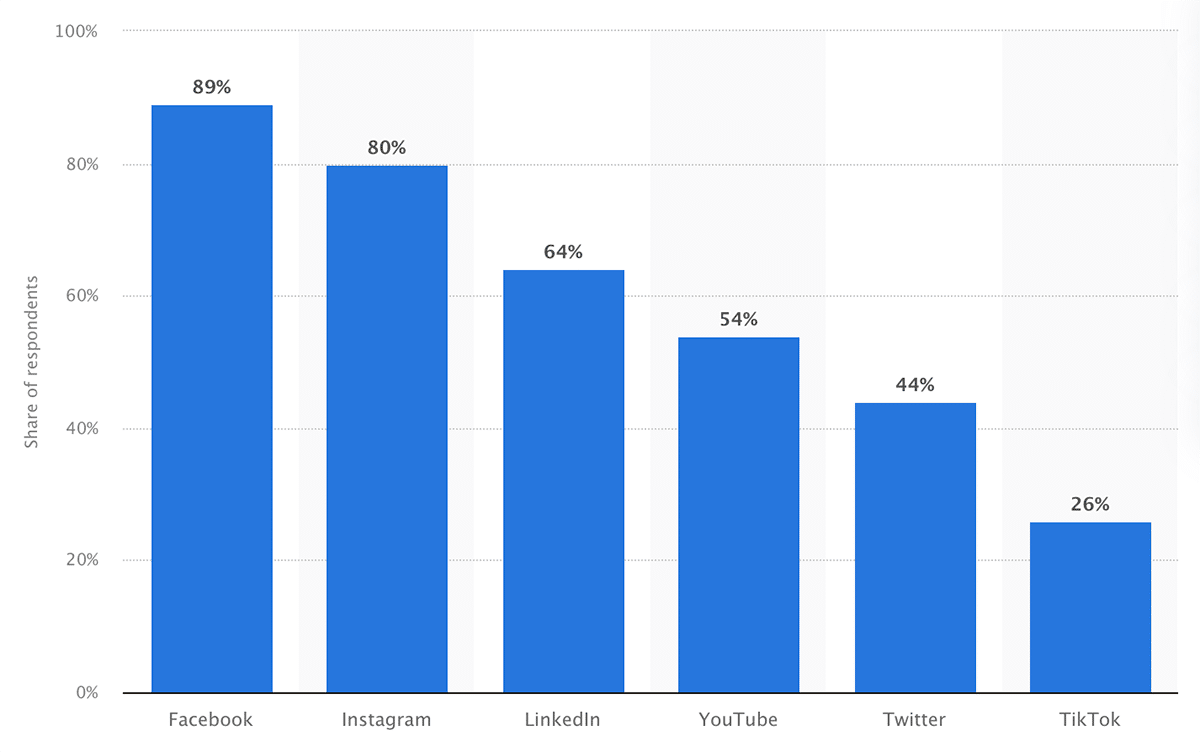
Facebook is the most commonly used social media platform by marketers worldwide. According to a recent report, 93% of marketers use Facebook. In comparison, only 78% use Instagram, the second most-used social network by marketers.
Which social media platforms are most effective?
When asked what social platforms marketers consider most effective, 62% of marketers said Facebook, and 49% said Instagram. This makes Facebook and Instagram the two most effective social platforms for reaching business goals overall.
However, that perceived effectiveness decreased substantially compared to last year, when 78% of Marketers said Facebook and 70% said Instagram.
Meanwhile, TikTok’s perceived effectiveness grew substantially. Last year, only 3% of marketers said it was the most effective marketing social media platform, but that rocketed up to 24% this year. TikTok still has a long way to go to catch up to Facebook but marketers are beginning to
Snapchat is also becoming more popular amongst marketers. In 2020, only 1% of marketers said Snapchat was the most effective platform, but this increased to 13% this year.
Top social media marketing goals
According to a Meltwater study, the top goal of social media marketing (SMM) is to raise brand awareness. This was the goal of over 82% of surveyed marketers.

Top 5 SMM goals:
- Raise brand awareness – 82%
- Increase brand engagement – 62%
- Acquire new customers – 59%
- Increase web traffic – 48%
- Boost sales – 37%
Top social media marketing metrics to track
Over 78% of marketers look at engagement to measure the effectiveness of their social media campaigns, making it the #1 social media marketing metric to track.
Top 5 metrics social media marketers track:
- Engagement – 78.71%
- Followers – 71.04%
- Website traffic – 63.20%
- Marketing leads -31.4%
- Reputation – 26.13%
Top social media challenges for brands
The biggest difficulty 54% of brands face in social media marketing is finding the time and resources to do it. This makes it the #1 top challenge.
- Finding time and resources – 54%
- Measuring impact – 46%
- Gaining followers – 39%
- Creating content – 38%
- Proving value – 31%
Social media marketing ROI
There’s currently no reliable social media statistics available on the average return on investment (ROI) of social media marketing. However, the good news is that 83% of marketers now say they’re confident in quantifying the ROI of their social media marketing efforts. This is up from just 68% last year
21% of surveyed marketers said Facebook has the highest ROI of any platform, 18% said Instagram, 14% said Linkedin, 12% said TikTok, and 11% said YouTube.
Other social media marketing statistics
- 57% of brands say social media has become more important due to Covid-19
- 55% of marketers say their social ads strategy is fully integrated with the rest of their marketing activities.
- 48% of marketers strongly agree that social listening has increased in value for their organization.
- 65% of marketers have fully integrated organic and paid social efforts.
- The global social commerce industry is worth over half a trillion USD
Sources: Hootsuite, Hootsuite2, Meltwater, Statista2, Statista3
Social media revenues
Finally, let’s look at some social media statistics that tell us how much revenue each social media platform earns.
Which social media platform has the highest revenue?
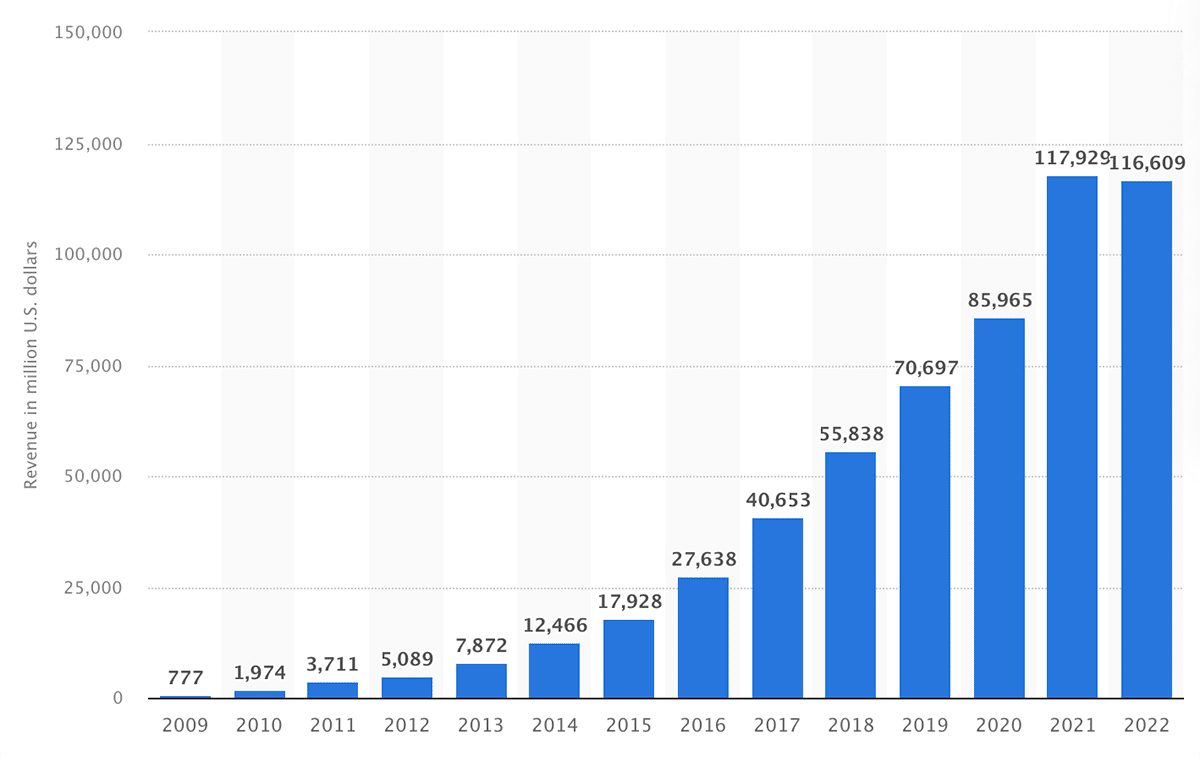
Facebook has the highest revenue of any social media channel. The company earned over 117 billion USD in 2021—more than every other platform combined in 2021. Instagram came second at $47.6 billion.
Annual revenue generated by Meta Platforms from 2009 to 2022
How much annual revenue does each social network earn?
- Facebook – $117 billion
- Instagram – $47.6 billion
- YouTube – $28.8 billion
- WeChat (Tencent) – $17.4 billion
- Whatsapp – $8.7 billion
- Twitter – $5.1 billion
- TikTok – $4.6 billion
- Snapchat – $4.1 billion
- Pinterest – $2.6 billion
*The data above shows the approximate reported annual revenue of each social media company in 2021, according to the best available social media statistics we could find.
Which social media platform has the highest ARPU?
Facebook also has the highest ARPU (annual revenue per user), at $40.34. Instagram has the second-highest ARPU at $32.16.
What’s the ARPU of each social network?
- Facebook – $40.34
- Instagram – $32.16
- Twitter – $23.09
- WeChat (Tencent) – $13.88
- Snapchat – $12.88
- YouTube – $11.52
- Pinterest – $6
- TikTok – $4.6
- WhatsApp – $4.35
*We calculated ARPU by dividing each platform’s annual revenue by its total number of active users (based on the best available data that we could find). These figures should be considered estimations rather than precise numbers.
Sources: Statista6, Business of Apps1, Macro Trends, Social Media Today, Business of Apps2, Business of Apps3, Bloomberg, Statista7, Statista8
Final thoughts
That concludes our roundup of social media statistics. We hope you learned something interesting!
The key takeaway is that social media is now used by over half the world’s population and still growing. But while Facebook continues to have more users than any other platform, new emerging platforms like TikTok are shaking things up.
Still hungry for knowledge? While you’re here, you might want to check out our roundup of WordPress statistics.
Enjoy!
Related Posts


This Post Has 0 Comments