Misc
Visualizing 200 Years of U.S. Population Density
Visualizing 200 Years of U.S. Population Density
At the moment, there are around 326 million people living in the United States, a country that’s 3.5 million square miles (9.8 million sq km) in land area.
But throughout the nation’s history, neither of these numbers have stayed constant.
Not only did the population boom as a result of births and immigrants, but the borders of the country kept changing as well – especially in the country’s early years as settlers moved westwards.
U.S. Population Density Over Time
From a big picture perspective, here is how population density has changed for the country as a whole over the last 200 years or so:
[table “404” not found /]But today’s animated map, which comes to us from Vivid Maps, takes things a step further.
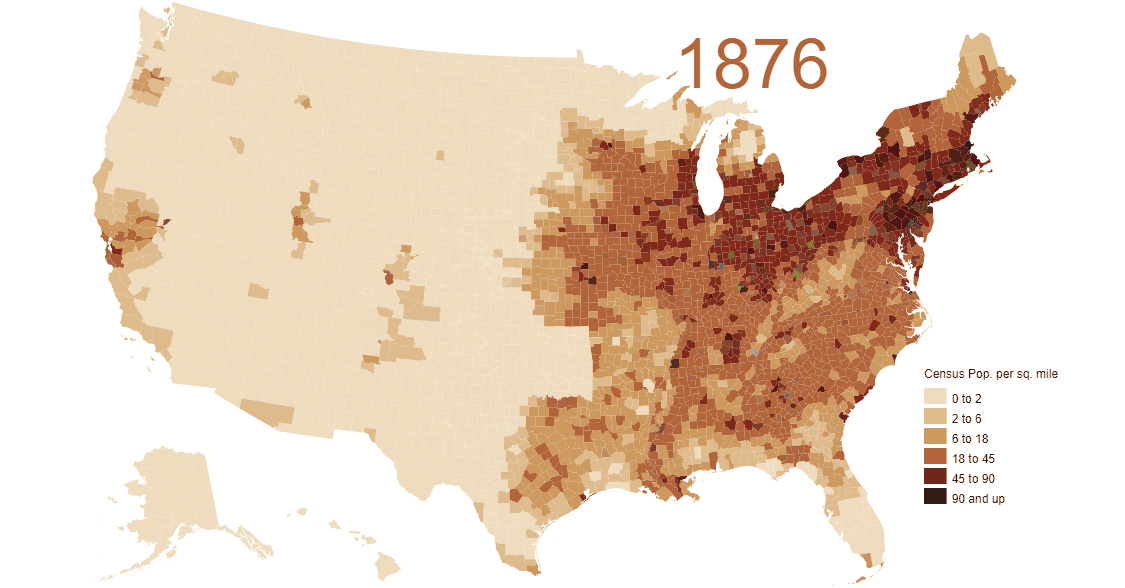
It plots U.S. population density numbers over the time period of 1790-2010 based on U.S. Census data and Jonathan Schroeder’s county-level decadal estimates for population. In essence, it gives a more precise view of who moved where and when over the course of the nation’s history.
Note: While U.S. Census data is granular and dates back to 1790, it comes with certain limitations. One obvious drawback, for example, is that such data is not able to properly account for Native American populations.
“Go West, Young Man”
As you might notice in the animation, there is one anomaly that appears in the late-1800s: the area around modern-day Oklahoma is colored in, but the state itself is an “empty gap” on the map.
The reason for this? The area was originally designated as Indian Territory – land reserved for the forced re-settlement of Native Americans. However, in 1889, the land was opened up to a massive land rush, and approximately 50,000 pioneers lined up to grab a piece of the two million acres (8,000 km²) opened for settlement.
While settlers flocking to Oklahoma is one specific event that ties into this animation, really the map shows the history of a much broader land rush in general: Manifest Destiny.
You can see pioneers landing in Louisiana in the early 1800s, the first settlements in California and Oregon, and the gradual filling up of the states in the middle of the country.
By the mid-20th century, the distribution of the population starts to resemble that of modern America.
Population Density Today
The average population density in the U.S. is now 92 people per square mile, although this changes dramatically based on where you are located:
If you are in Alaska, the state with the lowest population density, there is just one person per square mile – but if you’re in New York City there are 27,000 people per square mile, the highest of any major city in the country.


Maps
The Largest Earthquakes in the New York Area (1970-2024)
The earthquake that shook buildings across New York in April 2024 was the third-largest quake in the Northeast U.S. over the past 50 years.


The Largest Earthquakes in the New York Area
This was originally posted on our Voronoi app. Download the app for free on Apple or Android and discover incredible data-driven charts from a variety of trusted sources.
The 4.8 magnitude earthquake that shook buildings across New York on Friday, April 5th, 2024 was the third-largest quake in the U.S. Northeast area over the past 50 years.
In this map, we illustrate earthquakes with a magnitude of 4.0 or greater recorded in the Northeastern U.S. since 1970, according to the United States Geological Survey (USGS).
Shallow Quakes and Older Buildings
The earthquake that struck the U.S. Northeast in April 2024 was felt by millions of people from Washington, D.C., to north of Boston. It even caused a full ground stop at Newark Airport.
The quake, occurring just 5 km beneath the Earth’s surface, was considered shallow, which is what contributed to more intense shaking at the surface.
According to the USGS, rocks in the eastern U.S. are significantly older, denser, and harder than those on the western side, compressed by time. This makes them more efficient conduits for seismic energy. Additionally, buildings in the Northeast tend to be older and may not adhere to the latest earthquake codes.
Despite disrupting work and school life, the earthquake was considered minor, according to the Michigan Technological University magnitude scale:
| Magnitude | Earthquake Effects | Estimated Number Each Year |
|---|---|---|
| 2.5 or less | Usually not felt, but can be recorded by seismograph. | Millions |
| 2.5 to 5.4 | Often felt, but only causes minor damage. | 500,000 |
| 5.5 to 6.0 | Slight damage to buildings and other structures. | 350 |
| 6.1 to 6.9 | May cause a lot of damage in very populated areas. | 100 |
| 7.0 to 7.9 | Major earthquake. Serious damage. | 10-15 |
| 8.0 or greater | Great earthquake. Can totally destroy communities near the epicenter. | One every year or two |
The largest earthquake felt in the area over the past 50 years was a 5.3 magnitude quake that occurred in Au Sable Forks, New York, in 2002. It damaged houses and cracked roads in a remote corner of the Adirondack Mountains, but caused no injuries.
| Date | Magnitude | Location | State |
|---|---|---|---|
| April 20, 2002 | 5.3 | Au Sable Forks | New York |
| October 7, 1983 | 5.1 | Newcomb | New York |
| April 5, 2024 | 4.8 | Whitehouse Station | New Jersey |
| October 16, 2012 | 4.7 | Hollis Center | Maine |
| January 16, 1994 | 4.6 | Sinking Spring | Pennsylvania |
| January 19, 1982 | 4.5 | Sanbornton | New Hampshire |
| September 25, 1998 | 4.5 | Adamsville | Pennsylvania |
| June 9, 1975 | 4.2 | Altona | New York |
| May 29, 1983 | 4.2 | Peru | Maine |
| April 23, 1984 | 4.2 | Conestoga | Pennsylvania |
| January 16, 1994 | 4.2 | Sinking Spring | Pennsylvania |
| November 3, 1975 | 4 | Long Lake | New York |
| June 17, 1991 | 4 | Worcester | New York |
The largest earthquake in U.S. history, however, was the 1964 Good Friday quake in Alaska, measuring 9.2 magnitude and killing 131 people.

-

 Business2 weeks ago
America’s Top Companies by Revenue (1994 vs. 2023)
-

 Environment1 week ago
Ranked: Top Countries by Total Forest Loss Since 2001
-

 Markets1 week ago
Visualizing America’s Shortage of Affordable Homes
-

 Maps2 weeks ago
Mapped: Average Wages Across Europe
-

 Mining2 weeks ago
Charted: The Value Gap Between the Gold Price and Gold Miners
-

 Demographics2 weeks ago
Visualizing the Size of the Global Senior Population
-

 Misc2 weeks ago
Tesla Is Once Again the World’s Best-Selling EV Company
-

 Technology2 weeks ago
Ranked: The Most Popular Smartphone Brands in the U.S.