

LOADING...

- Real-Time River Monitor
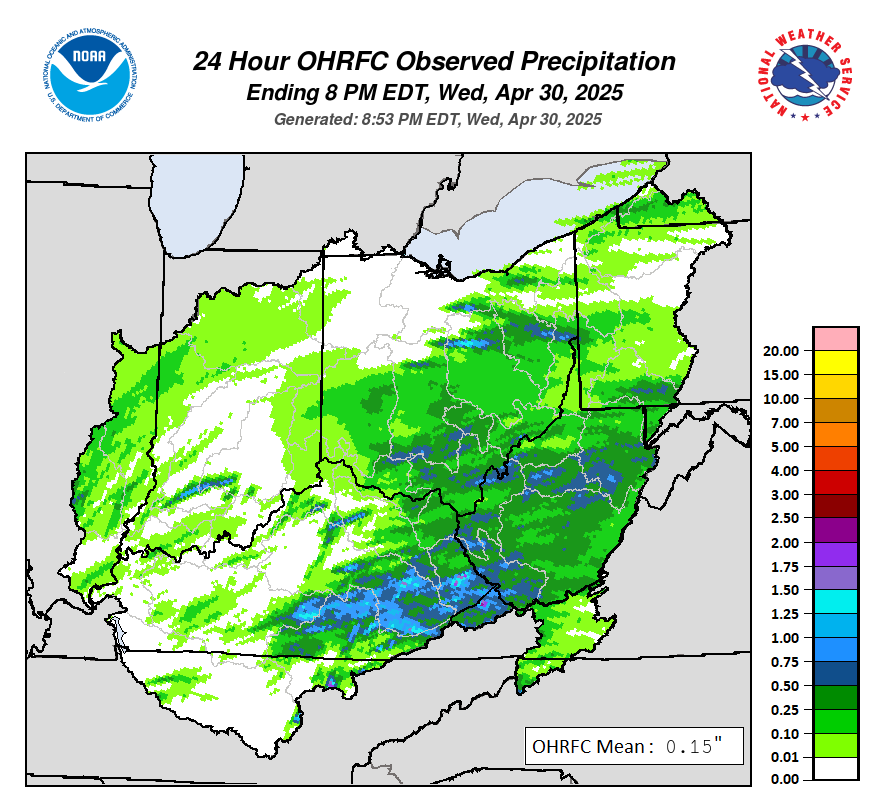
- Past Precipitation Data
- Current Conditions
- Forecasts and Outlooks
- Drought and Ice Information
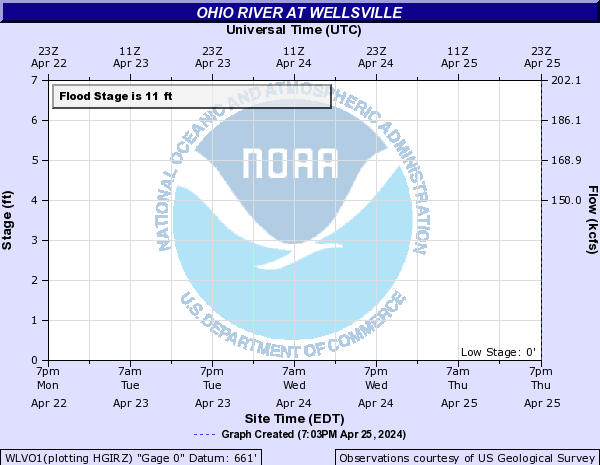
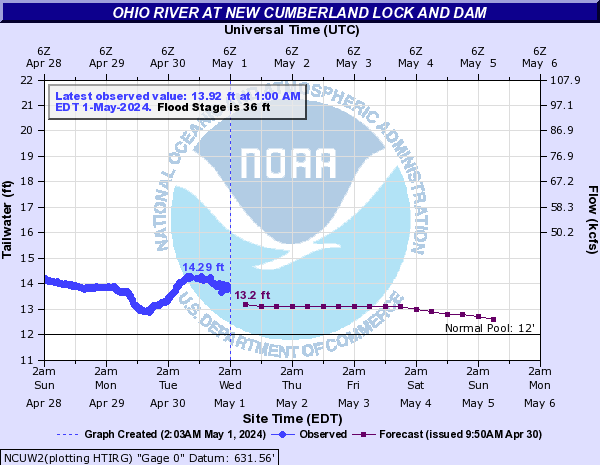
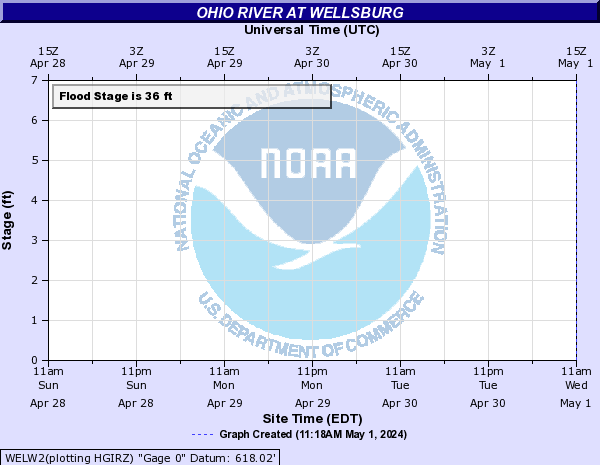
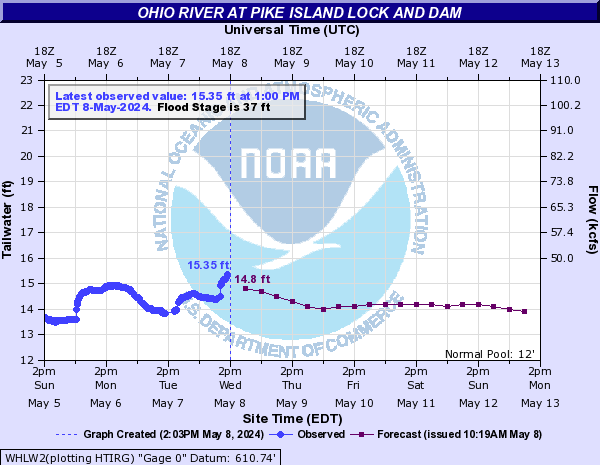
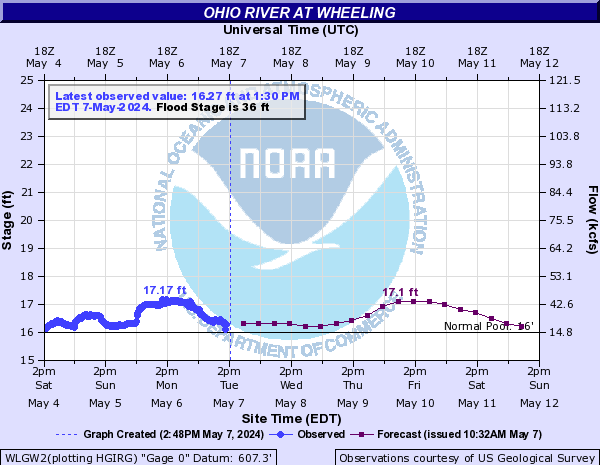
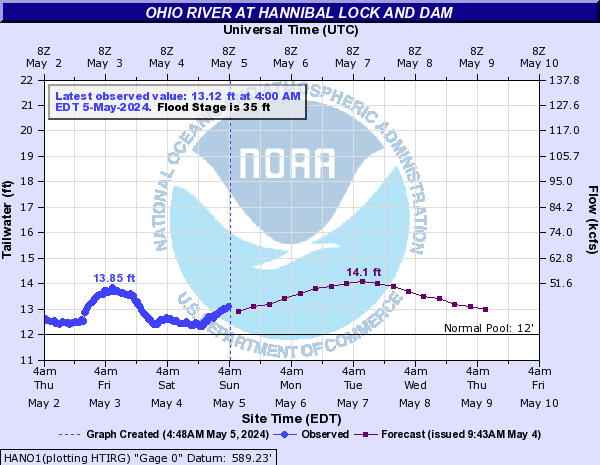
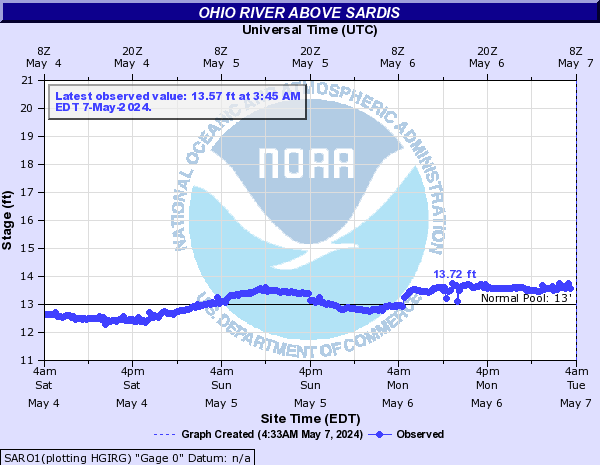
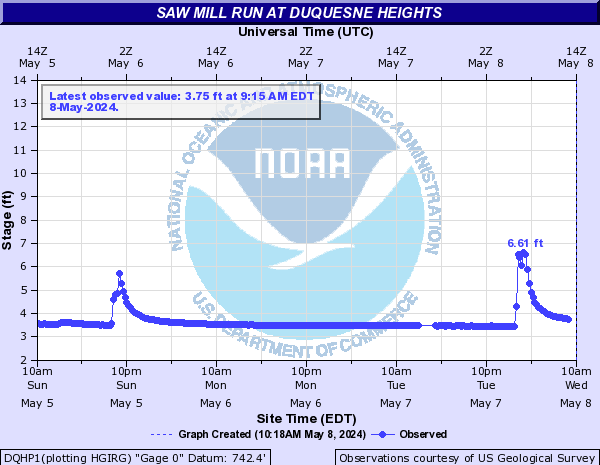
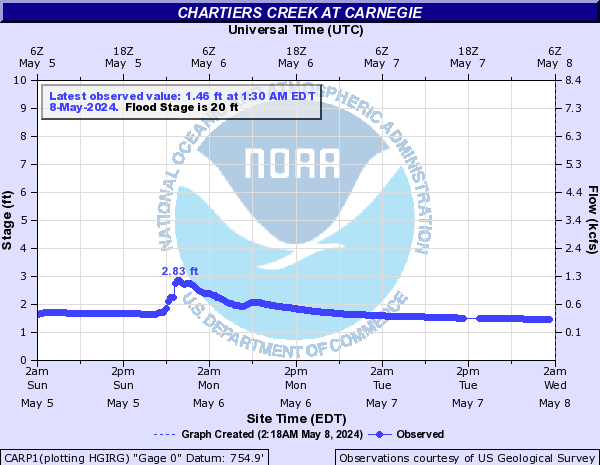
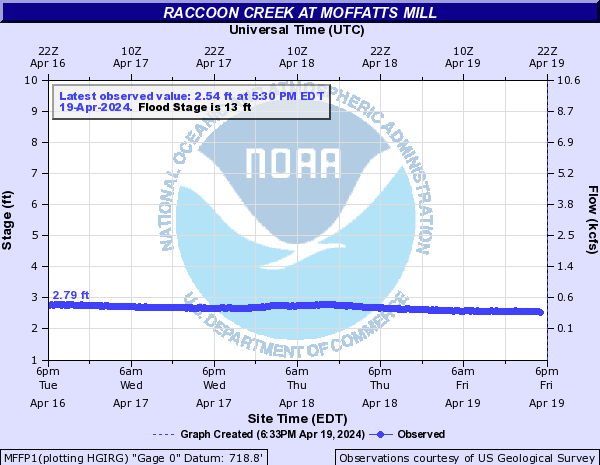
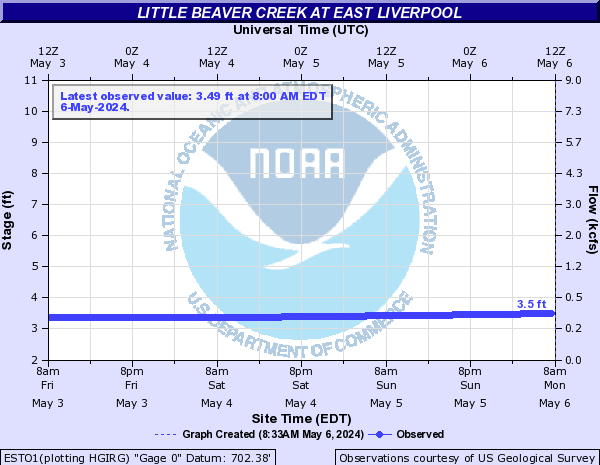
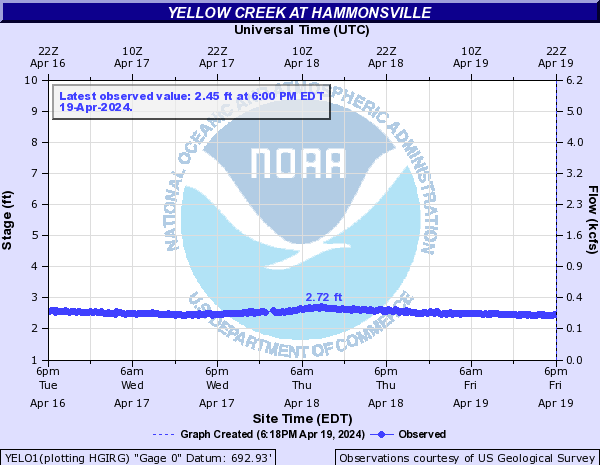
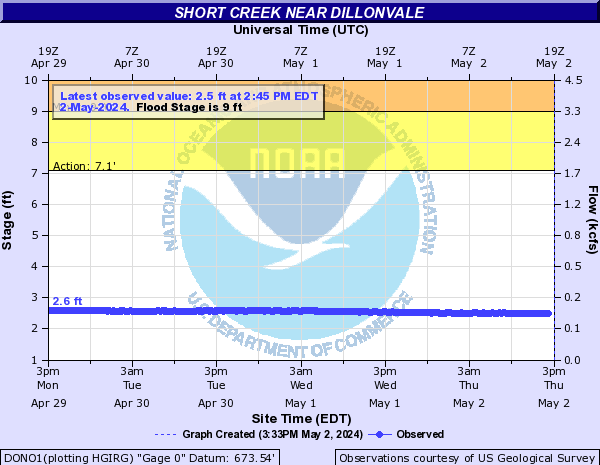
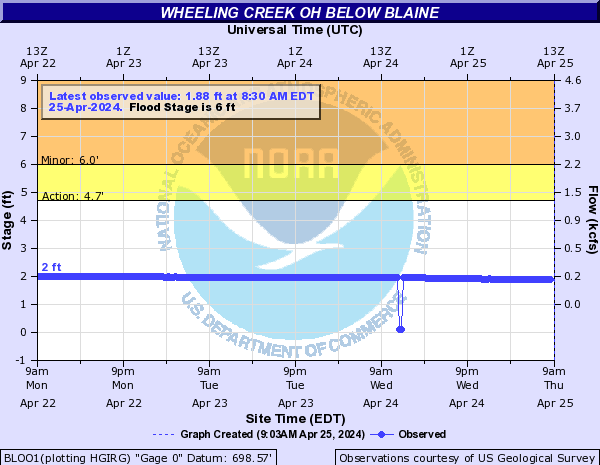
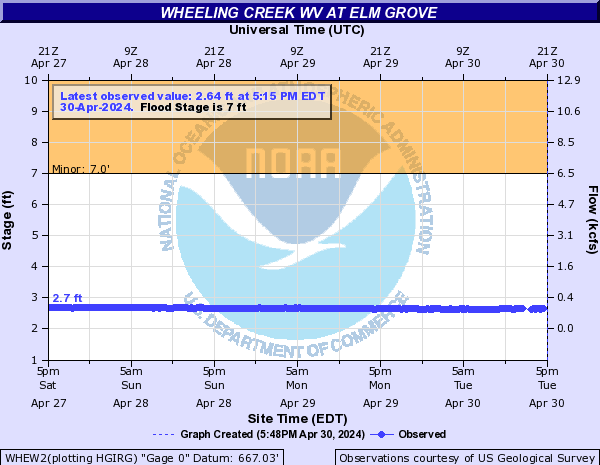
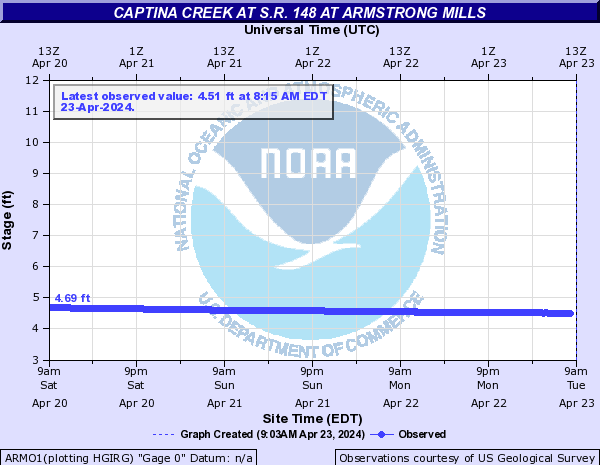
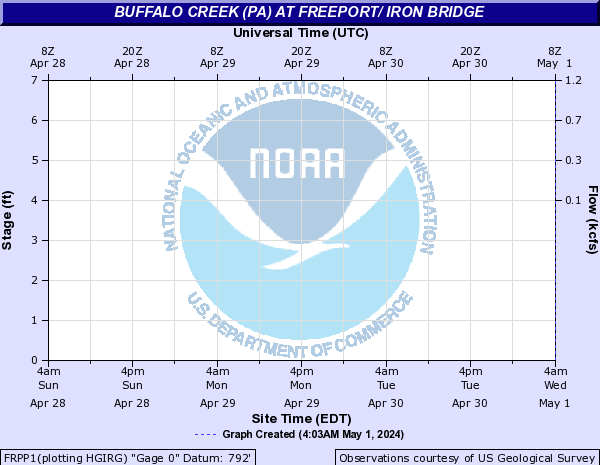
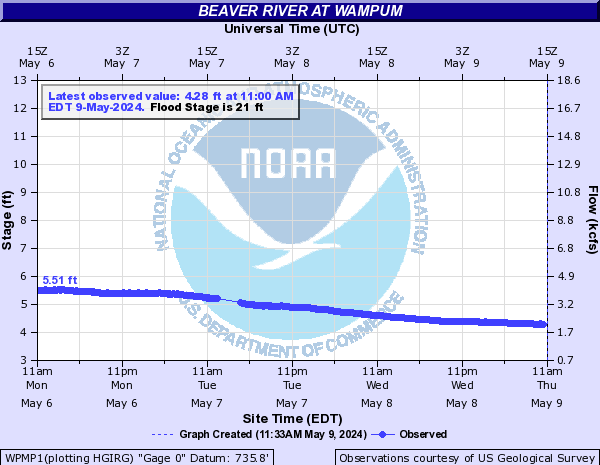
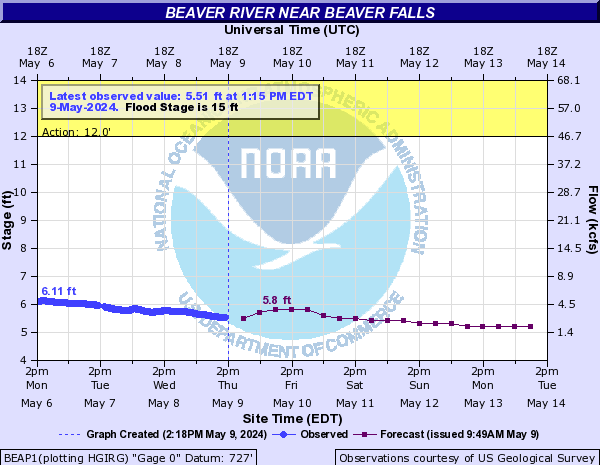
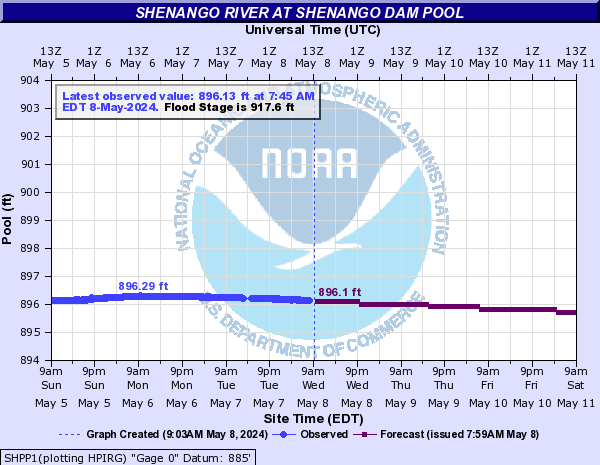
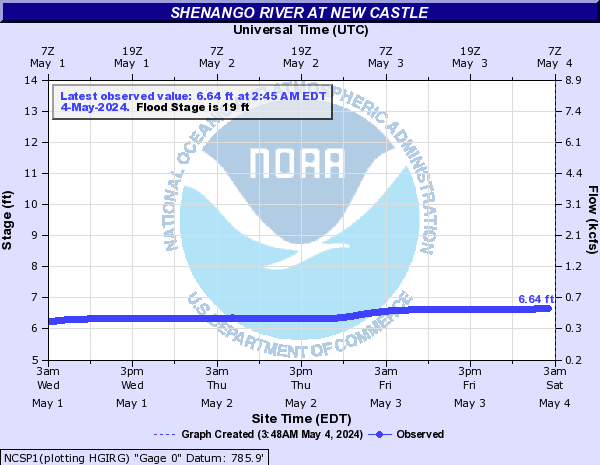
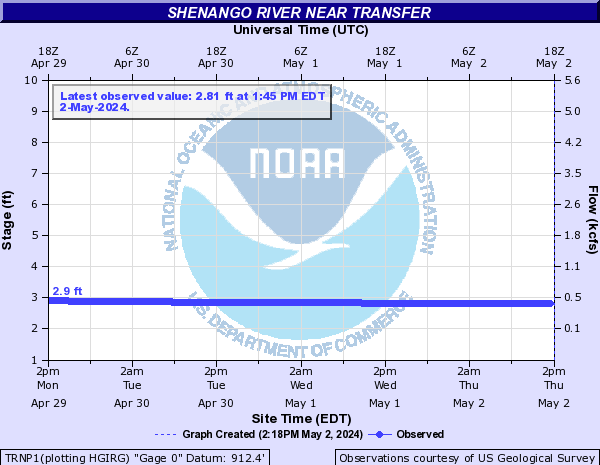
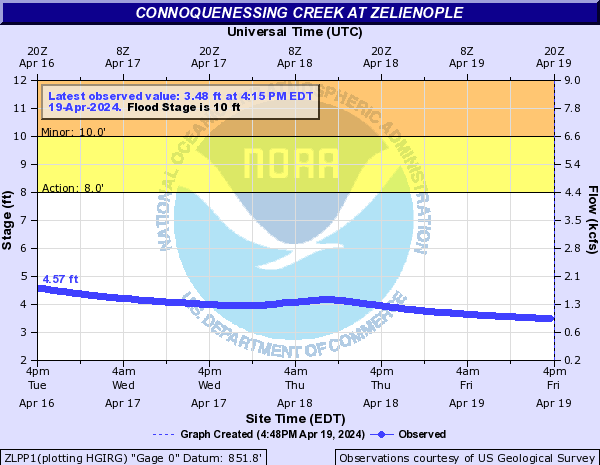
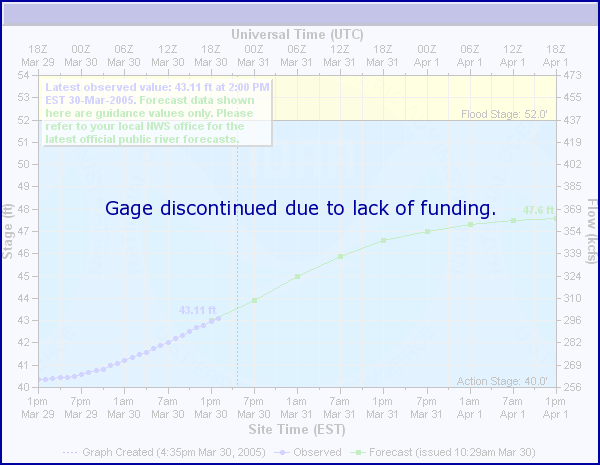
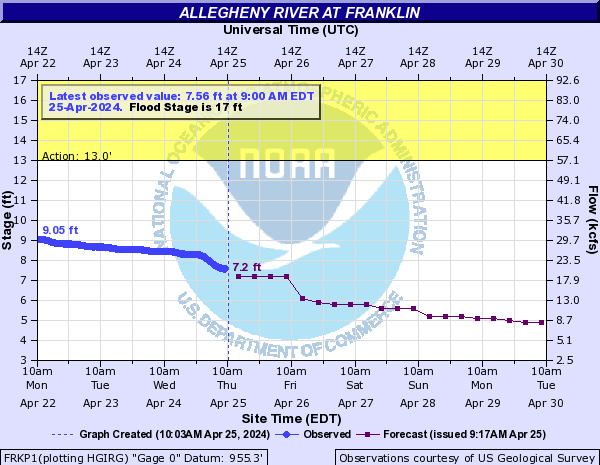
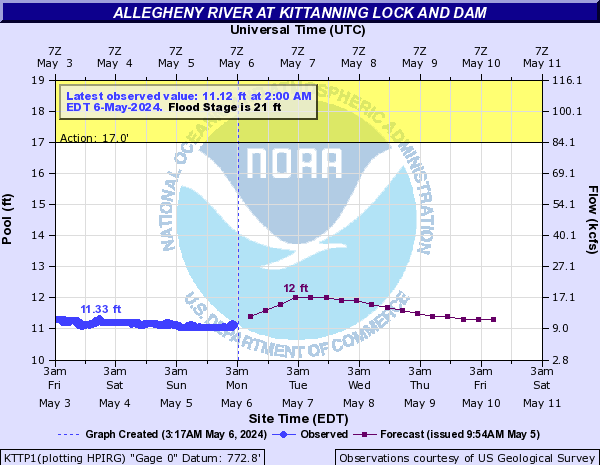
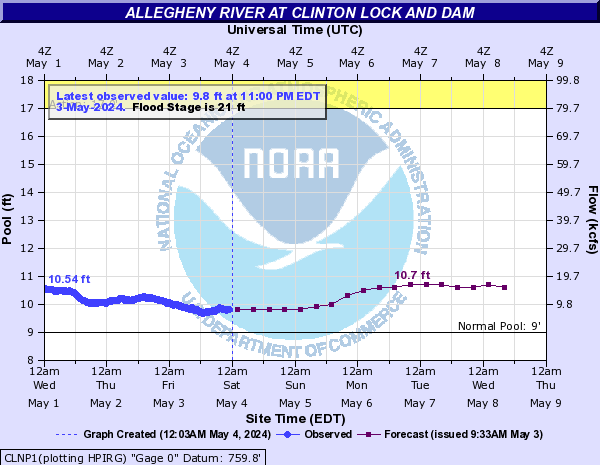
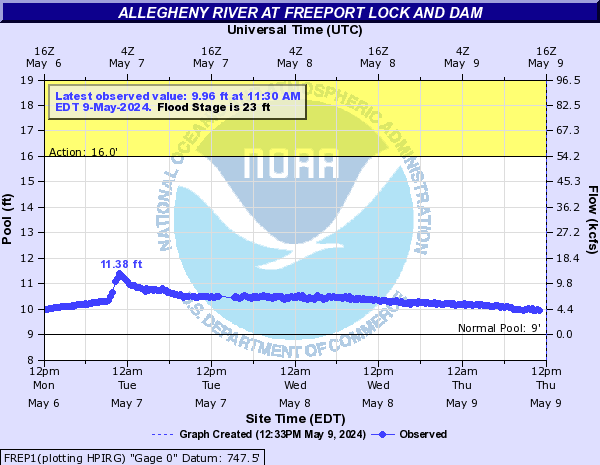
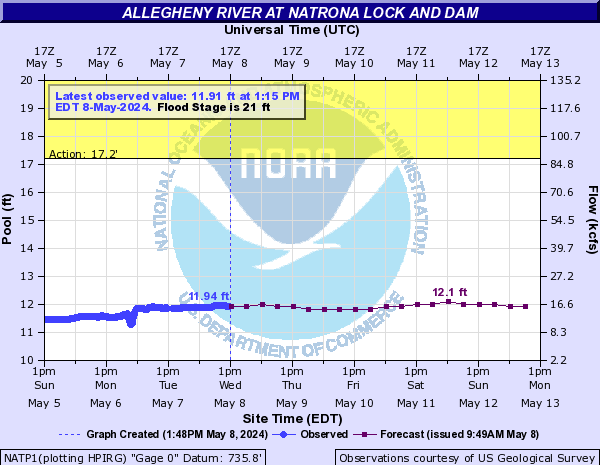
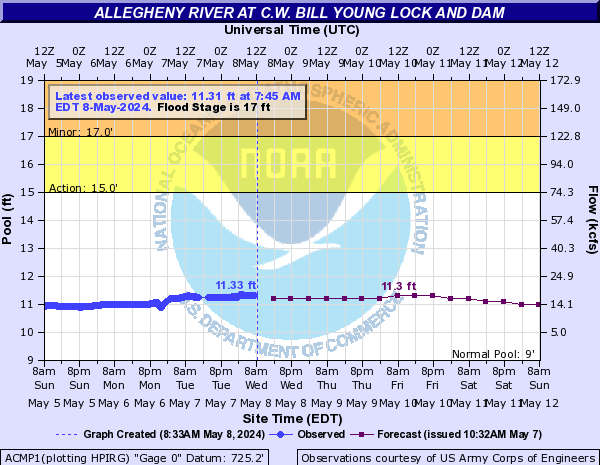
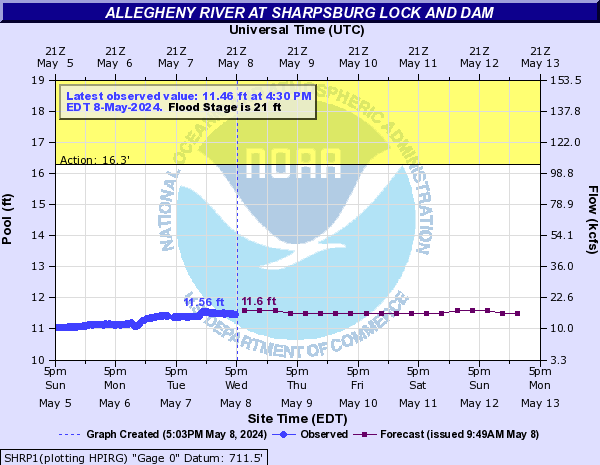
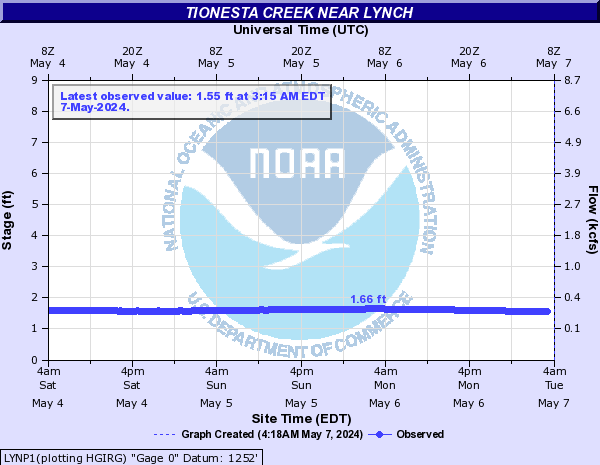
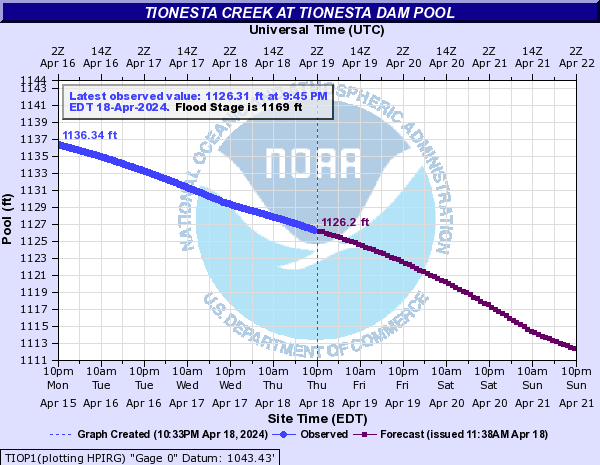
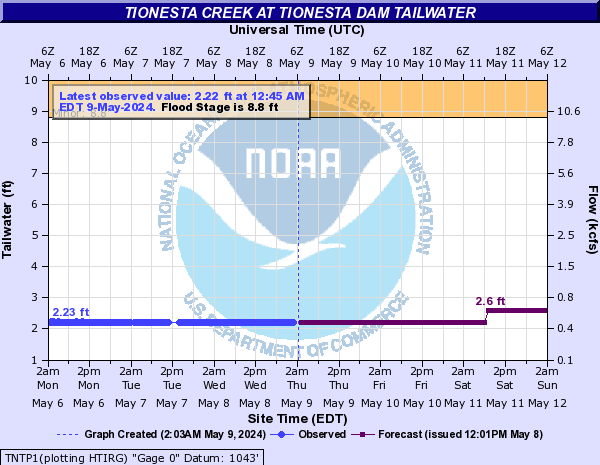
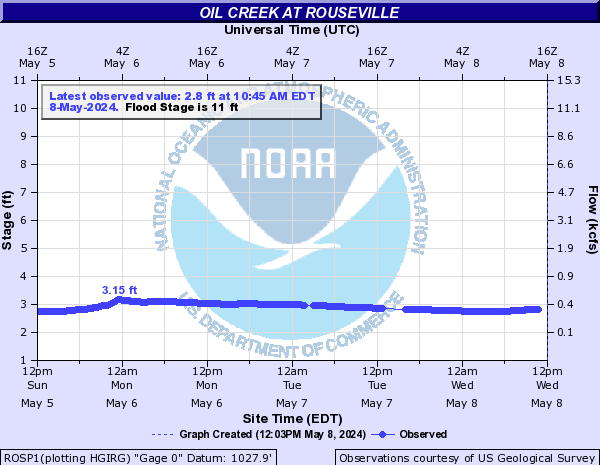
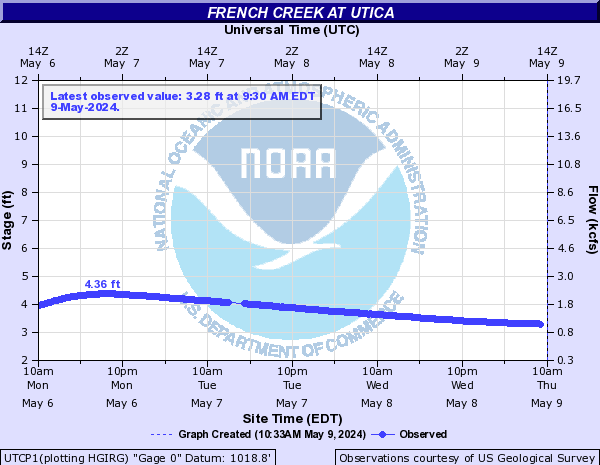
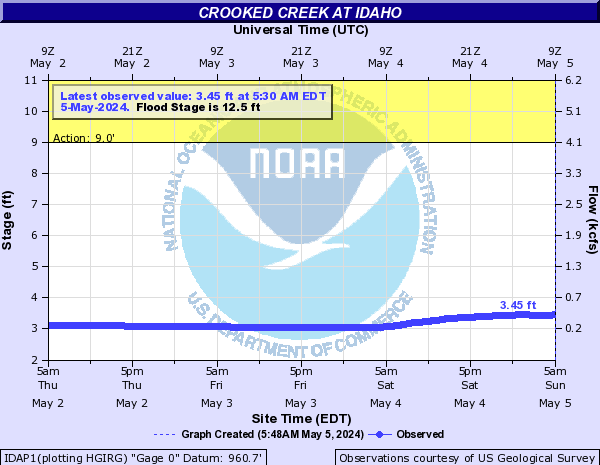
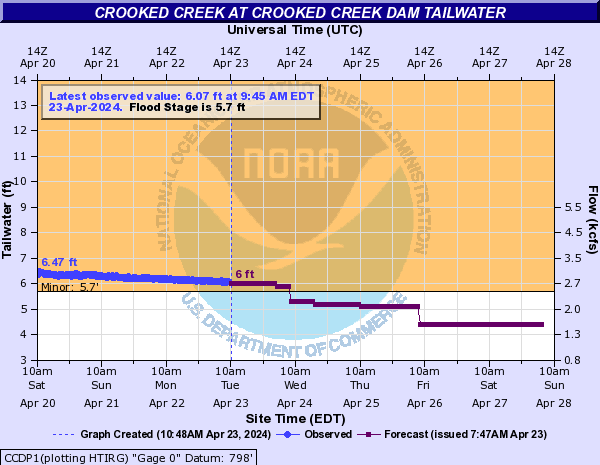
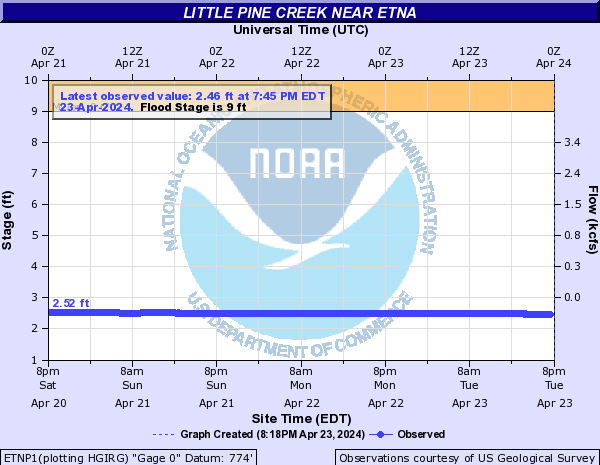
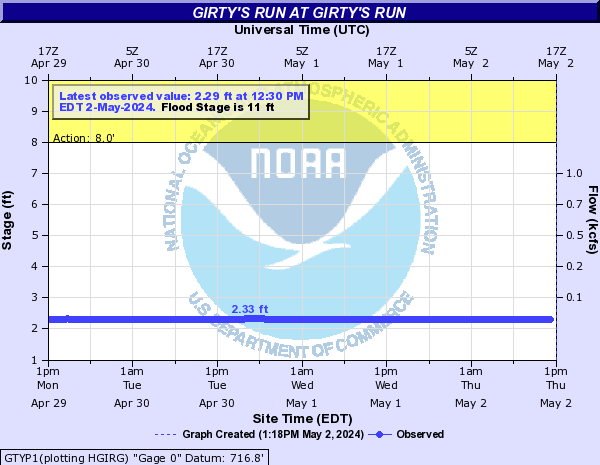
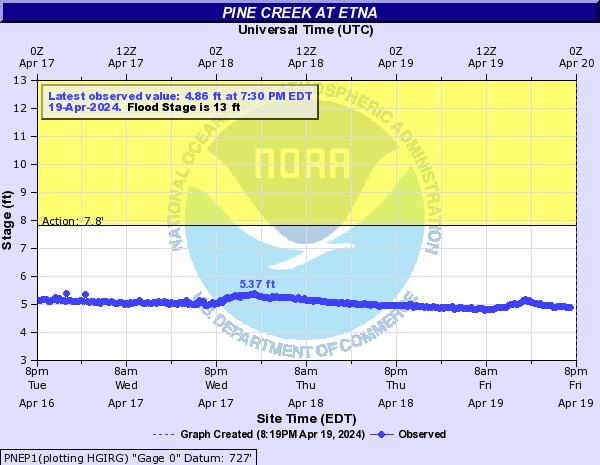
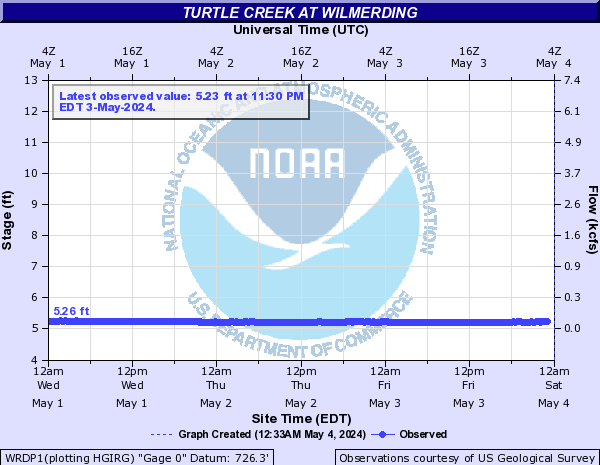
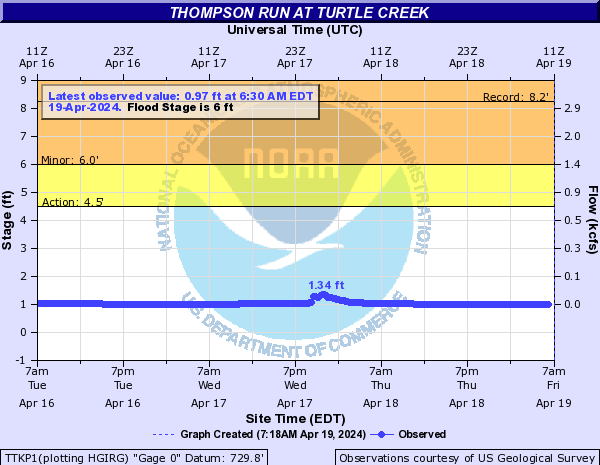
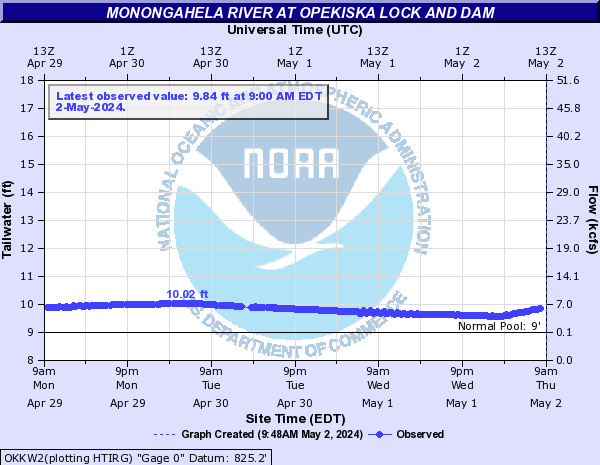
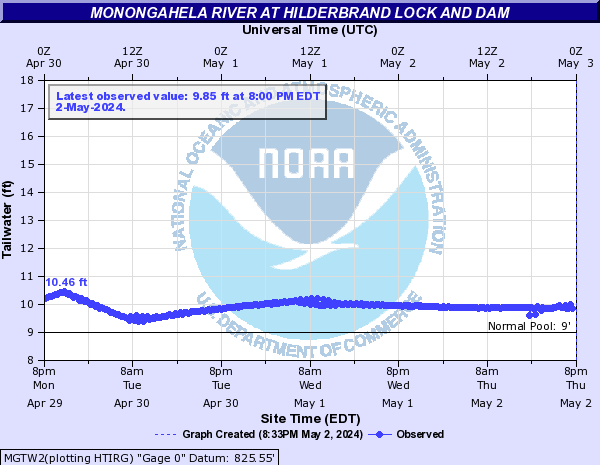
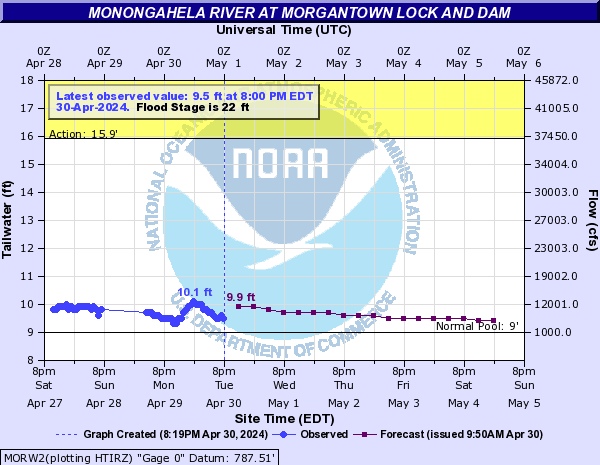
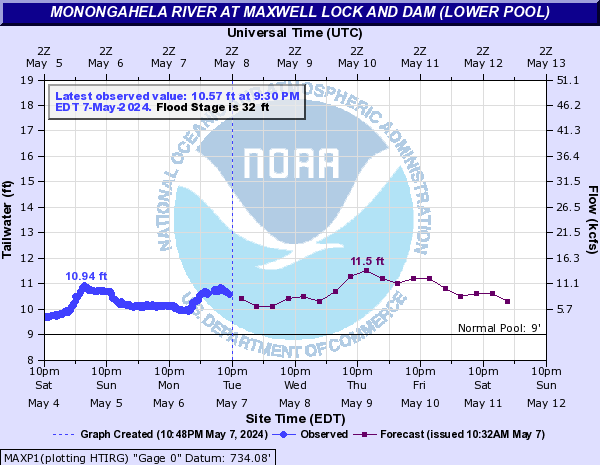
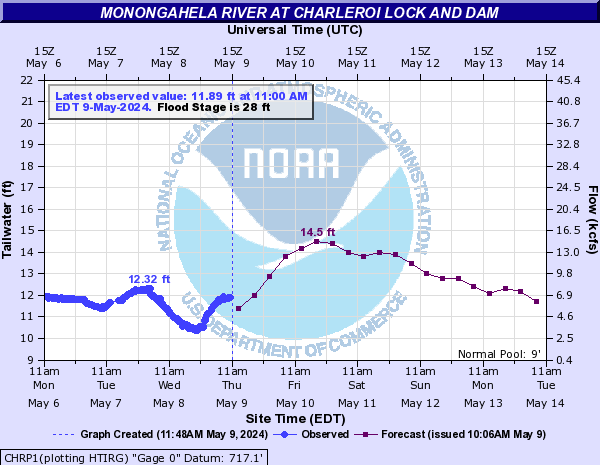
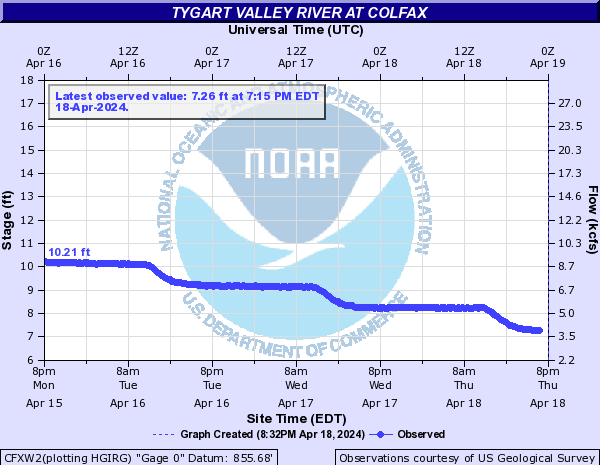
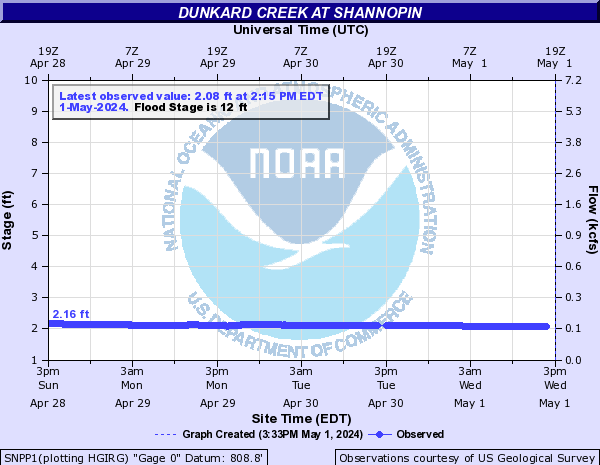
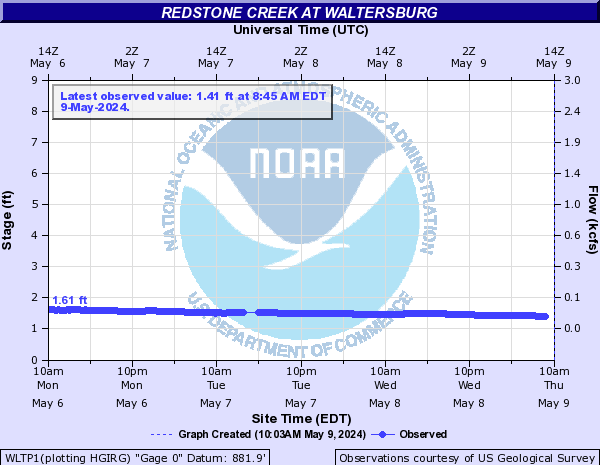
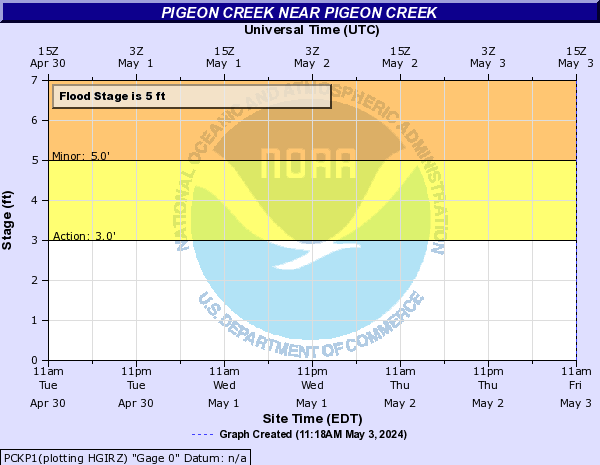
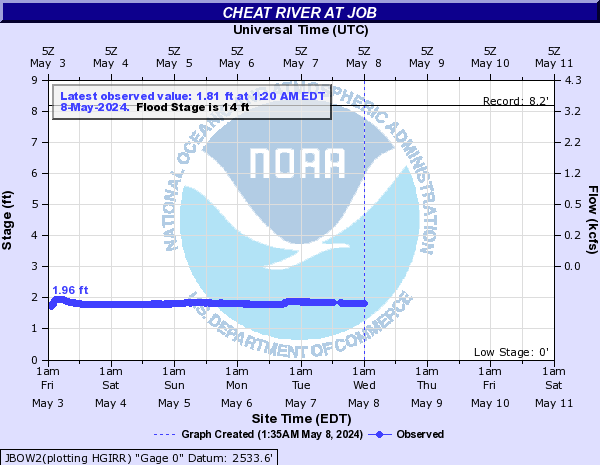
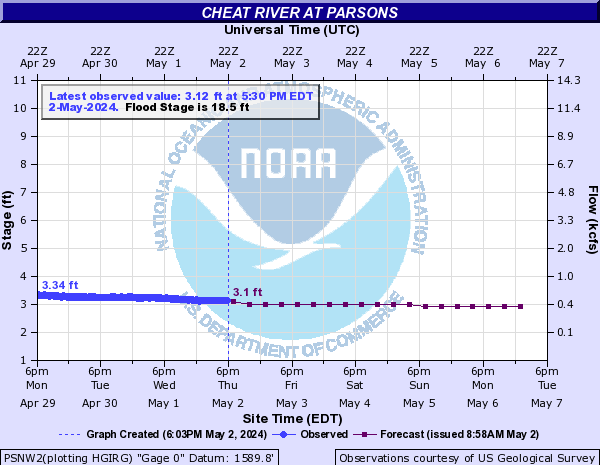
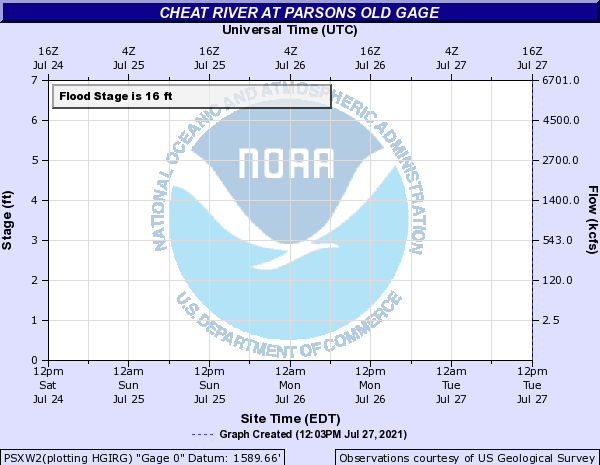
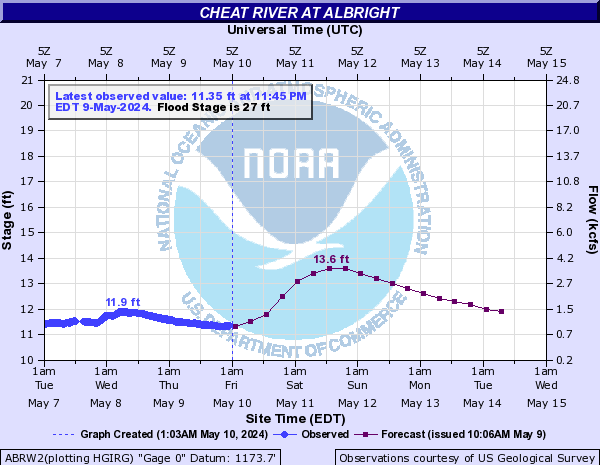
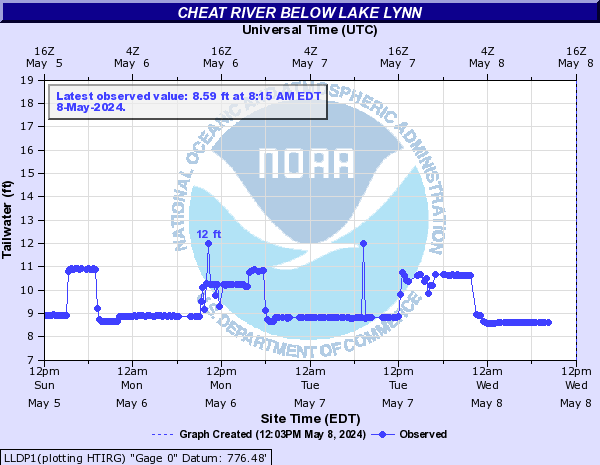
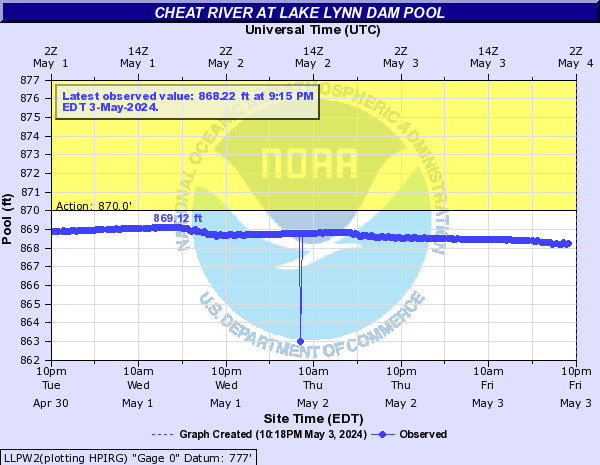
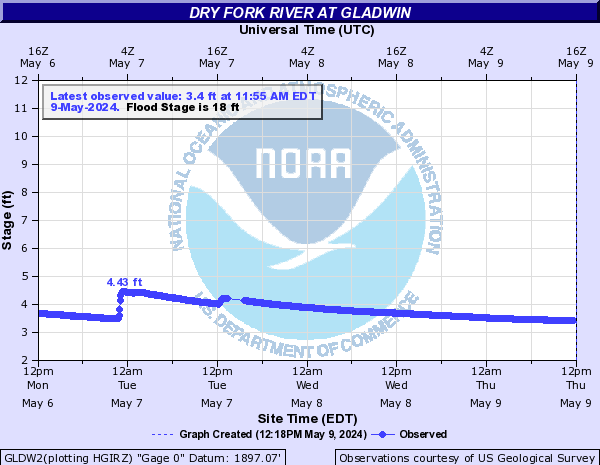
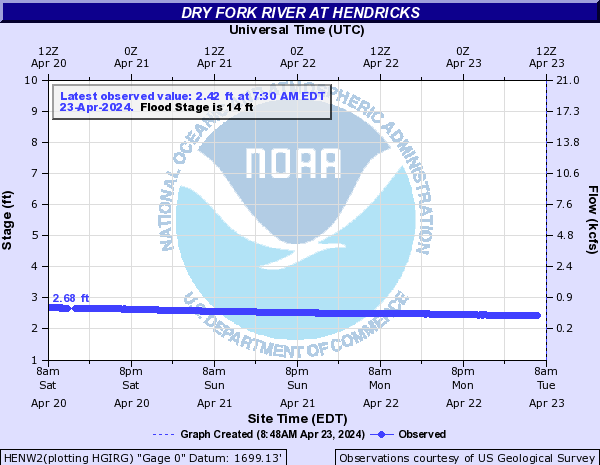
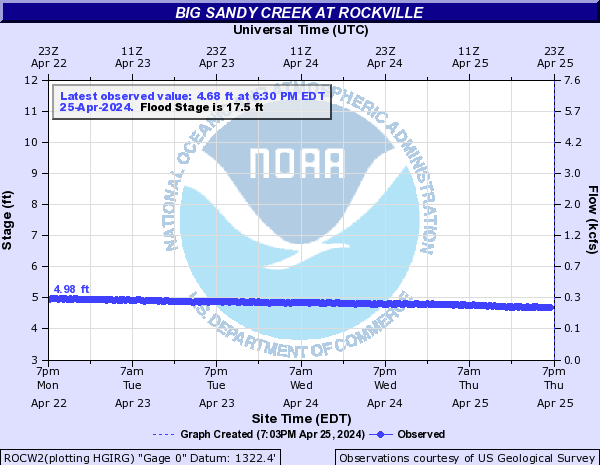
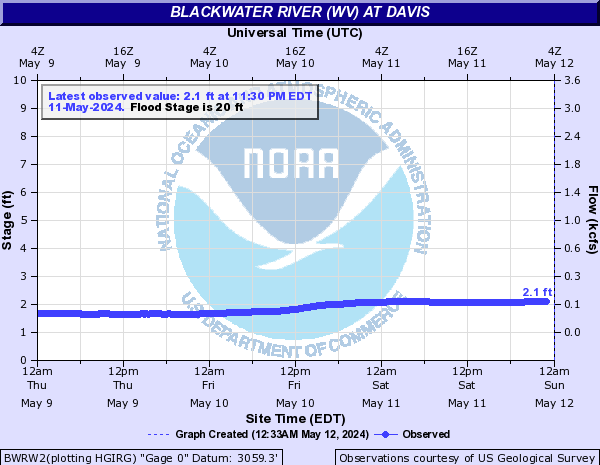
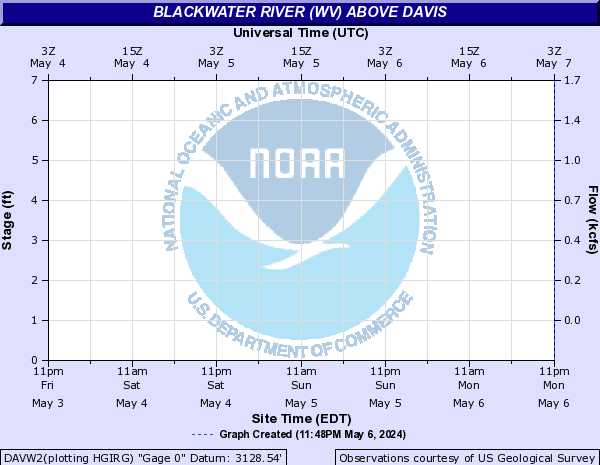
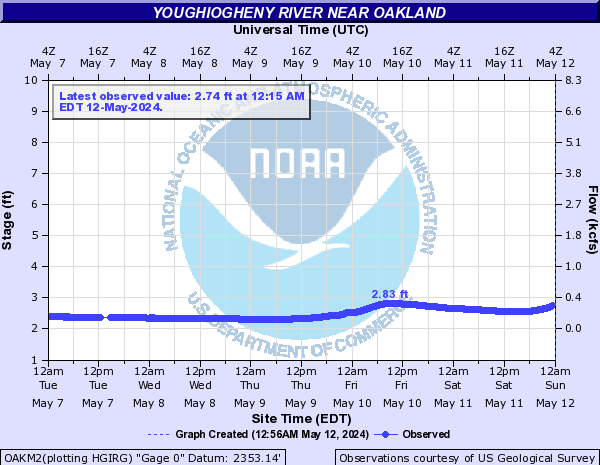
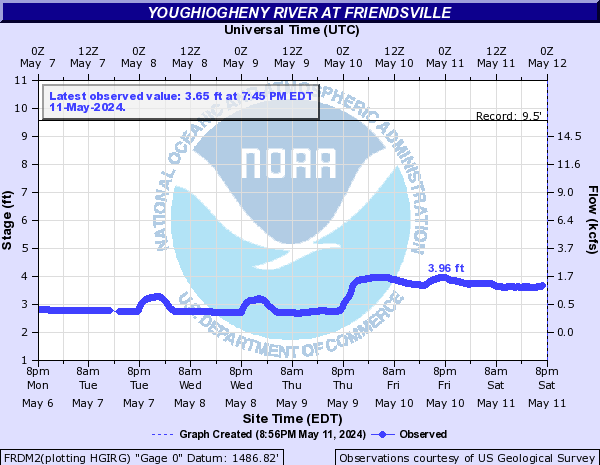
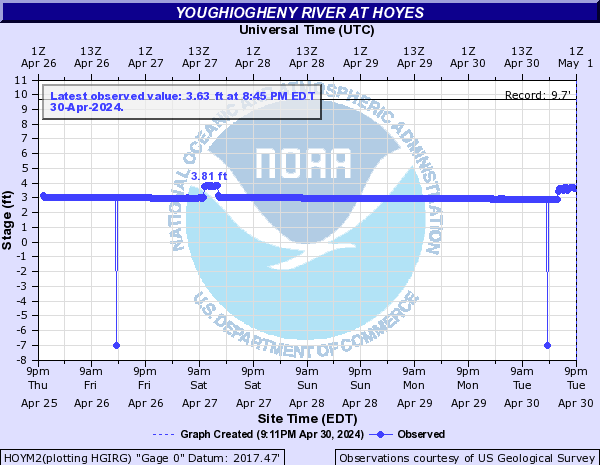
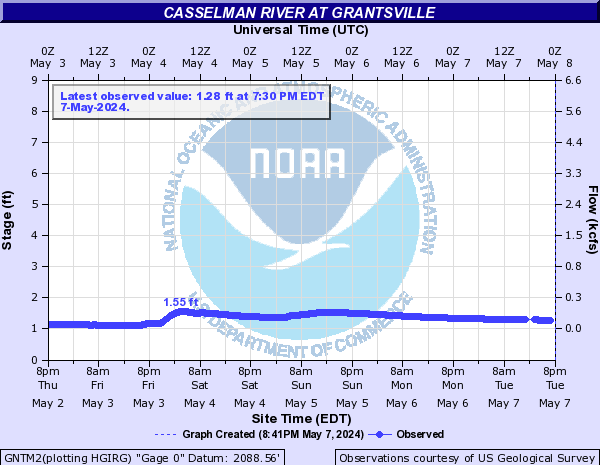
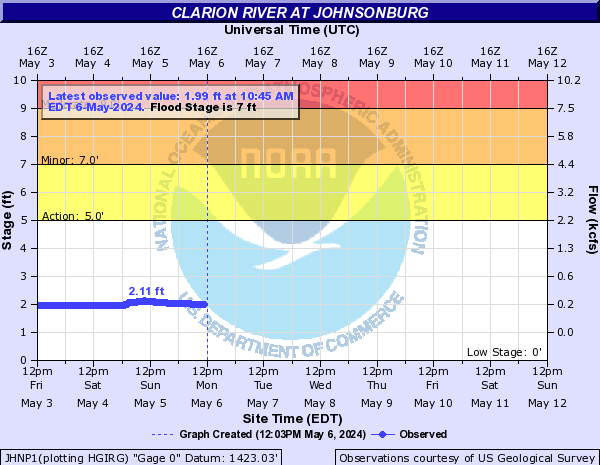
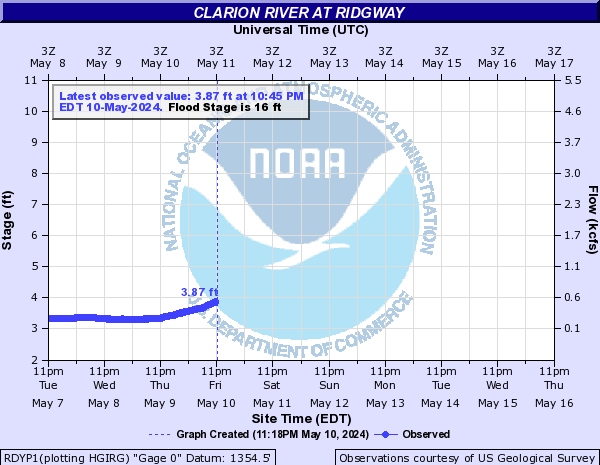
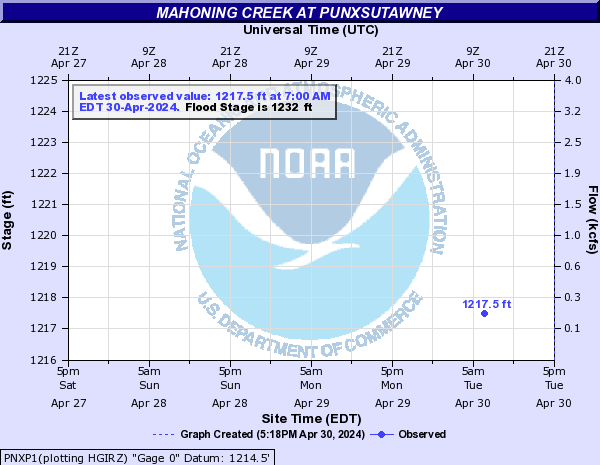
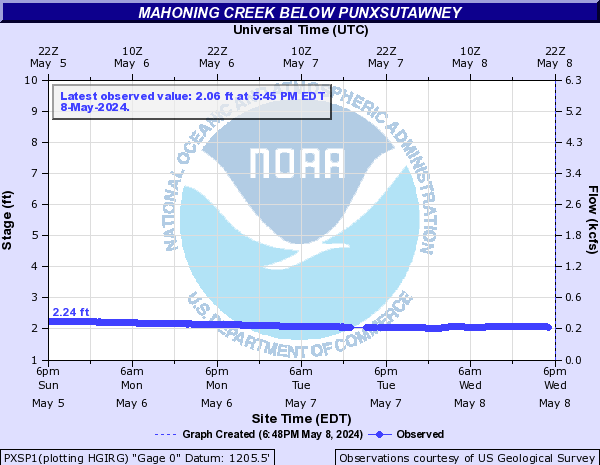
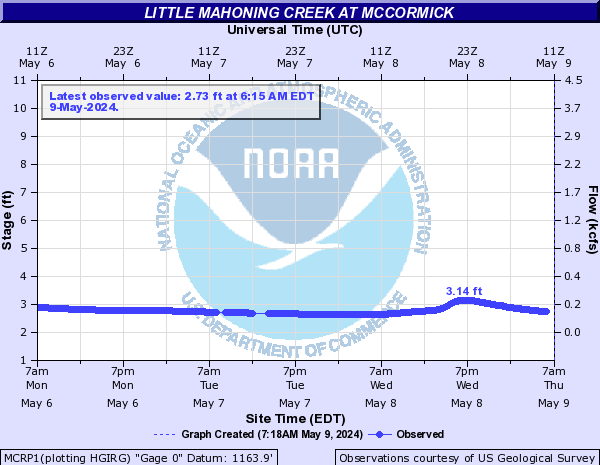
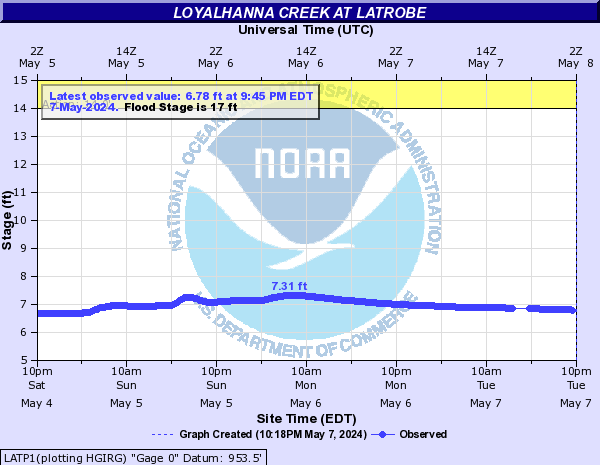
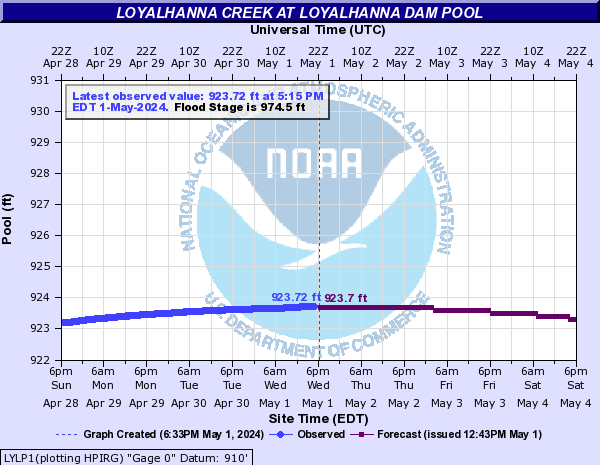
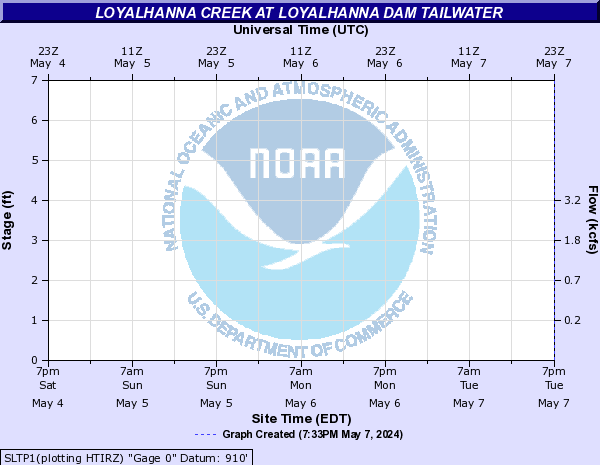
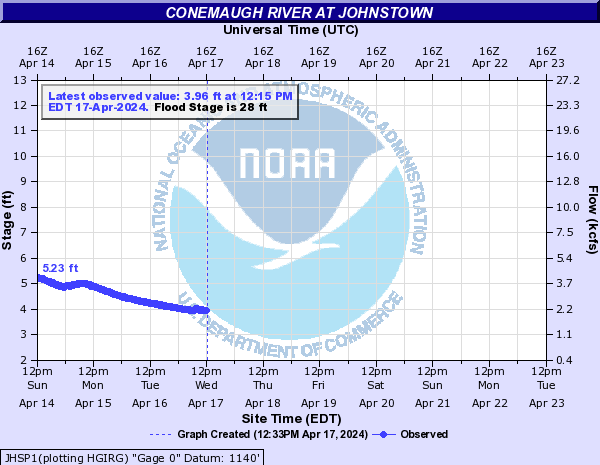
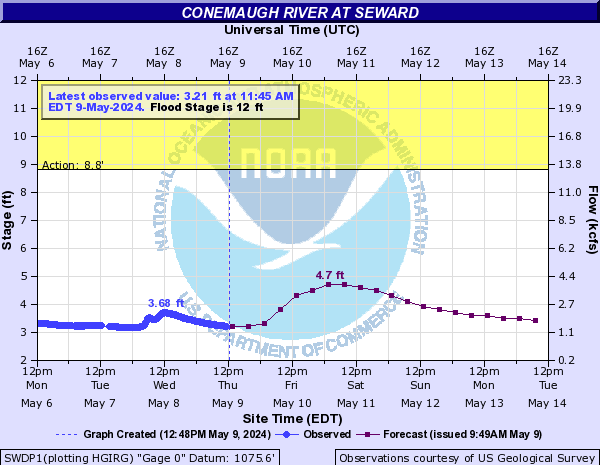
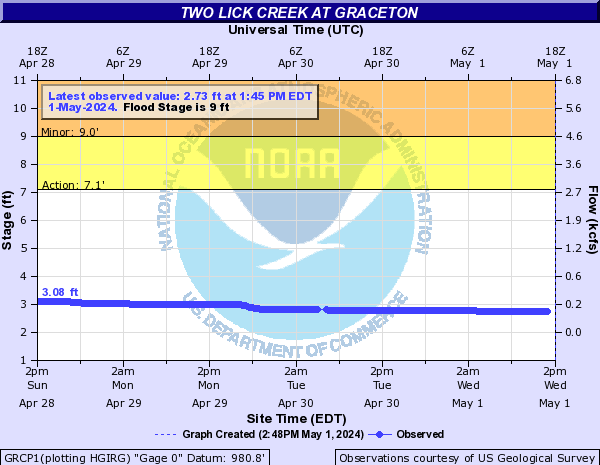
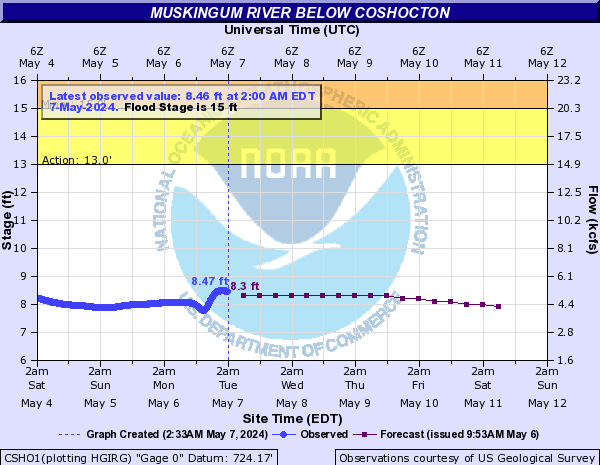
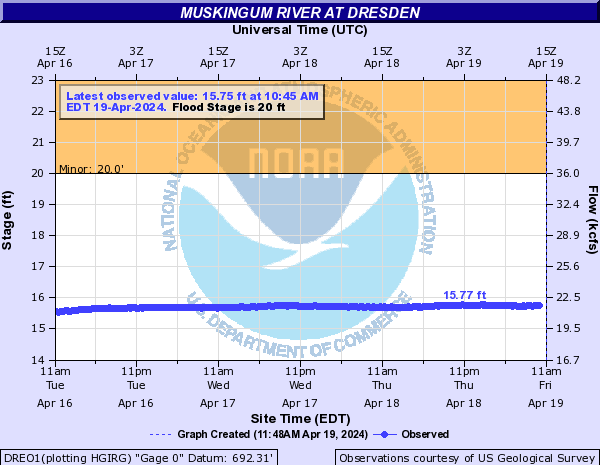
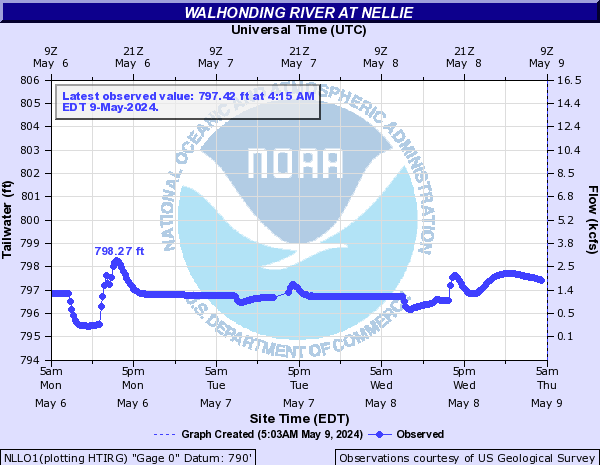
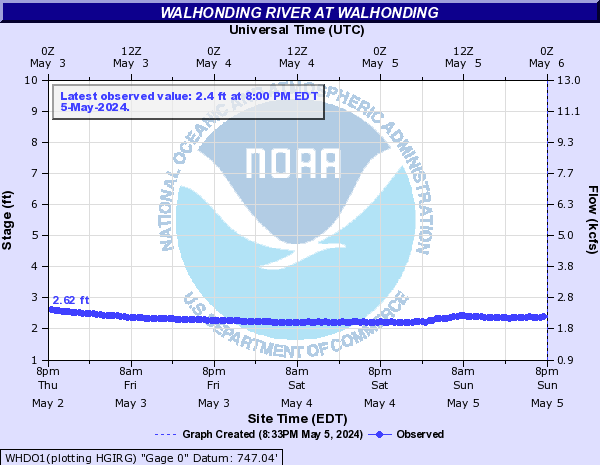
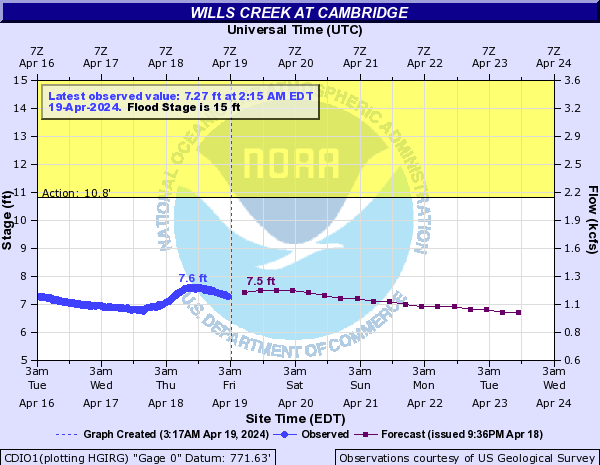
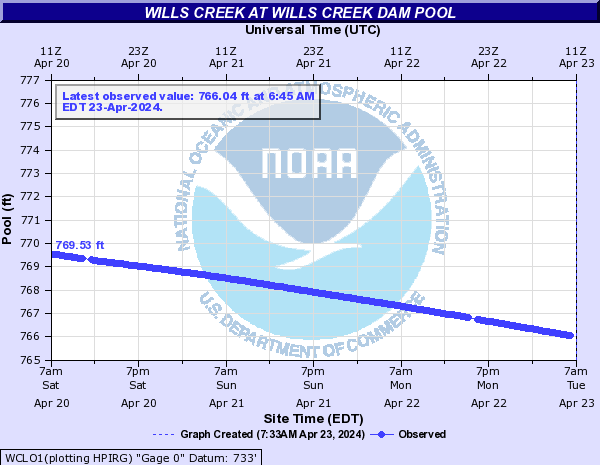
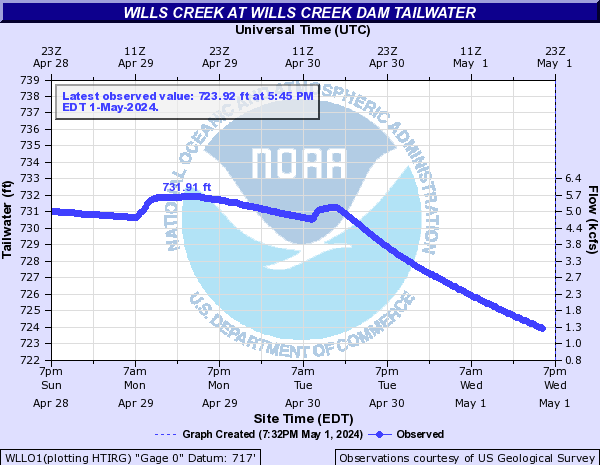
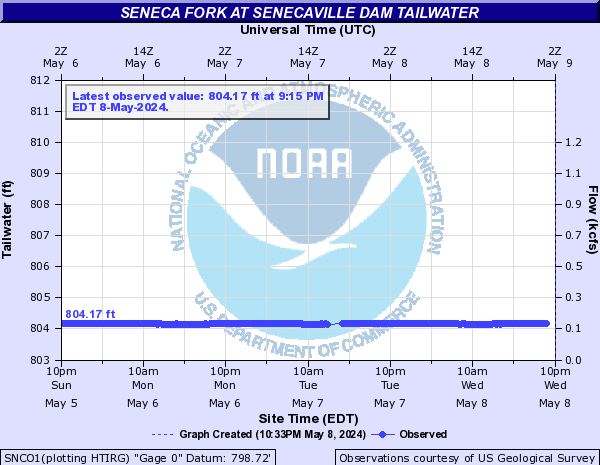
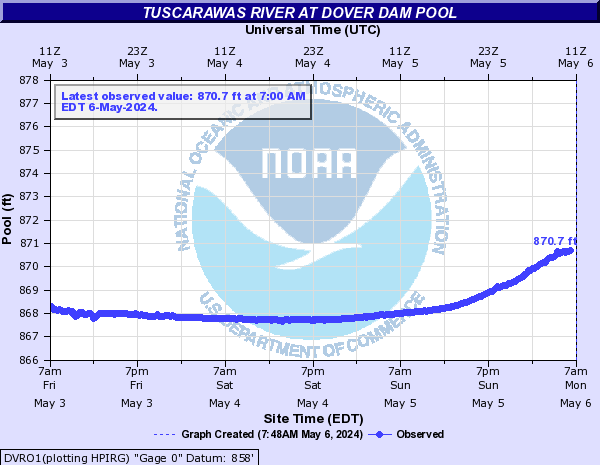
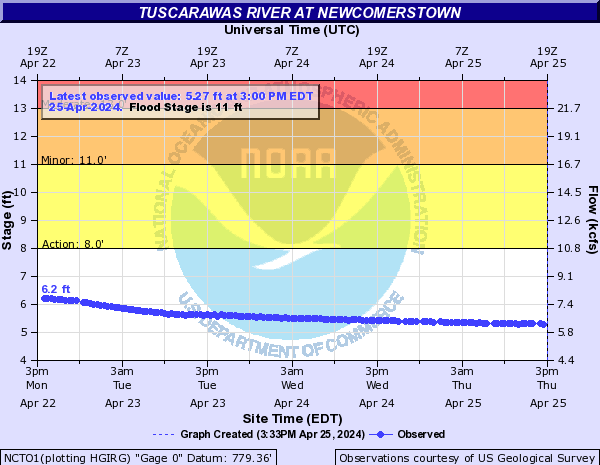
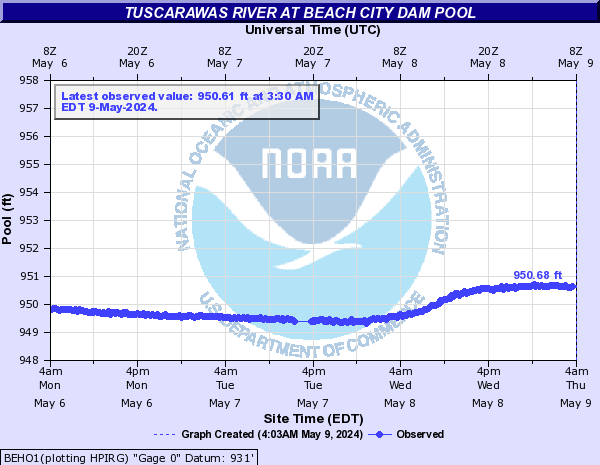
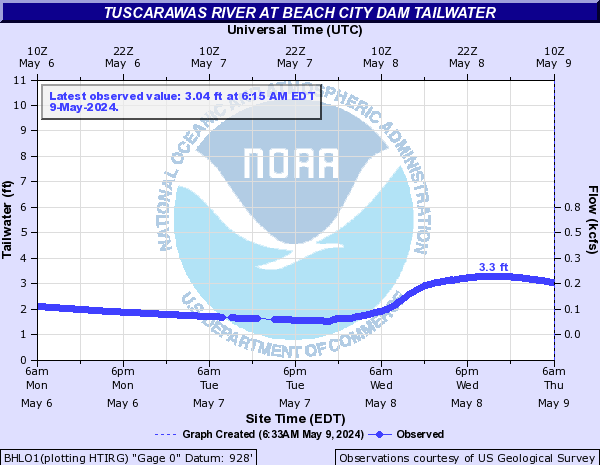
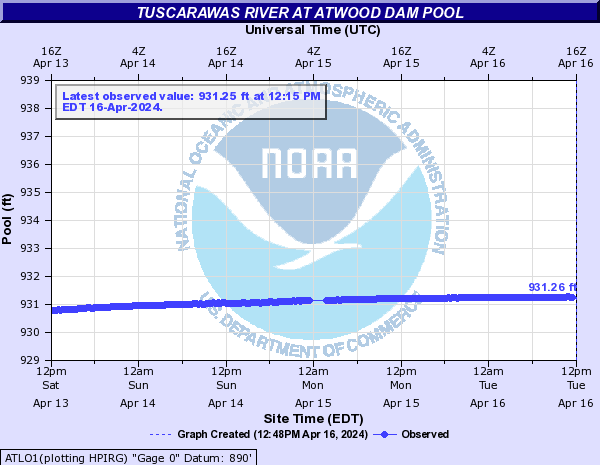
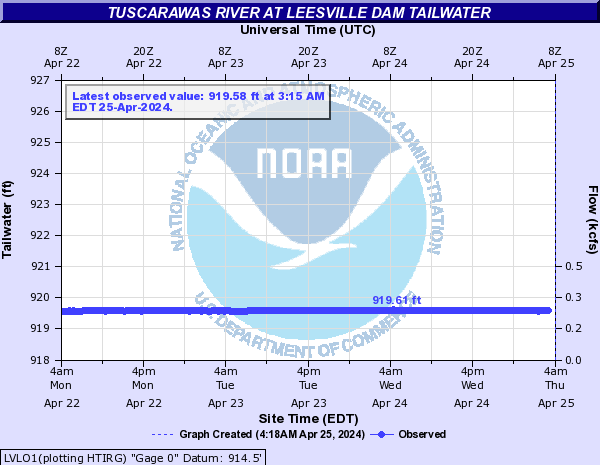
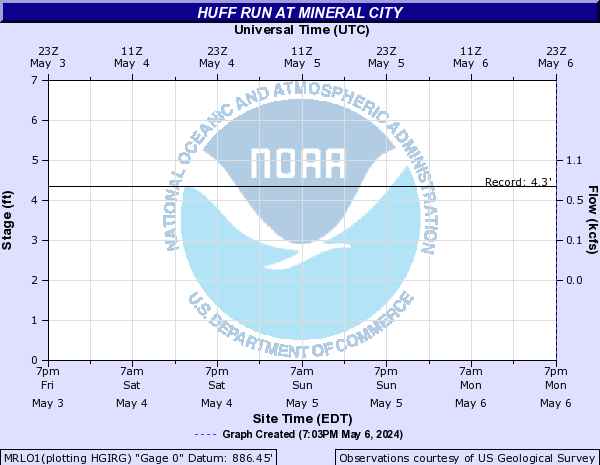
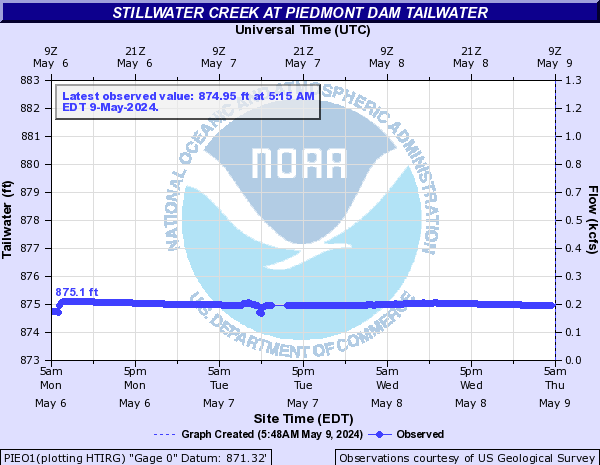
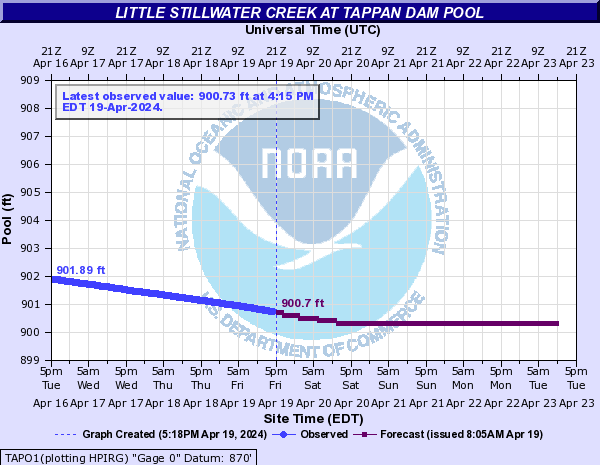
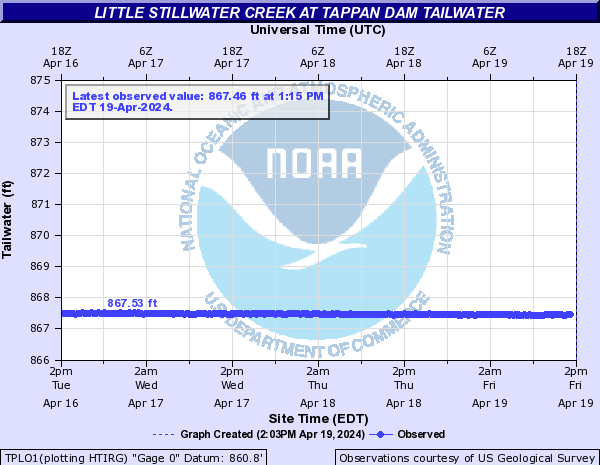
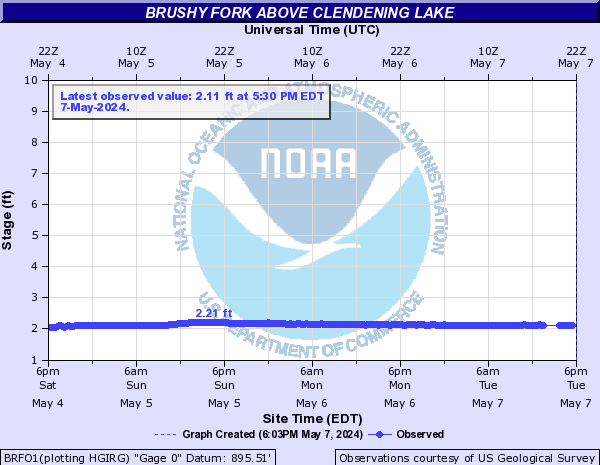
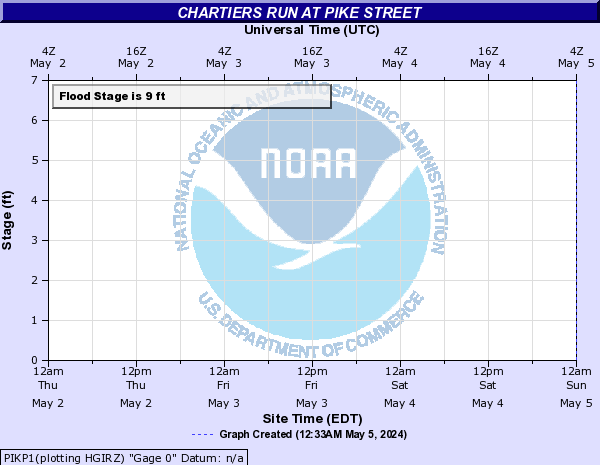
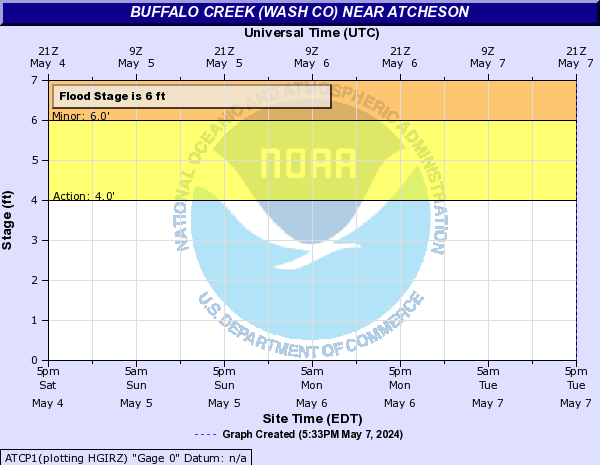
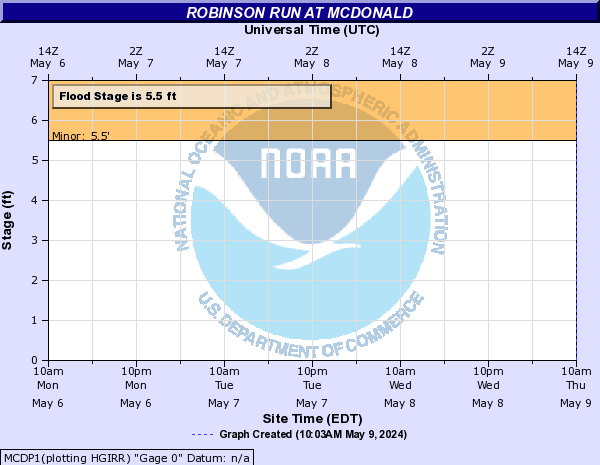
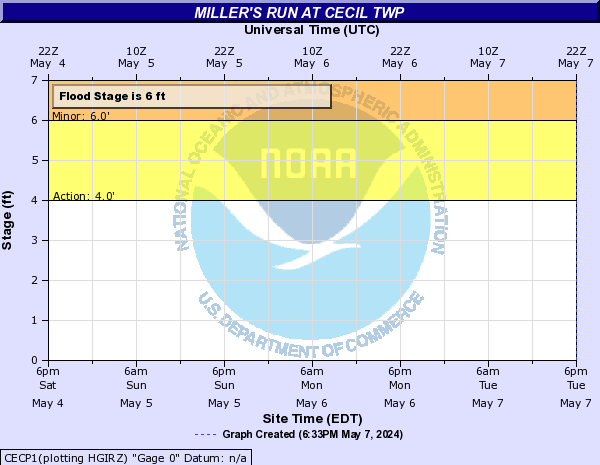
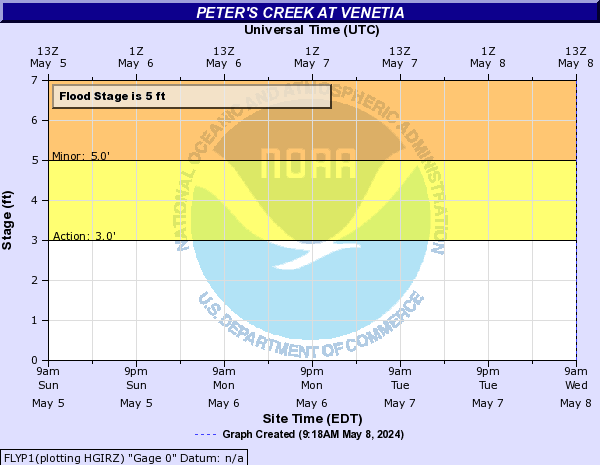
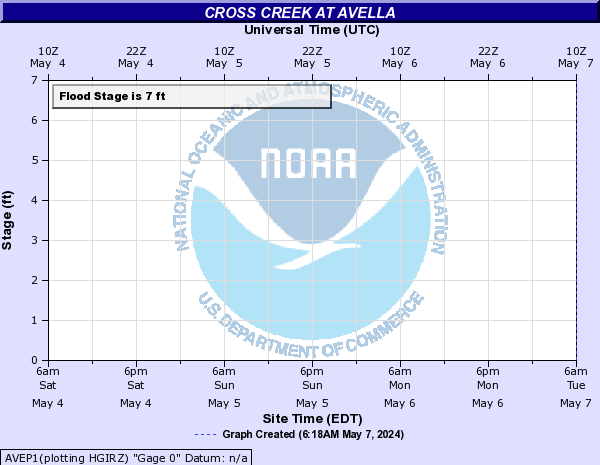
| Real-Time River Monitor
Mouse over each site to display hydrograph. Hydrographs (showing stages and flows over time) are available through AHPS (Advanced Hydrologic Prediction Service) by clicking site names. |
|
|||||||||||||||||||||||||||||||||||||||||||||||||||||||||||||||||||||||||||||||||||||||||||||||||||||||||||||||||||||||||||||||||||||||||||||||||||||||||||||||||||||||||||||||||||||||||||||||||||||||||||||||||||||||||||||||||||||||||||||||||||||||||||||||||||||||||||||||||||||||||||||||||||||||||||||||||||||||||||||||||||||||||||||||||||||||||||||||||||||||||||||||||||||||||||||||||||||||||||||||||||||||||||||||||||||||||||||||||||||||||||||||||||||||||||||||||||||||||||||||||||||||||||||||||||||||||||||||||||||||||||||||||||||||||||||||||||||||||||||||||||||||||||||||||||||||||||||||||||||||||||||||||||||||||||||||||||||||||||||||||||||||||||||||||||||||||||||||||||||||||||||||||||||||||||||||||||||||||||||||||||||||||||||||||||||||||||||||||||||||||||||||||||||||||||||||||||||||||||||||||||||||||||||||||||||||||||||||||||||||||||||||||||||||||||||||||||||||||||||||||||||||||||||||||||||||||||||||||||||||||||||||||||||||||||||||||||||||||||||||||||||||||||||||||||||||||||||||||||||||


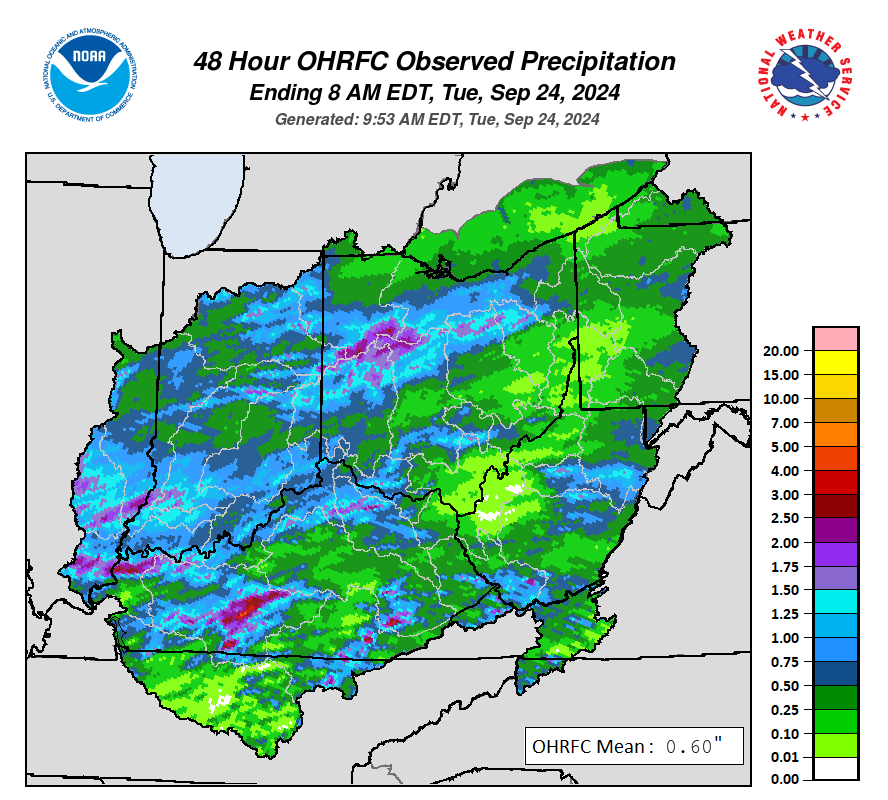
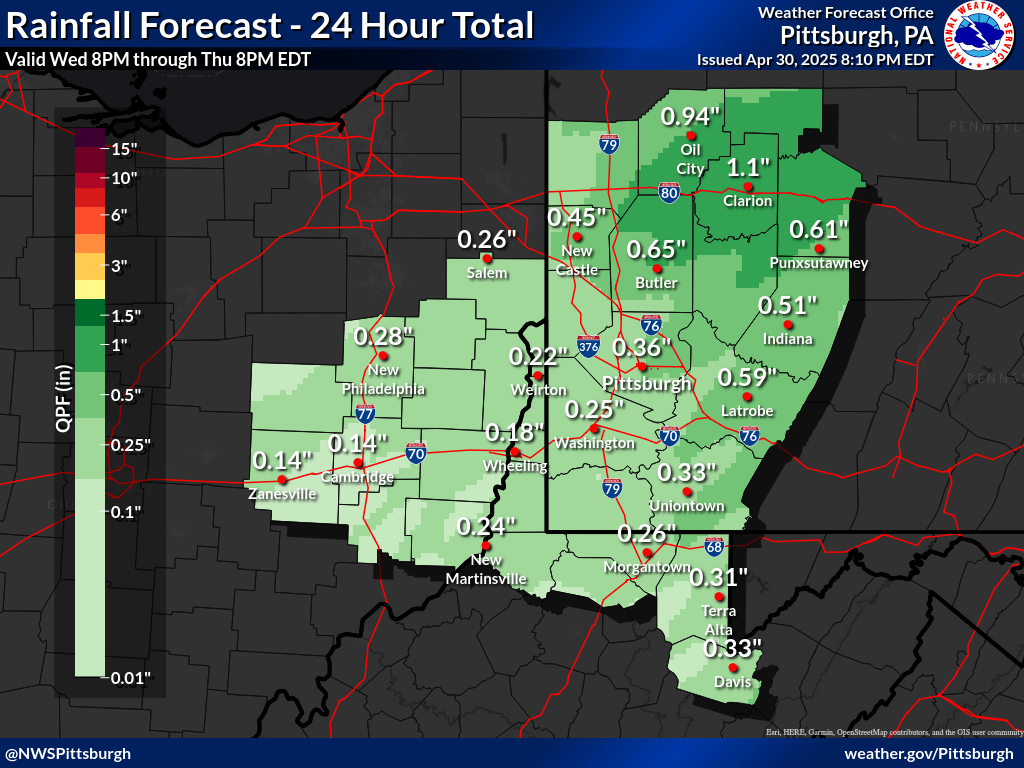
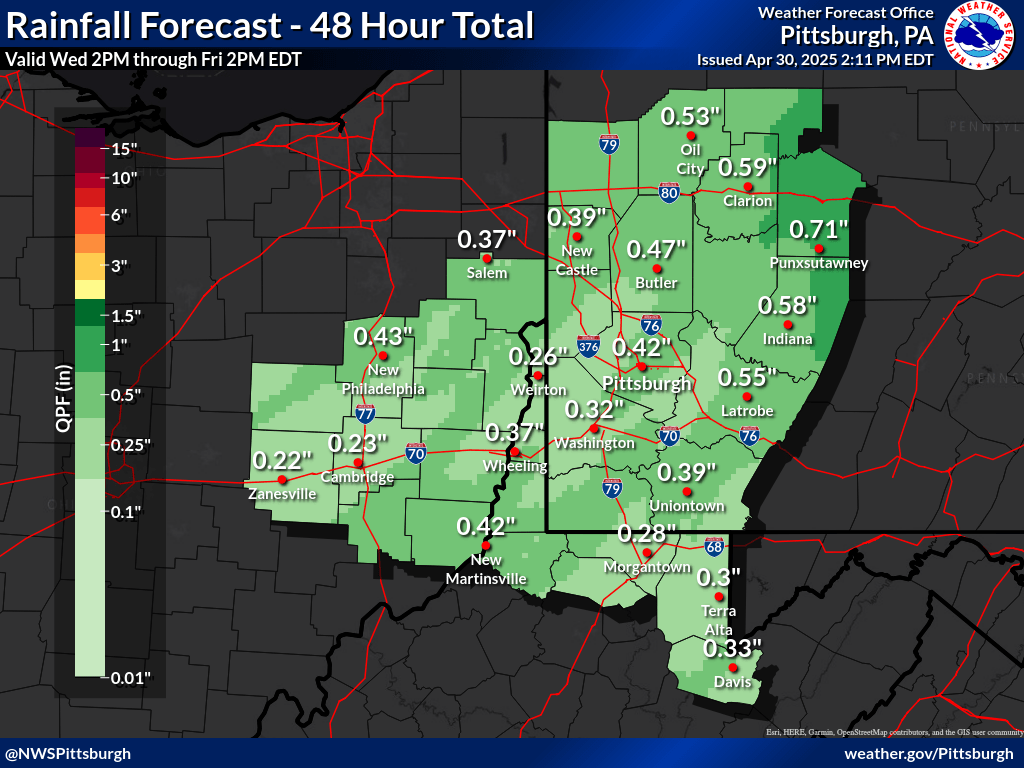
| OHRFC 24- and 48-hour Observed Precipitation | |||
 |
 |
||
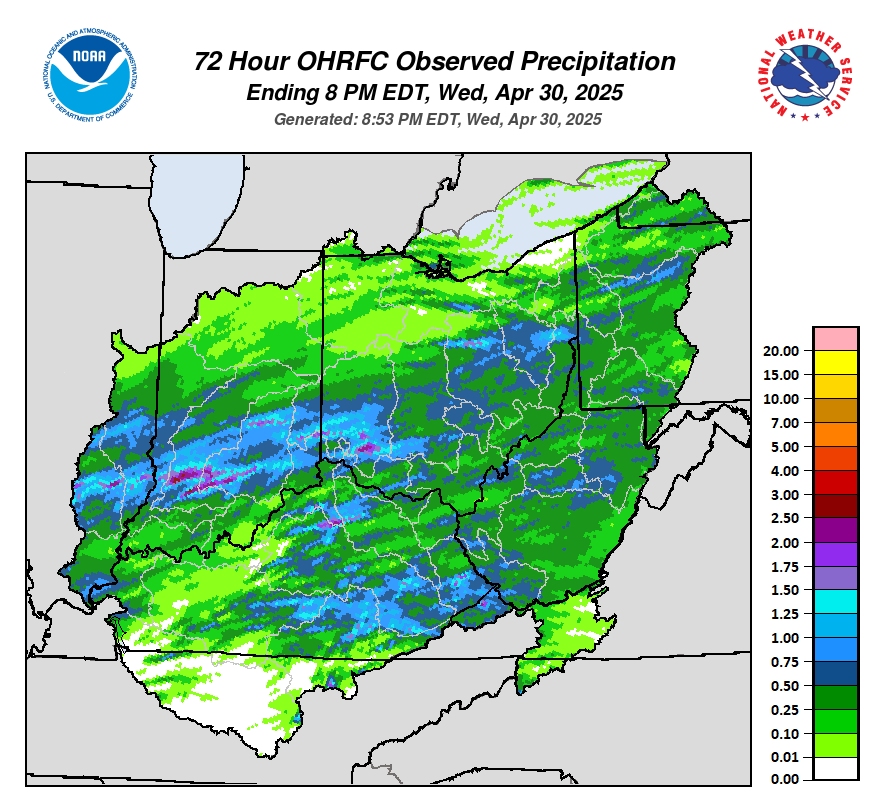
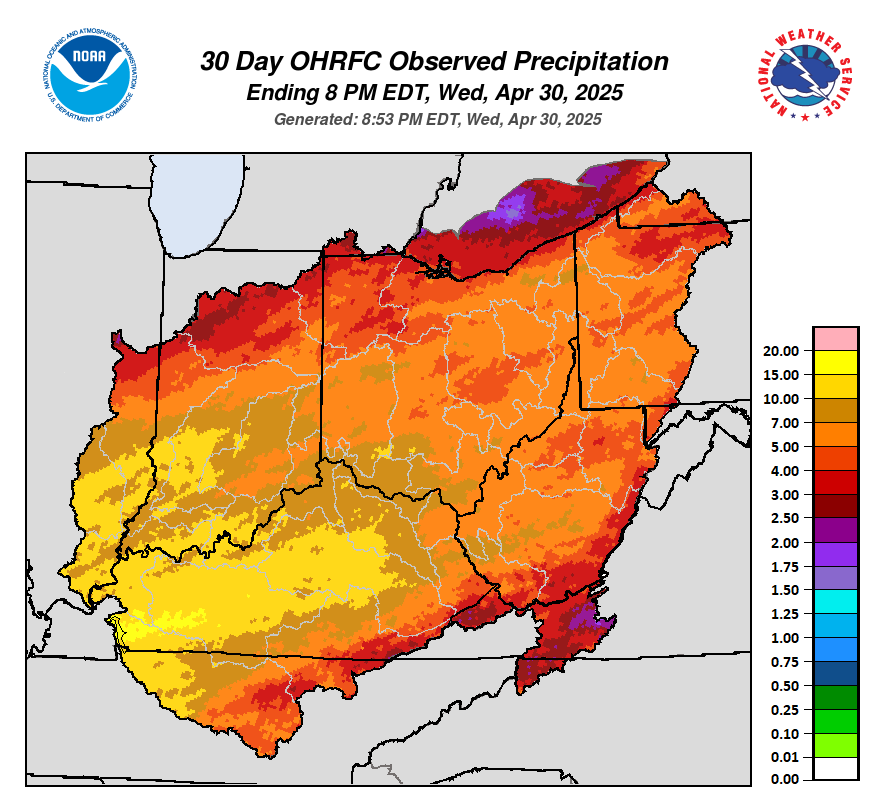
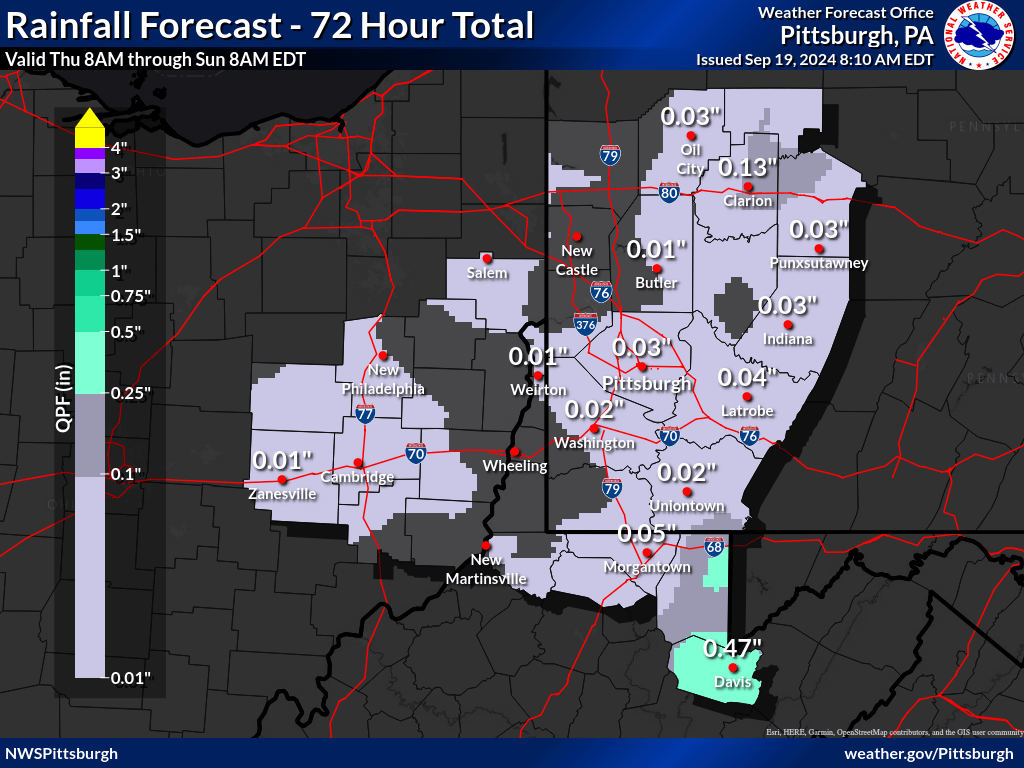
| OHRFC 72-hour and 30-day Observed Precipitation | |||
 |
 |
||
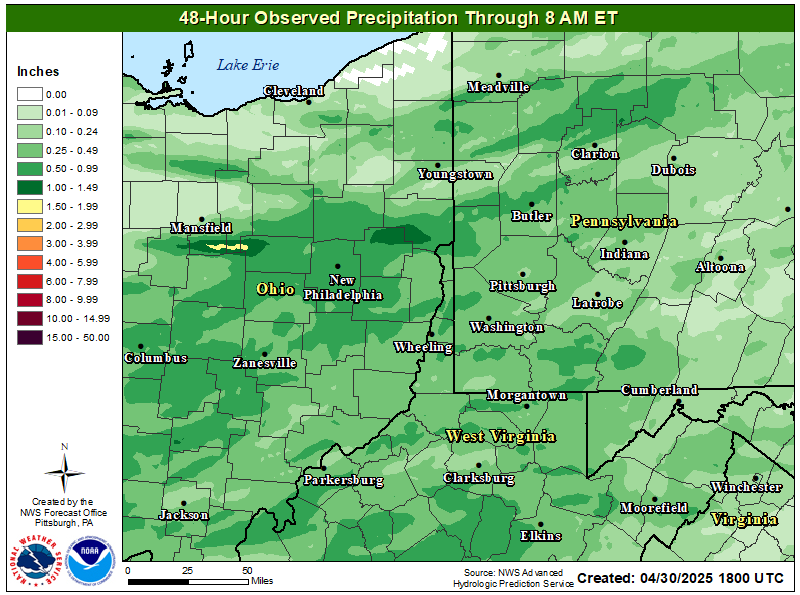
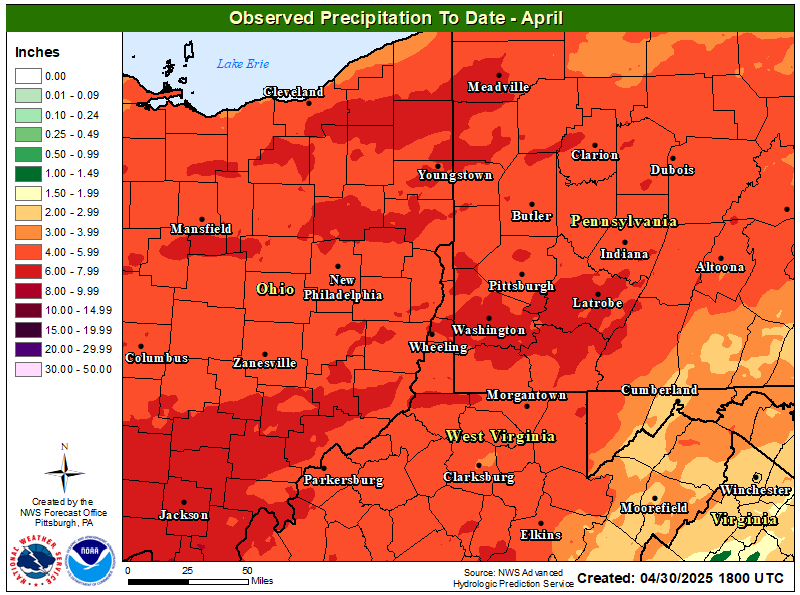
| 48-hour and Month-To-Date Observed Precipitation | |||
 |
 |
||
Additional Informational Links
| Daily Precipitation, Stages, and Temperature for: |
WFO Pittsburgh, PA |
WFO State College, PA |
WFO Charleston, WV |
WFO Cleveland, OH |
| IFLOWS Data For: | Ohio | West Virginia |
|
|
| Links to various archived data: |
WFO Pittsburgh Flash Flood Climatology |
CoCoRaHS -Volunteer Rain, Hail and Snow Observations |
NWS Archived Precipitation Maps |
USGS Hydro Climatology Data |
| Current River Status |
NWS Office of Water Prediction
Current Conditions Map

Additional Informational Links
| U.S. Geological Survey Stage and Streamflow Conditions for: |
Pennsylvania | Ohio | West Virginia | Maryland |
|
|
| U.S. Geological Survey Rivers and Lakes Water Levels for: |
Pennsylvania | Ohio | West Virginia | Maryland |
|
|
| U.S. Geological Survey Water Temperature for: |
Pennsylvania | Ohio | West Virginia | Maryland |
|
|
| NWS IFLOWS Data for: |
Pittsburgh, PA Forecast Area |
State College, PA Forecast Area |
Sterling, VA Forecast Area |
Charleston, WV Forecast Area |
Wilmington, OH Forecast Area |
Cleveland, OH Forecast Area |
| Other Useful Websites: |
Experimental USGS National Water Dashboard |
Pittsburgh Point Hourly Gage Reading |
U.S. Army COE Reservoir Pool and Release Report |
USGS Water Quality | NWS Pittsburgh Daily River and Lake Summary (RVD) |
|
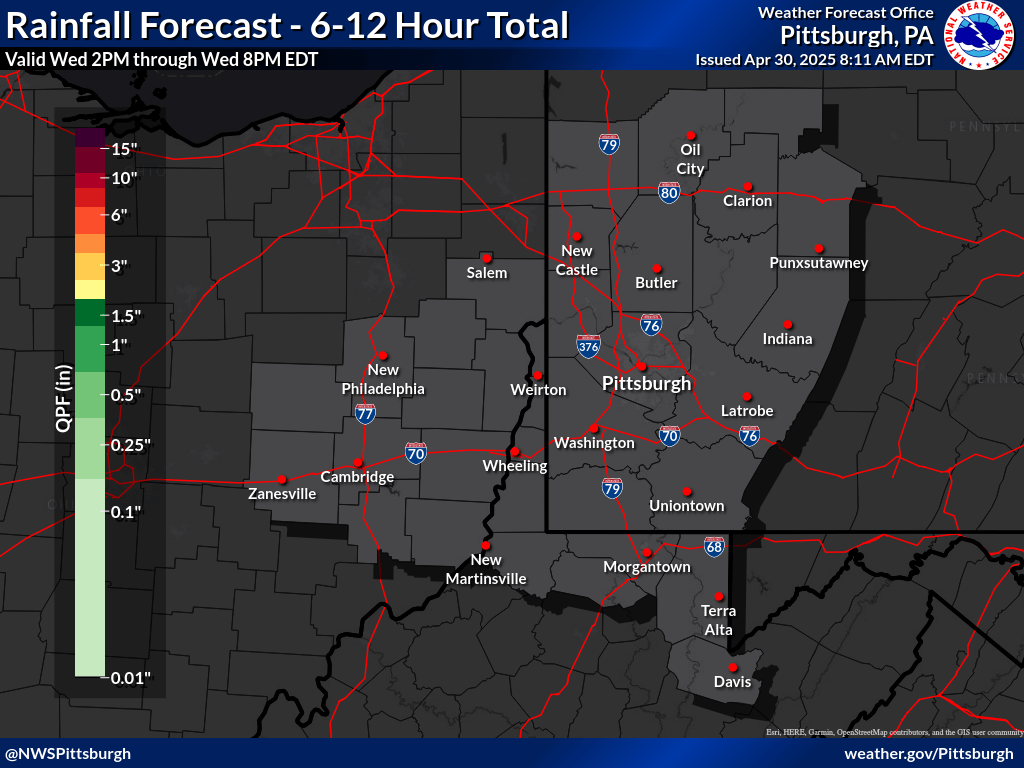
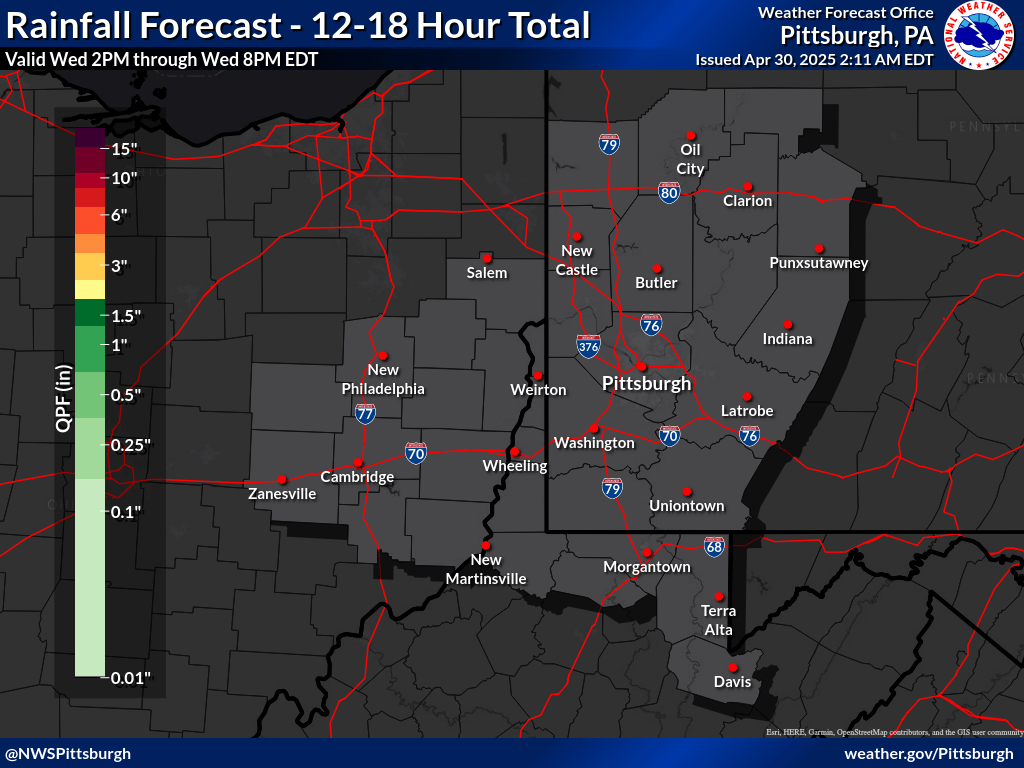
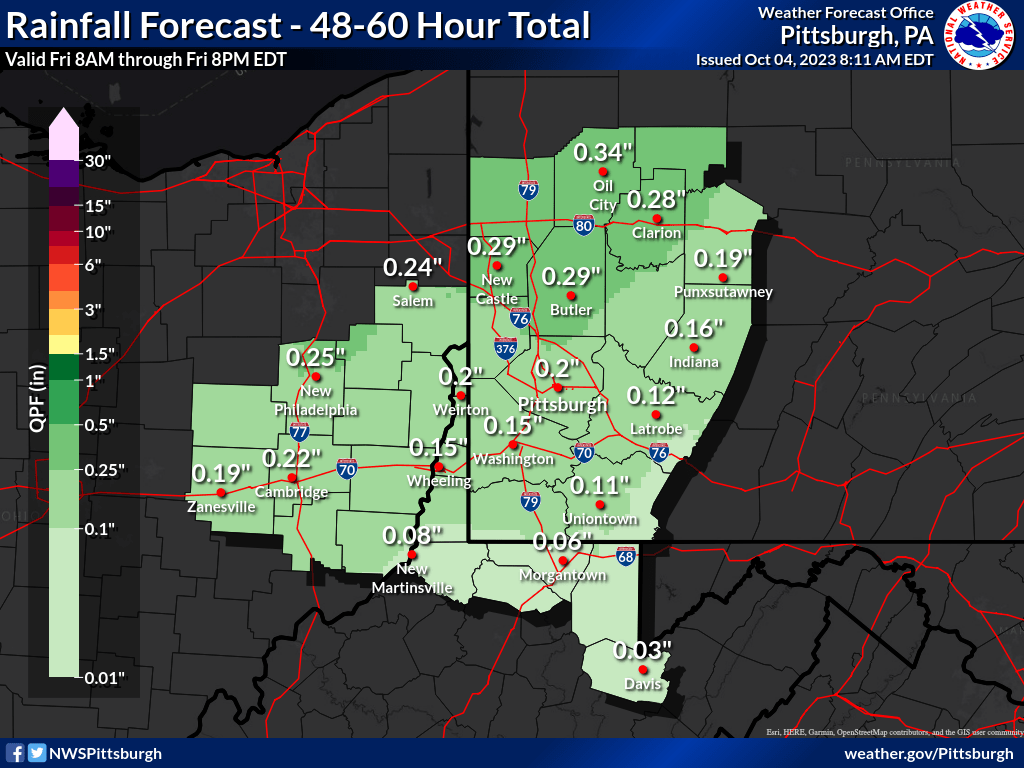
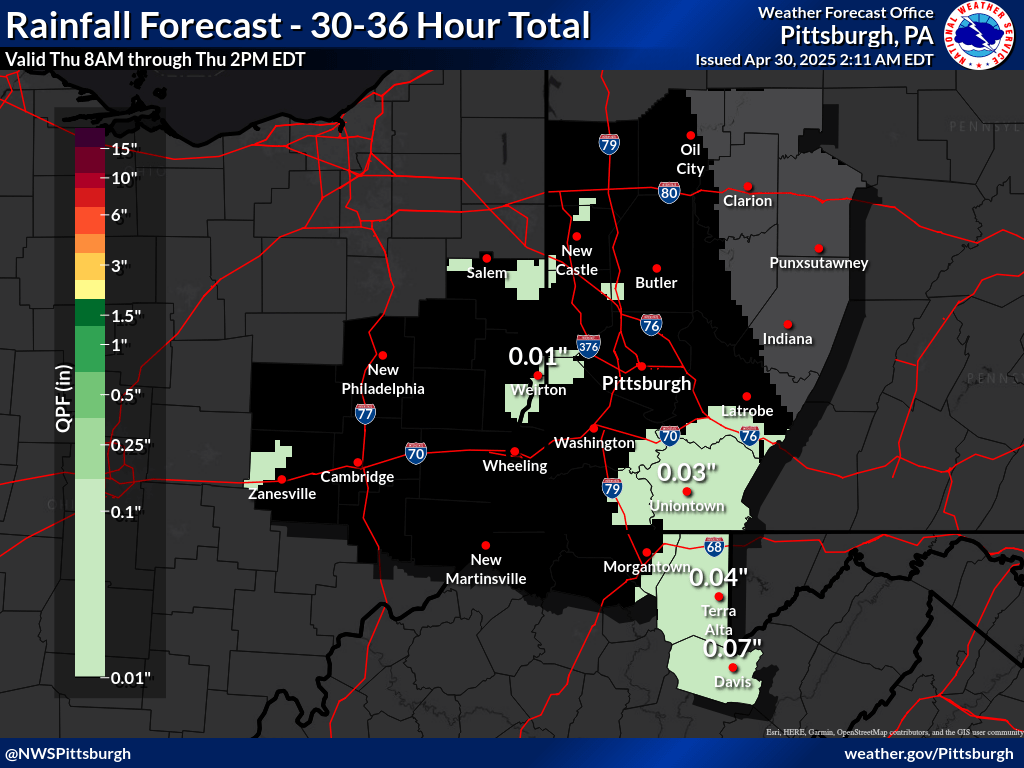
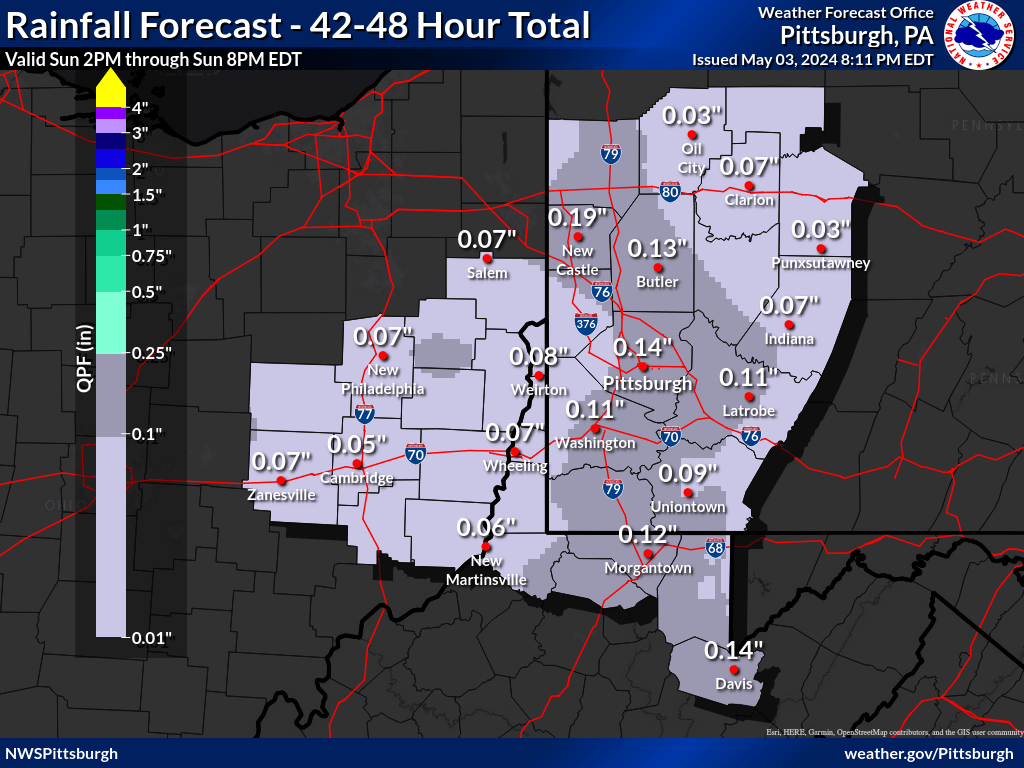
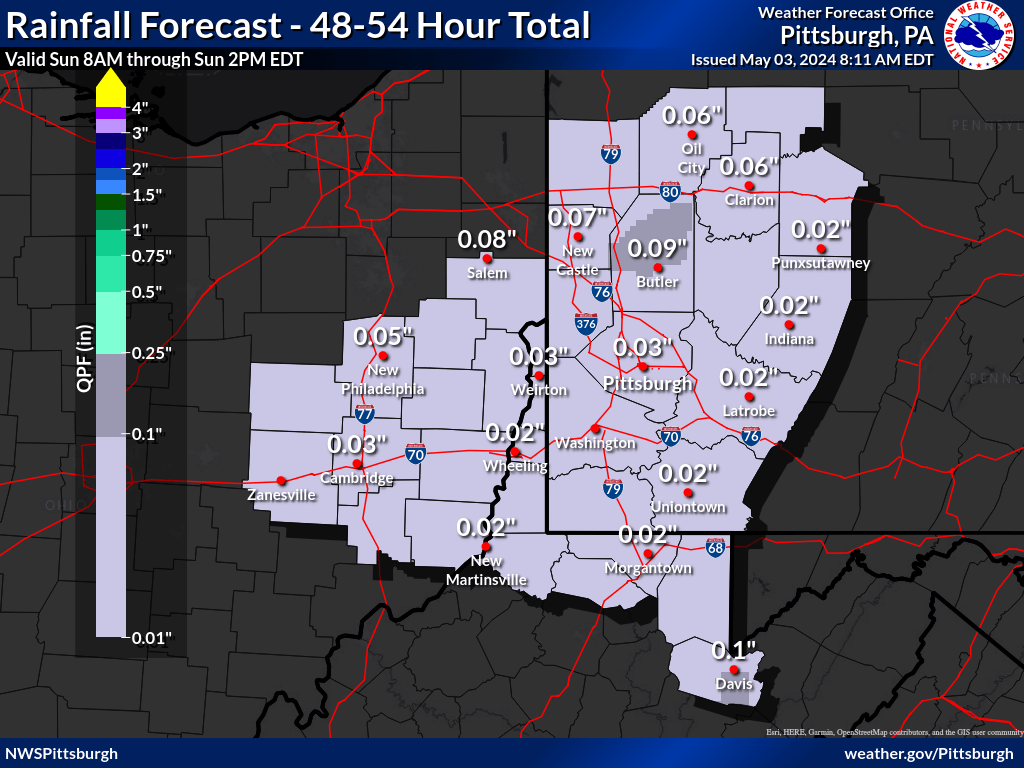
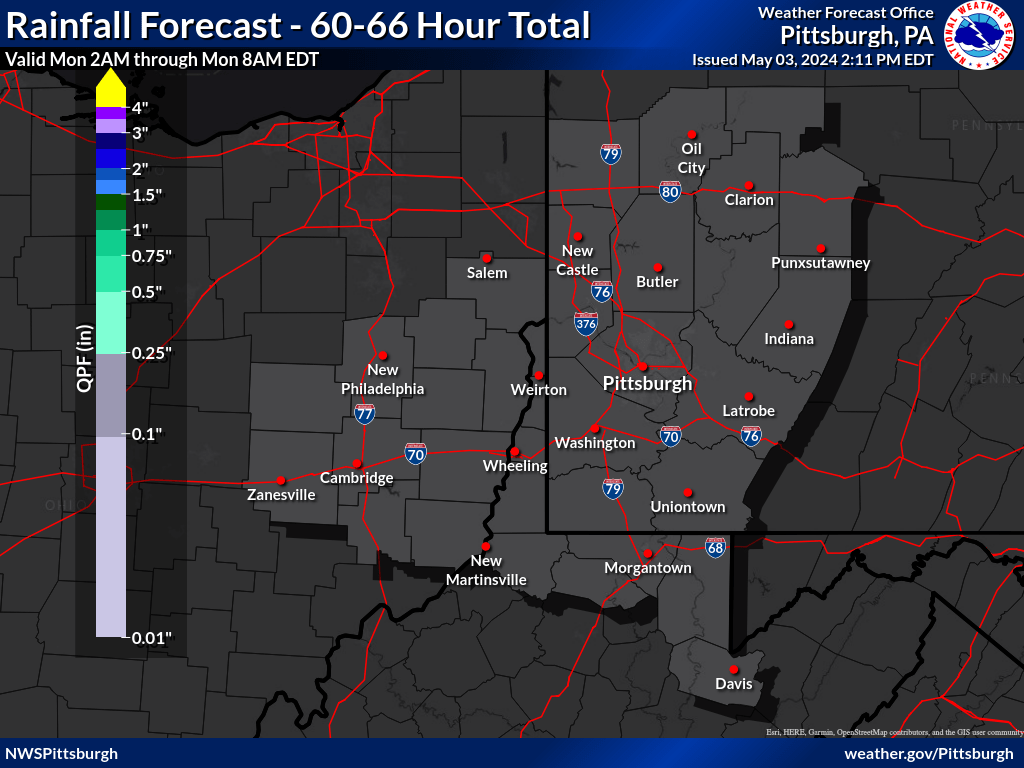
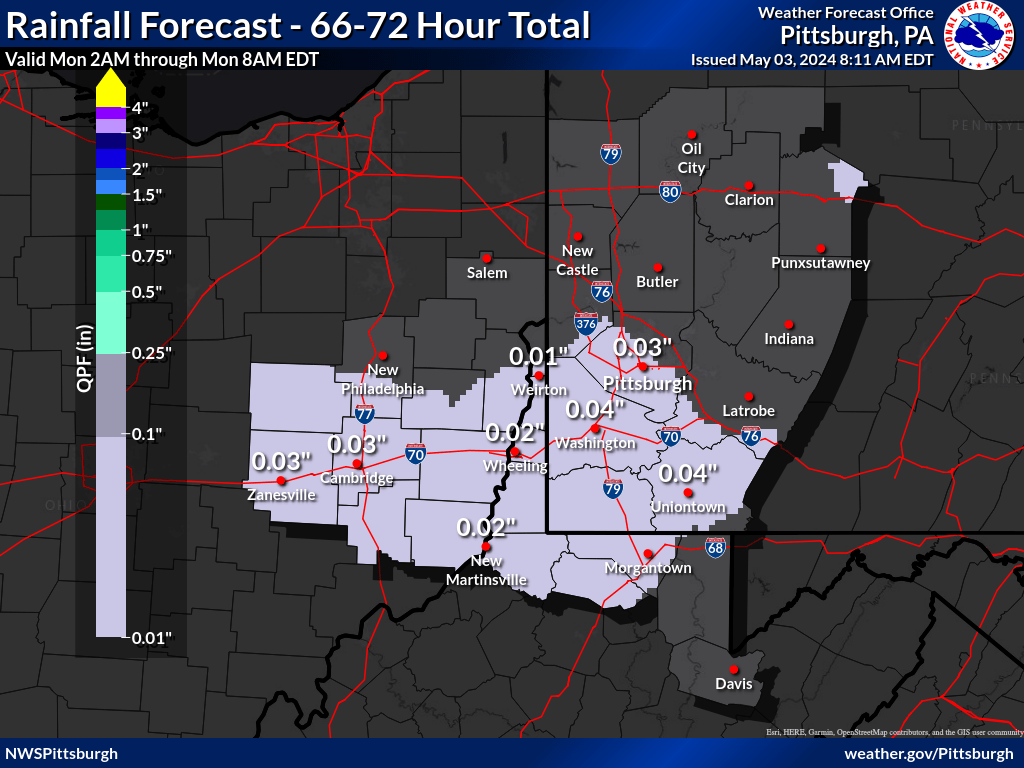
| Precipitation Forecasts | |||
| Day 1 | Days 1-2 | Day 1-3 | |
 |
 |
 |
|
| 0 to 6 hours | 6 to 12 hours | 12 to 18 hours | 18 to 24 hours | 24 to 30 hours | 30 to 36 hours |
 |
 |
 |
 |
 |
 |
| 36 to 42 hours | 42 to 48 hours | 48 to 54 hours | 54 to 60 hours | 60 to 66 hours | 66 to 72 hours |
 |
 |
 |
 |
 |
 |
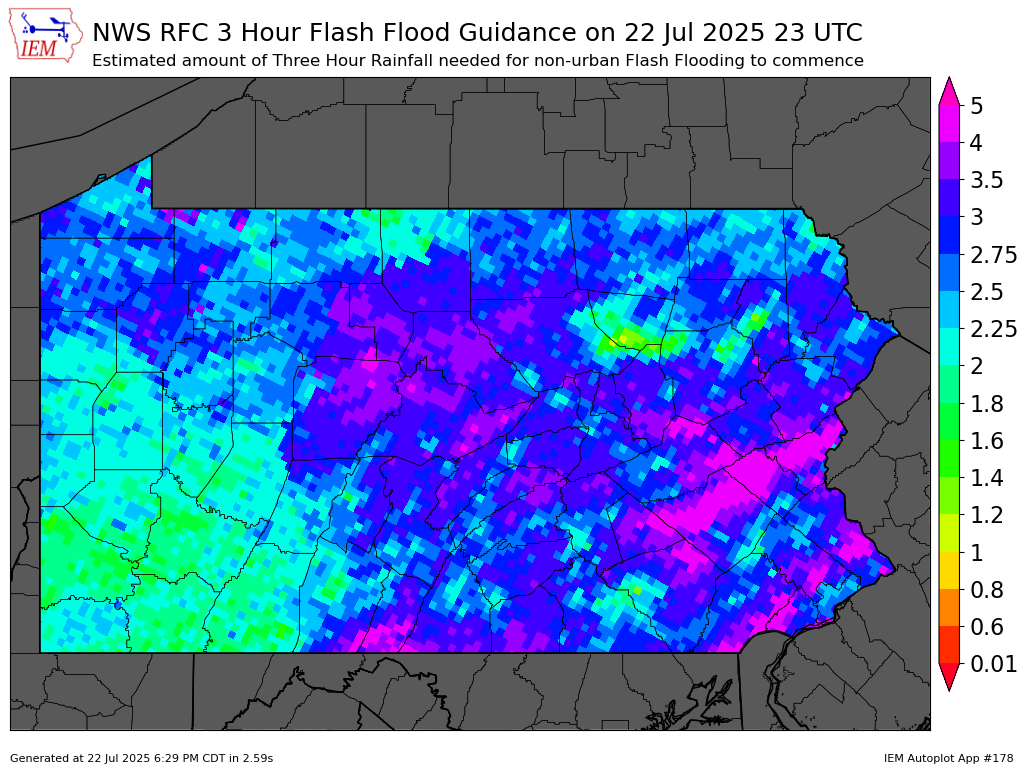
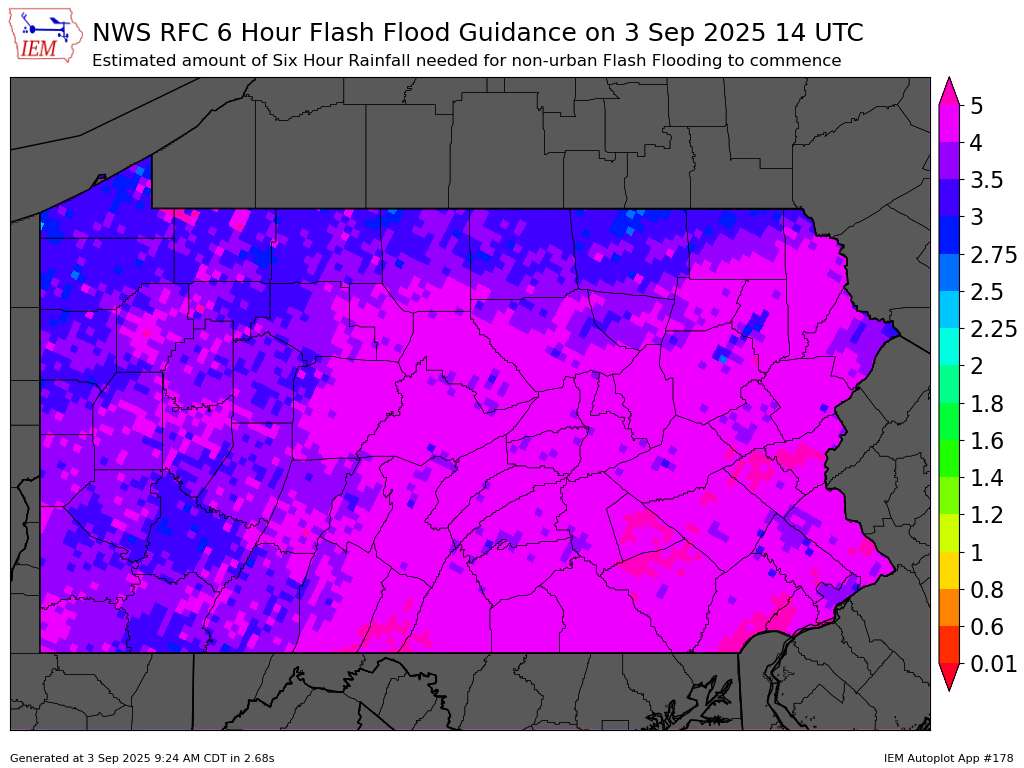
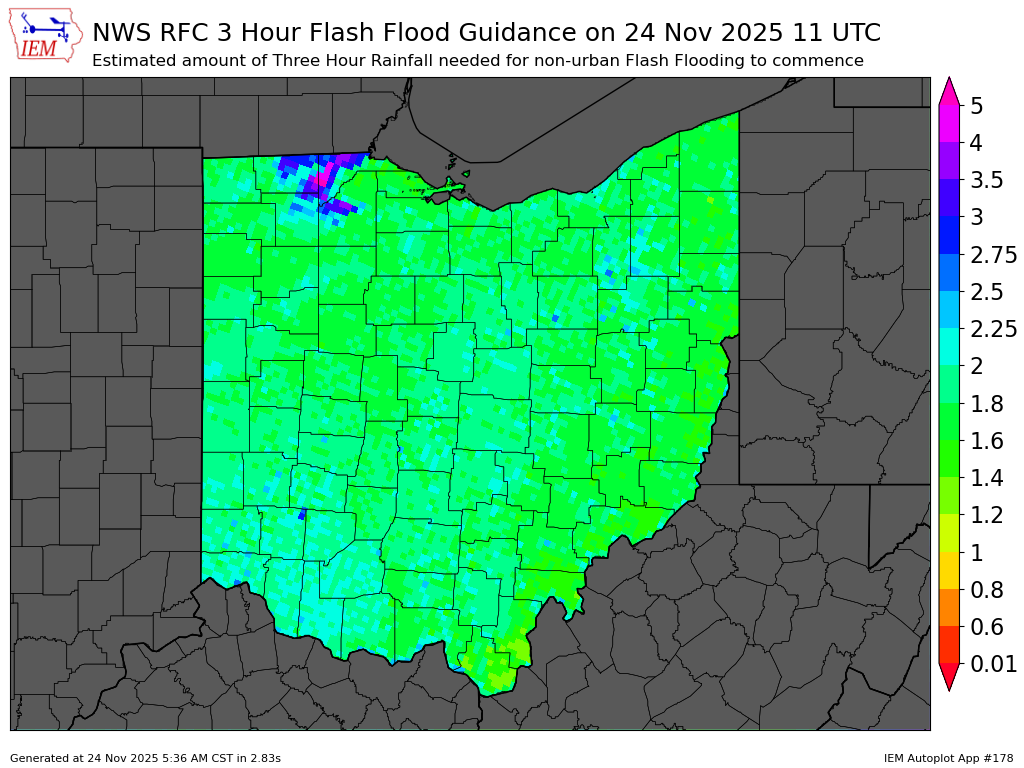
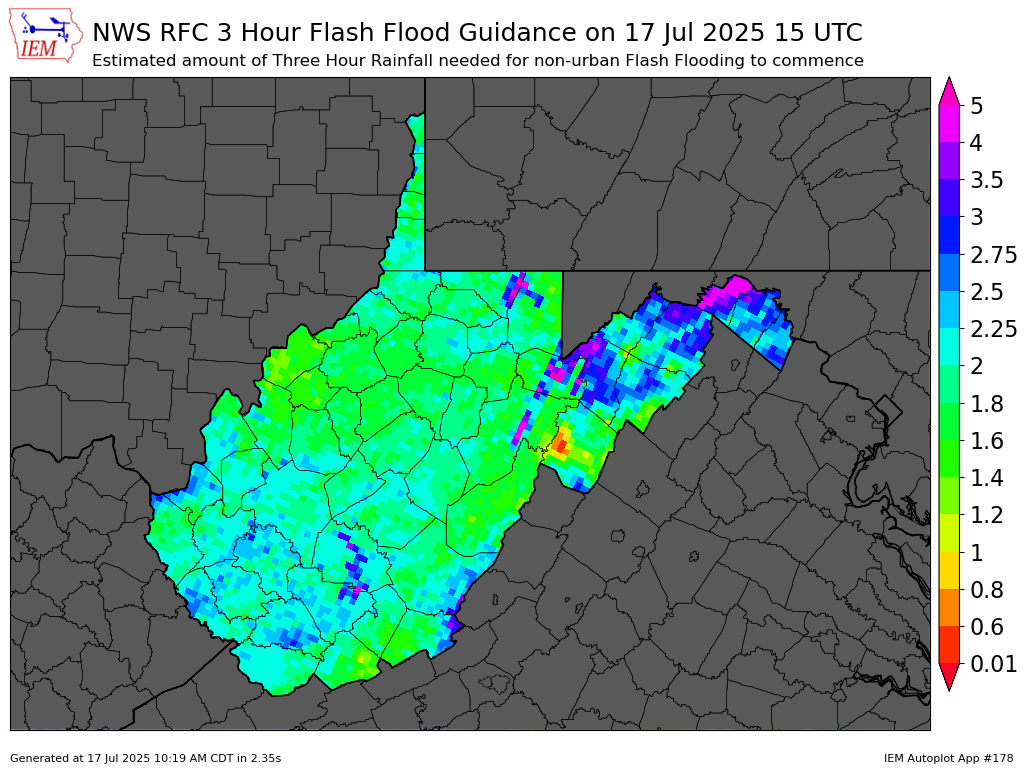
| Flash Flood Guidance |
Flash Flood Guidance (FFG) provides a general indication of the amount of rainfall evenly distributed over various durations (in hours), necessary to cause small streams to overflow their natural banks. During heavy rainfall, accurate interpretation of the guidance consists of the combination of rainfall that has already occurred plus any additional rainfall that can be confidently expected to fall over the same location in the immediate future.
It should be noted that FFG values represent estimates of average soil moisture and stream flow conditions. Flooding may occur with less rainfall than indicated in areas of high rainfall intensities, impervious surfaces, or steep slopes.
| 1 Hour | 3 Hour | 6 Hour |
 |
 |
 |
 |
 |
 |
 |
 |
 |
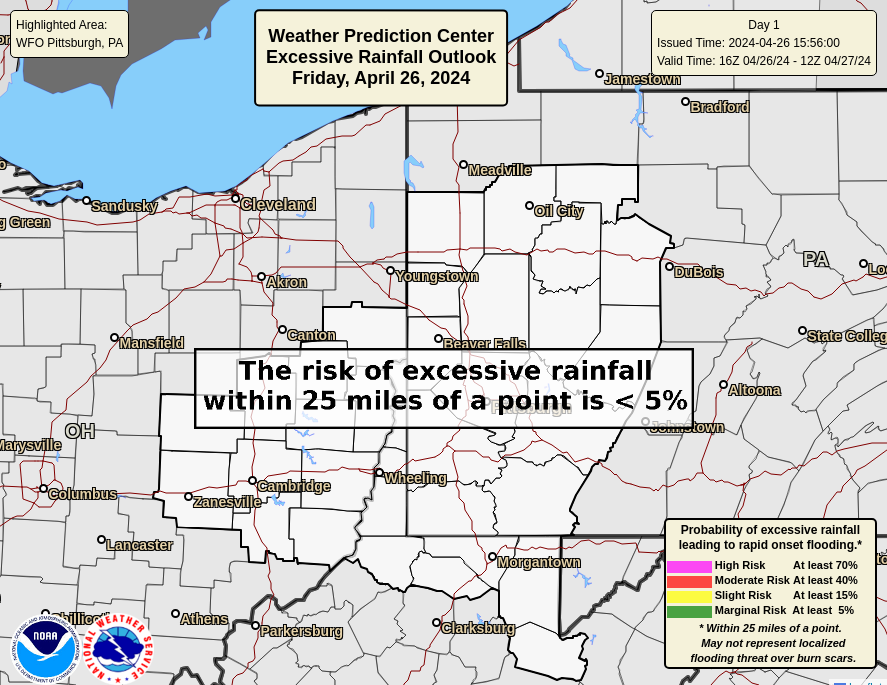
| Day 1 Excessive Rainfall Outlook | Day 2 Excessive Rainfall Outlook | Day 3 Excessive Rainfall Outlook |
 |
 |
 |
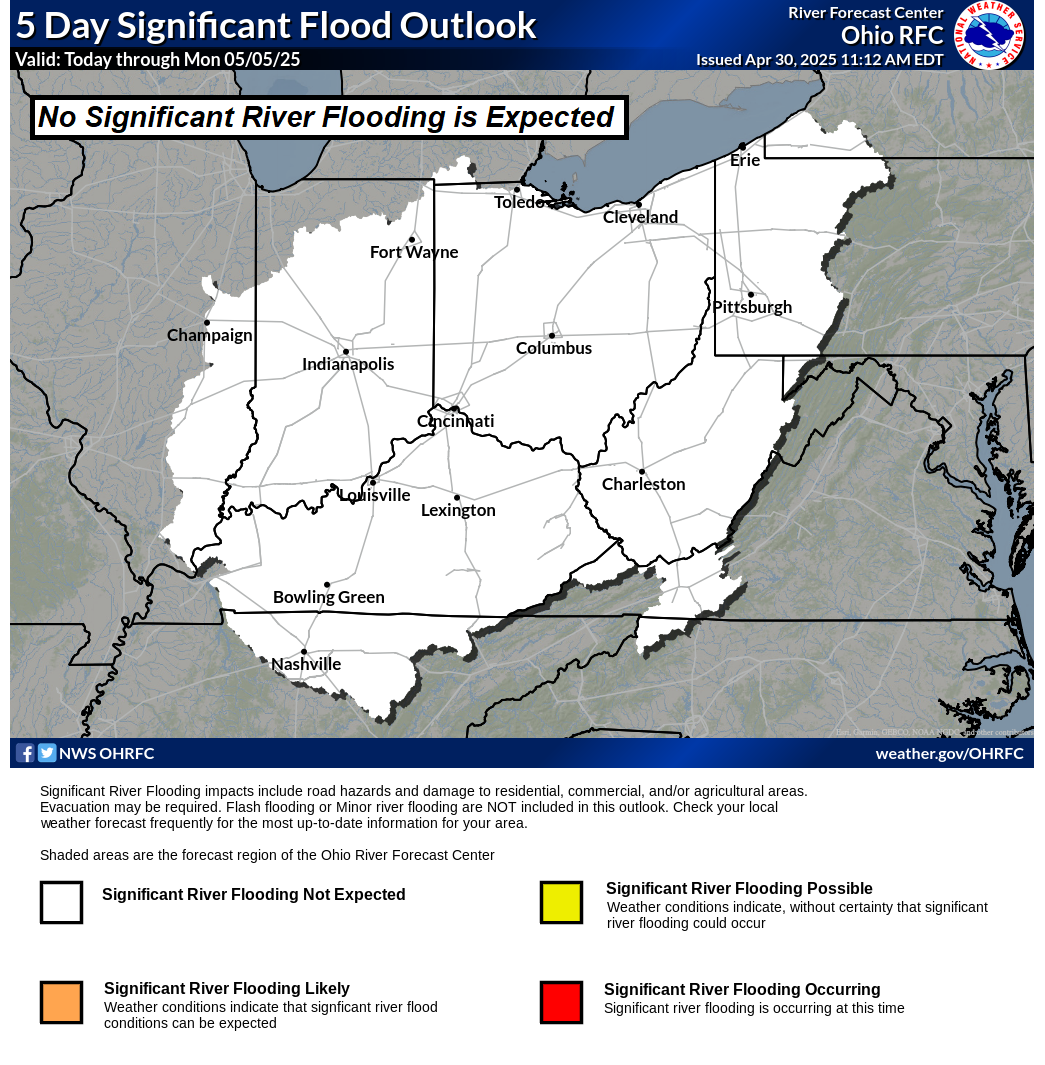
| Ohio Valley Flood Outlook |
 |
| Day 1 Precipitation | Day 2 Precipitation | Day 3 Precipitation |
 |
 |
 |
| Day 4-5 Precipitation | Day 6-7 Precipitation | 7-Day Total Precipitation |
 |
 |
 |
Additional Informational Links
| NWS Pittsburgh River Products: |
Daily River Forecast |
River Flow and Velocity Forecasts |
Flood Potential Outlook |
|
| Other Useful Links: |
Weather Prediction Center (WPC) |
Ohio River Forecast Center (OHRFC) |
Advanced Hydrologic Prediction Service (AHPS) |
Ensemble River Forecasts |
| Current Drought Monitor Status | |||
 |
|||
| WFO Pittsburgh Drought Information Statement- **Note: This product will be updated only as conditions warrant. | |||
| Pennsylvania Drought Monitoring Website | |||
| National Drought Monitoring Website | |||
| Great Lakes Ice and Temperature Analysis | |||
 |
 |
||
| NOHRSC National Observed Snowfall Map Analysis |
| Historical Flooding and Ice Jam Information | |||
| Do you have a river ice report and/or a report of ice jam flooding? Report it to us in the form below by selecting "River Ice/Ice Jams": | |||