Currency Valuation Models: How Are Exchange Rates Determined?

Different traders have different ways of determining a currency’s fair value price. Clearly, different expectations and different motivations are what make a market.
While many traders have their own decision rules and proprietary systems, there are currency valuation models and ways of looking at the currency markets that are the most common.
We’ll cover the basics of a few of these currency valuation models below.
First, what gives a currency value?
A currency has value if it functions as an effective medium of exchange and a store-hold of wealth. When we think about the US dollar, we know it has both.
Globally, we know that US dollars are 62 percent of foreign exchange reserves, 62 percent of international debt, 57 percent of global import invoicing, 43 percent of FX turnover, and 39 percent of global payments.
The euro is close in terms of global payments, but the US dollar is far and away the most used currency in the world. Generally, the country with the world’s highest national income has the world’s global reserve currency. These regimes tend to change every so often.
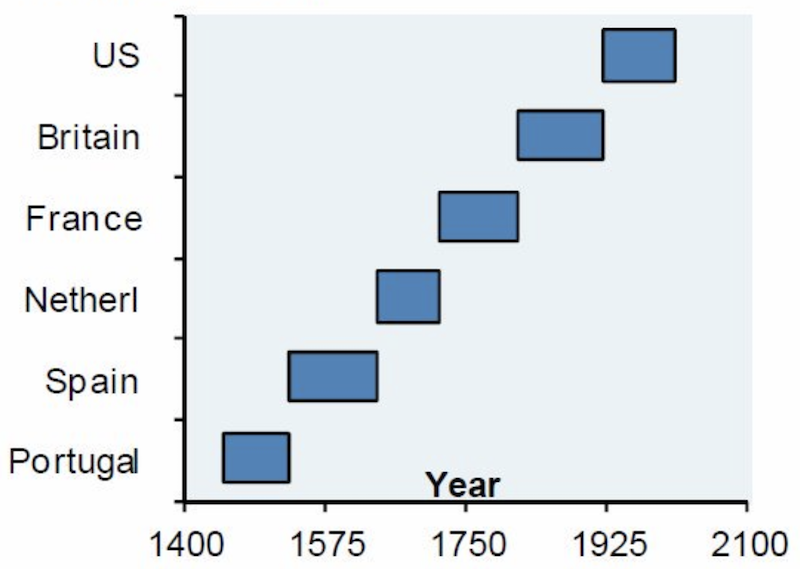
From the 1400s onward, we’ve seen the world’s reserve currency change from Portugal to Spain to the Netherlands to France to Great Britain to the US. Empires, and hence reserve currency status, don’t last perpetually.
A reserve currency or reserve asset is defined as a large quantity of currency – typically owned through sovereign debt denominated in that currency – that is maintained by central banks and other large institutional investors, such as standard commercial banks and non-bank institutions, such as hedge funds.
Central banks will primarily use them as reserves, which can help influence their own domestic exchange rate. For example, selling reserves to buy their own currency will help it appreciate relative to the currency being sold. Large investors will invest in currencies to speculate – i.e., bet on their price movements – or to hold as currency hedges.
Different currencies do well in different environments. For example, Australia’s economy still materially depends on commodity exports, which increase in demand when the economy does well.
So, the Australian dollar (AUD) is very pro-cyclical. When the economy does well, the AUD generally does well. When there are “risk off” episodes, the AUD typically sells off.
On the other hand, a currency like the Japanese yen (JPY) does well in risk off periods. Japan is a creditor country.
In other words, it has what’s called a positive net international investment position (NIIP), or net external assets higher than net external liabilities. It lends more to the rest of the world than it borrows.
During risk off periods in the market, Japan can pull back their assets abroad to be defensive, boosting the value of their currency. They also don’t have dollar debt related issues, or much debt denominated in a foreign currency (which can be dangerous because you have limited ability to control these liabilities).
The JPY is also a common funding currency because its interest rate is slightly negative. Traders like to borrow in yen to buy higher-yielding assets, commonly known as carry.
If you borrow at zero and invest in something that gives you 5 percent yield, you make money off that spread. You would also need to ideally hedge out the currency risk.
If, for example, you’re borrowing yen in the cash market, you could hedge that out by buying JPY contracts in the futures market (long JPY relative to your domestic currency) to offset your currency risk.
Of the seven main reserve currencies, this is one interpretation of how each one reacts based on what’s going on in the market and economy:
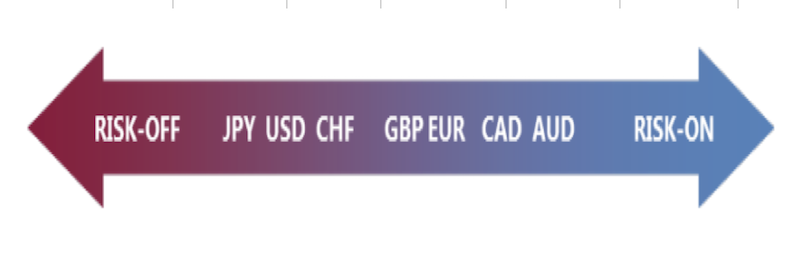
So, if you’re an Australian-based trader, you might consider that if your domestic currency is as pro-cyclical as it is, it might be beneficial to own smaller amount of yen and US dollars to offset some of that exposure.
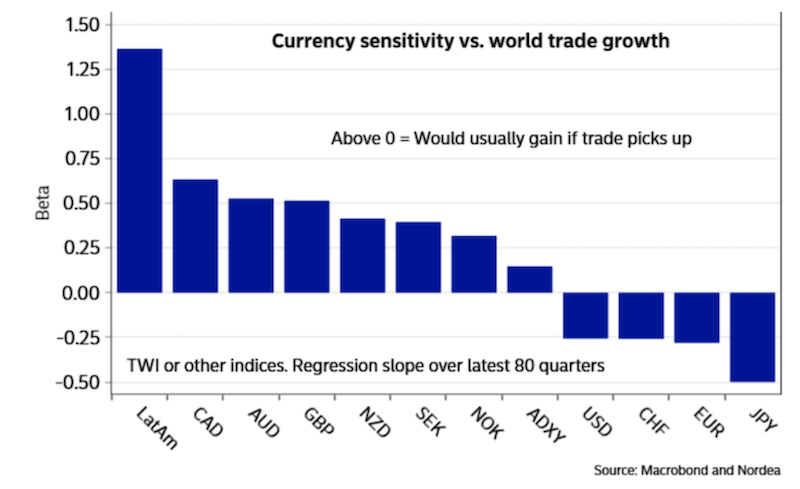
With recent trade headlines, here are the measured currency sensitivities to world trade growth. Latin American currencies are more pro-cyclically sensitive, as are currencies that rely heavily on commodity exports, while the JPY is counter-cyclical.
Alternative currencies
There are also alternative currencies, or currency mediums and/or wealth store-holds that are not government-backed systems.
Gold
Throughout history, commodities have been used as a means of payment and to store wealth. Most commonly, this has been gold and, to a lesser extent, silver.
This helps to theoretically stabilize a currency’s value as gold and silver are not subject to large swings in their demand. However, neither (and nothing, in general) is perfect.
Oil could also in some form be a currency, as an asset that will always in some form have value, though neither it nor precious metals are very effective as a transactional medium.
Oil is much less effective than gold because of frequent material changes in its demand. Tying a currency to a commodity-based system can also be excessively onerous in that it limits the amount of money and credit that can be created.
Gold’s value mirrors currency and reserves in circulation globally relative to the global gold supply. As money is depreciated, gold’s value tends to go up in conjunction. For example, below we can see its value in relation to the amount of negative yielding debt.
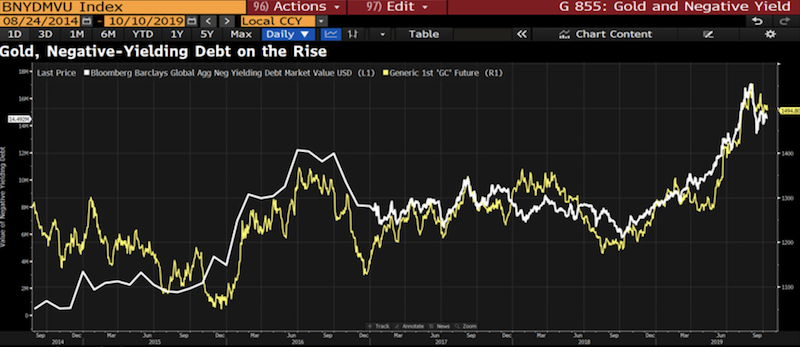
Central banks trust gold as a source of reserves and large institutional investors trust it as a hedge against the depreciation of fiat currency.
Cryptocurrencies
Cryptocurrencies eventually have potential in a variety of ways. But they have a very long way to go to be accepted as viable stores of reserves by central banks or as currency hedges for large institutional investors.
Right now, cryptocurrency markets are heavily tied to speculative activity and have not been well-established in higher-level value creation purposes.
Bitcoin, the most popular cryptocurrency, is an interesting store of wealth-like alternative. It has limited supply and you can move it places.
But if you look at the sources of demand, central banks aren’t going to buy it as a reserve asset. Institutional investors don’t value it much as a currency hedge when real interest rates become unacceptably low.
It’s a speculative asset where the buyers and sellers are mostly using it for purposes of reselling. It did poorly in the Covid-19 downturn.
As a speculative instrument, it’s one of the first types of things that people are going to want to sell to raise cash in bad financial times. So its diversification value appears to be relatively low.
When there’s a lot of money and debt creation going on, all that liquidity has to go somewhere so a lot of it goes into riskier, speculative assets.
A currency has three main characteristics or properties:
a) a medium of exchange
b) a store of wealth
c) the government wants to control it
It’s not really A because you can’t buy much with it.
It’s not really B because it’s too volatile because of the speculative nature of it.
And it’s not C as an off-the-grid payments system.
Regarding point C, if bitcoin becomes material, various governments are probably going to use whatever regulatory teeth they have to try to prevent ownership of it. (Even gold has been banned by governments throughout history, including in the US from 1933-1975 (some restrictions were loosened in 1964).)
This article will focus on national currencies, which are a function of the underlying economics of individual countries of jurisdictions.
Currency Valuation Models
We’ll cover what are broadly the five most common currency valuation models:
- Real effective exchange rate (REER)
- Purchase price parity (PPP)
- Behavioral equilibrium exchange rate (BEER)
- Fundamental Equilibrium Exchange Rate (FEER)
- Macroeconomic Balance (MB)
Real effective exchange rate (REER)
The real effective exchange rate (REER) is determined as the weighted average of a country’s currency relative to basket of other currencies. The weights are a function of the relative trade balance of a country’s currency against each country in the basket.
Formulaically, REER can be expressed as:
REER = (E(a) x P(a)*/P) ~ (E(b) x P(b)*/P) ~ (E(c) x P(c)*/P)
Where:
E = nominal exchange rate
P*/P = ratio of the price levels
~ = “proportional to”
Another way to express it:
REER = ER^a x ER^b X ER^c x … x 100
Where:
ER = exchange rate of different individual countries;
The exponents (a, b, c, etc.) represent the trade allocation. For example, if a country does 30 percent of its trade with a particular country, the exponent would be 0.30.
A country’s REER can be found by taking the bilateral exchange rates between itself and all of its trading partners, then weighting by the trade allocation associated with each country and multiplying by 100 to form an index.
One of the implications of this formula is that if there is a real depreciation in a currency, net exports will increase.
This makes sense because if a currency depreciates in inflation-adjusted terms, this will make a countries goods and services cheap in comparison.
This boosts demand for them and hence exports will rise, holding all else equal.
Conversely, when a real exchange rate rises, this makes its goods and services expensive in comparison, reducing their demand holding all else equal, causing net exports to fall.
This is why many countries who use an export model to grow their economy will often want to see their currency depreciate.
Those focused on a consumption model of growth will want to see a stronger or at least a stable currency, as their currency can go further (i.e., buy more goods and services on the global market).
This also means that certain trade relationships have more of an influence on an exchange rate than others.
For example, the US has a larger trade relationship with the EU – or more precisely, countries that use the euro – than it does Brazil.
When the euro weakens against the USD, EU exports to the US become less expensive because the USD can buy more EUR on a unit for unit basis. To buy EU-based exports, US buyers (consumers, businesses, governments) need to convert their USD into EUR.
A move in the nominal EUR/USD exchange rate would have more of an influence in the USD- and EUR-based REER models than the weighting of the Brazilian real exchange rate because Brazil is much less of a trading partner by capital volume.
The dollar index (DX, published by ICE) is a weighted basket of exchange rates.
Currently, the index has the following approximate percentage weightings:
- Euro (EUR), 58 percent
- Japanese yen (JPY), 14 percent
- Pound sterling (GBP), 12 percent
- Canadian dollar (CAD), 9 percent
- Swedish krona (SEK), 4 percent
- Swiss franc (CHF), 3 percent
Purchasing Power Parity (PPP)
To compare economic productivity and living standards between countries, some macroeconomists will look at a metric called purchasing power parity (PPP).
PPP is a way that looks at the relative valuation of different currencies through a comparison of the pricing between different countries. The pricing comparison could be a specific good or a basket of different goods.
Mathematically, it can be represented as:
E = Pa / Pb
Where:
E = exchange rate between the two countries
Pa = price of the good in country A
Pb = price of the good in country B
Based on this idea, two currencies are in equilibrium with each other when the same good is priced the same in both countries taking into account the relative exchange rates.
To gain a meaningful understanding of the pricing differentials between countries, a representative basket of goods and services must be used, such as one that would represent the relative spending weights of all buyers in the economy.
This requires an enormous amount of data to be collected. To help with this process, in 1968, the United Nations and University of Pennsylvania developed a partnership, termed the International Comparison Program (ICP), to help facilitate this process.
The World Bank, on an every-three-years basis, will release a report comparing various countries in both US dollars and PPP terms.
The Organization for Economic Cooperation and Development (OECD) and International Monetary Fund (IMF) will use PPP metrics to help generate economic forecasts and extend policy recommendations.
The reports of these organizations can, in turn, impact financial markets.
Many currency traders will also use PPP metrics to help them find undervalued or overvalued currencies and inform trade recommendations.
Currency fluctuations can also influence the returns of foreign investments in financial securities. A bond yielding 10 percent in a foreign currency that sees a corresponding decline of 10 percent in the currency would generate no actual return.
Some macro-accounting measures will adjust GDP for PPP. This helps to convert nominal GDP into a figure that helps to better compare between countries with different currencies.
For example, let’s say a pair of shoes costs $100 in the US and £80 in the UK. To make this comparison fair, we need to account for the exchange rate. Say the GBP/USD currency pair is trading at 1.30. This mean the shoes in the UK cost the equivalent of $104.
The PPP between the two countries, only taking into account this pair of shoes, would be 104/100, or 1.04.
This means that if a UK consumer wanted to buy the shoes more cheaply, they could buy them in the US for $4 cheaper. This would convert pounds to USD, leading to a rise in the USD relative to the GBP, holding all else equal.
What are the flaws in PPP in practice?
Before using the concept of PPP in your trading, it’s important to understand its flaws. PPP will be more or less valid depending on the situation.
Trade frictions and transit costs
In our shoes example between the US and UK, a UK consumer may want to save $4 per pair and just buy them in the US. That may not be feasible due to matters like shipping and transit costs.
There may also be import duties that cause imported goods to trade more expensively in one country relative to another.
The free flow of trade activity will help support the validity of PPP; restricted activity will impair its relevance.
There is an associated time delay, which represents another cost (“cost of convenience”). Many will be willing to “pay” that $4 to receive an item almost immediately relative to having to wait for an elongated overseas shipping process.
Some goods are also not tradable. Electric power is produced and sold domestically, as is hairdressing. Perishable items, such as some forms of food, can also not be feasibly traded.
Input costs
In such indices as the Big Mac Index, input costs into the item, such as labor costs, maintenance, price of supplies, and so on, are not always traded between one country and another. These costs are not likely to run in parity with each other, especially not at the international scale.
Imperfect competition
Goods can be priced higher or lower in a country due to imperfect market competition.
If a company has a strong competitive advantage in a certain market due to strong market power, this may keep prices of goods higher or lower.
Because of a lack of perfect competition, expecting an eventual equilibrium in the prices of the goods, or a change in the exchange rate, is implausible.
Tax disparities
Taxes are another force that causes changes in capital flows.
Consumption and sales taxes, such as value-added tax (VAT) can cause prices to be naturally higher in one country relative to another.
Goods quality
Goods are not always of the same quality. Even seemingly comparable items (e.g., a Big Mac) can be of different quality between countries.
Price level measurements
Different countries have different baskets of goods that are representative of the consumption patterns within their economies. They will accordingly measure inflation rates differently.
The Big Mac Index
A popular form of the PPP is the Big Mac Index, introduced in 1986 in the publication The Economist.
The Big Mac Index was largely introduced tongue-in-cheek. You can’t realistically expect the price of a particular food item alone to feed into an accurate representation of what currencies are worth what or how they might be misaligned.
But the idea is to take the price, in local currency, of a Big Mac in one country and divide it by the price of one in another.
The Big Mac is designed to make PPP exchange rate theory more intuitive to understand.
It’s the notion that, over the long term, exchange rates should move toward an equilibrium that would equalize the prices of an identical basket of goods and services (in this case, a particular type of burger) in any two countries or jurisdictions.
They produce both a raw index and a GDP-adjusted index.
Big Mac Raw Index
The Big Mac Raw Index is based on PPP.
a) PPP implies that exchange rates are determined by the value of goods that currencies can buy.
b) Differences in local prices – in this case, for Big Mac hamburgers – can suggest what the exchange rate should be.
c) Using Big Mac price discrepancies, you can simplistically estimate how much one currency is under- or over-valued relative to another.
Big Mac GDP-Adjusted Index
a) Varying labor costs and barriers to trade and migration may undermine purchasing-power parity.
b) To control for this, the adjusted index predicts what Big Mac prices should be given a country’s GDP per person.
c) The difference between the predicted and the market price is an alternative measure of currency valuation.
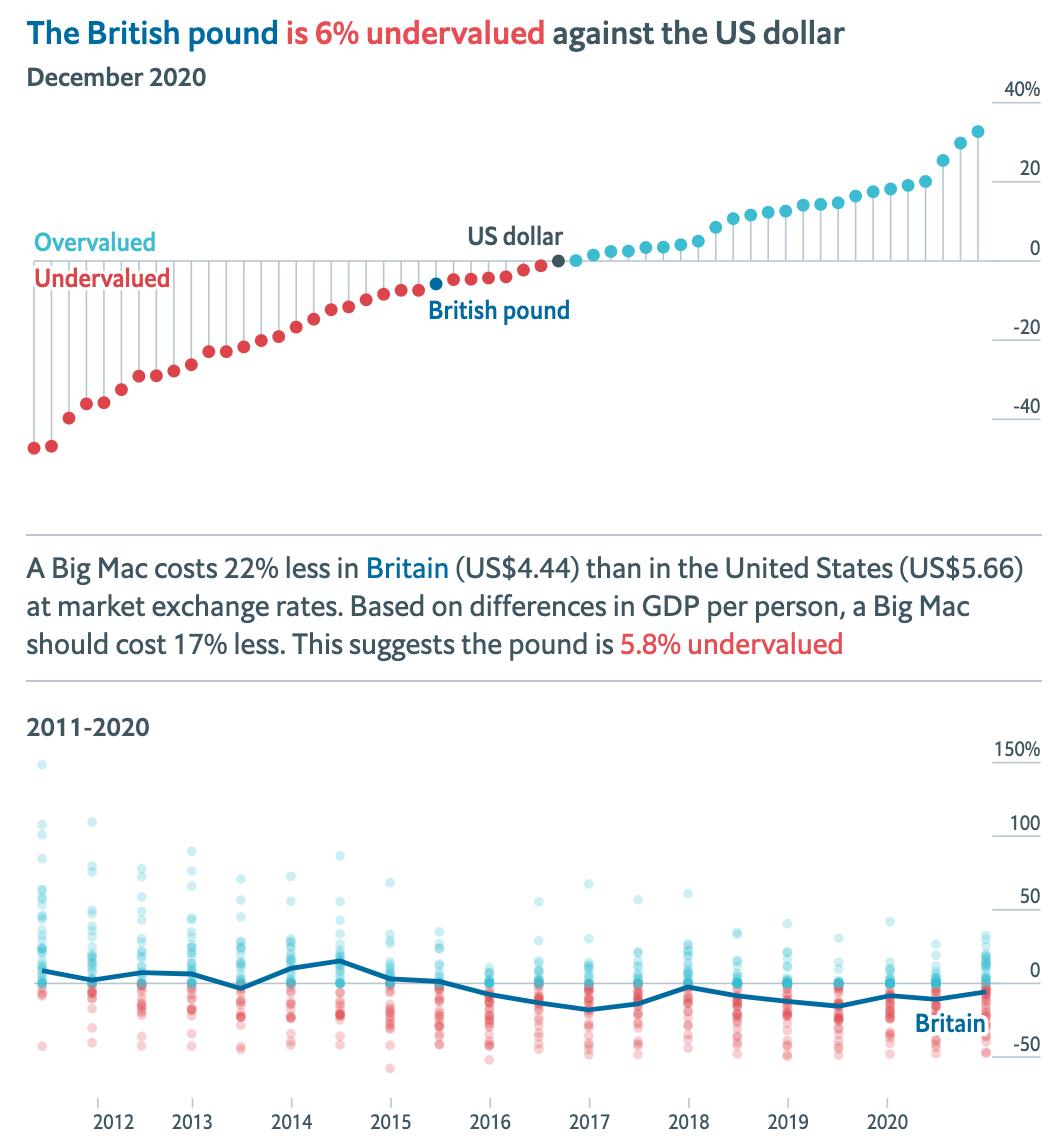
Below is a sampling of the Big Mac Index from January 2021, adjusted for GDP per person. Naturally, McDonald’s generally charges people in richer nations (e.g., Switzerland) more for a hamburger than they can in poorer nations (e.g., Costa Rica). This metric then adjusts for per-capita income.
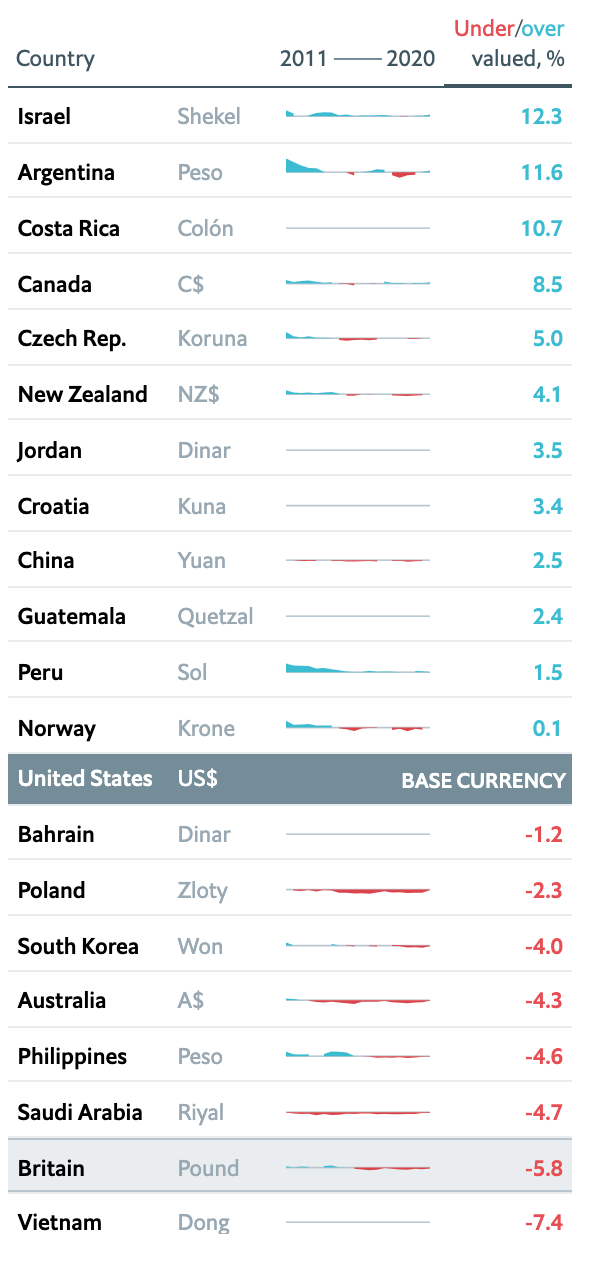
(Sources: McDonald’s; Refinitiv Datastream; IMF; Eurostat; LebaneseLira.org; The Economist)
It also gives individual estimates based on this thinking. For example, in the United Kingdom, a Big Mac costs 22 percent less than in the United States while the GDP per capita in the UK is 17 percent less than in the US.
Taking the difference between the two statistics, this would suggest the British pound is around 5-6 percent undervalued versus the dollar at this particular time.
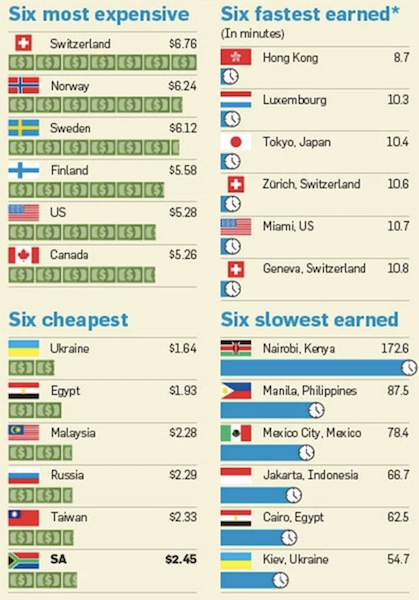
Here are the six cheapest and six most expensive, and also the “fastest earned” and “slowest earned”. In other words, how long would the average person have to work in these countries to buy one:
PPP vs. GDP-adjusted indexes more broadly
The GDP-adjusted index is meant to compensate for the fact that you would expect average burger prices to be cheaper in poor countries than in wealthier ones because labor costs are lower and vice versa.
PPP helps indicate where exchange rates should go in the long run.
For example, a country like China is getting richer, so a trader might use PPP to help understand where the exchange rate of the renminbi might go relative to other countries over time.
PPP would tend to suggest that the USD/CNY exchange rate would need to decline over time as China’s incomes increase. But PPP says little about today’s equilibrium exchange rate.
Therefore, the relationship between prices and GDP per capita may be a better guide to the current fair value of a currency as opposed to PPP.
Balassa-Samuelson Effect
The Balassa-Samuelson effect works to explain why consumer prices are structurally higher in more developed countries relative to less developed countries.
It is suggested that this is due to greater variation in the levels of productivity in the tradables (relative to the non-tradables) sector.
In turn, this can explain the large difference in the price of services and wages between countries, and also differences between currency exchange rates and what PPP would suggest.
The implication is that currencies that represent countries with higher productivity will seem to be undervalued in relative terms and that this effect will appear to increase when incomes increase.
According to the “law of one price”, goods that are purely tradable should not differ significantly in price based on location.
In other words, the price of socks in India should theoretically be the same as those in the US despite the large gap in GDP per capita. Both will be motivated to buy from the lowest cost producer.
On the other hand, most forms of services (e.g., gardening, medical care, dentistry) must be obtained locally.
This makes their prices very specific to the location. Moreover, some goods, such as heavy furniture, have high transit costs – and could incur import duties – making the prices of these types of tradables deviate between markets as well.
The Penn effect stipulates that these higher price levels will structurally flow in one direction – namely, that countries with higher incomes will see systematically higher prices of services and goods with low value-to-weight ratios (e.g., furniture, heavy appliances, heavy machinery).
The Balassa-Samuelson effects also suggests that a wage increase in the tradable goods sector will also tend to lead to wage increases in the service (non-tradable) sector of the economy.
Wage increases typically run higher in emerging markets where they have more catching up to do technologically, and thus see higher productivity rates.
This increase also leads to structurally higher inflation rates in emerging economies relative to more developed economies.
Income and wage differential is ultimately predominantly an effect of the differing productivity between workers.
Sectors that have low productivity advances are also the ones mostly involved in non-tradable goods, such as lawn care services. This needs to be true or else this type of work would be offshored (and obviously certain types of work cannot be feasibly offshored).
Certain jobs are less sensitive to advances in productivity relative to others. For example, a seamstress in New York is generally no more productive than one in Kiev.
But these types of jobs need to be completed locally. So even though workers in New York taken collectively are more productive than workers in Kiev, the equalization of local wage levels causes New York seamstresses to be paid more, on average, than seamstresses in Ukraine.
In other words, local goods (non-tradables) have different prices depending on the jurisdiction and will tend to be more expensive in richer countries and cheaper in poorer countries.
Tradables will be more or less the same price in any country, though this is dependent on transit costs, trade barriers, taxation, and other such factors.
This also means that the tradables sector is more influential on a country’s exchange rate relative to non-tradables. This is because when one country wants to buy from another country, they need to swap currency, and this influences the supply and demand.
If a US buyer wants to buy something from Japan, he must convert his dollars into yen. This boosts the yen relative to the USD.
Behavioral Equilibrium Exchange Rate (BEER)
The BEER approach attempts to measure the exchange rate misalignment between any given two currencies based on transitory factors, chance disturbances, and current economic fundamentals in relation to their sustainable levels. The BEER approach is often employed using econometric applications and may be used to explain cyclical changes in the currency.
The choice of variables for the BEER approach is discretionary, based on beliefs of what impacts an exchange rate and the data that’s available. This can include the following:
- monetary policy and its future likely path / nominal and real interest rate differentials
- terms of trade (price of imports and exports between countries)
- national savings and savings strategies
- productivity differentials
- debt and equity capital stocks (and the risk premia between them)
- demographics and their net effects on savings and other forms of economic behavior
- net foreign assets relative to net foreign liabilities
- fiscal policy and its future likely path
- levels of foreign exchange reserves
- capital account policy
- net external debt as a percentage of output
- prices of traded and non-traded goods
- tariffs, import duties, non-tariff barriers, and other such macroeconomic factors
Some might also consider such qualitative factors such as the result of a political election or action (e.g., Brexit news), but these are largely influential through expected changes in macroeconomic variables as a consequence of these events.
For example, the election of Donald Trump in the US impacted how traders perceived where personal and corporate tax rates would go. This impacts capital flows.
If tax rates are lowered, for example, the expectation is for more capital to flow into the US. It could also increase consumers’ take-home pay and increase the national savings rate.
If lower corporate tax rates also incentivize companies to invest more, then this would have positive productivity outcomes.
It could also cause the fiscal deficit to widen (if the extra income produced doesn’t offset the spending and result in higher tax receipts) and lead to the need to sell an unsustainable amount of bonds (a promise to deliver currency over a period of time) externally.
Linked here is one such example of a BEER econometric approach to determining fair values in different exchange rates.
Fundamental Equilibrium Exchange Rate (FEER)
A fundamental equilibrium exchange rate (FEER) is similar to how the term is used with respect to the valuation of other asset classes. What is the fair value exchange rate on the basis of existing policies?
In the realm of currencies, the fundamental value should be one that is expected to generate a current account of some surplus or deficit that is equal to the country’s underlying capital flow.
This makes the assumption that the country is looking to pursue internal balance and not restricting trade or capital flows to keep its balance of payments at a certain level.
For example, if a country wants to peg its exchange rate, it either needs to forgo having an independent monetary policy (if it wants to allow capital inflows and outflows to move as needed) or restrict its capital account if it wants to continue to have autonomy over its monetary policy. (More on this dynamic, commonly called a trilemma, is explained here.)
Because productivity and overall output tends to grow over time, this increases countries’ holding of reserves.
The secular growth rate in reserve holdings also gives an indication of the amount of foreign capital that could be available to finance a current account deficit for countries that have them (e.g., the US, UK, Canada, Australia, India).
Because capital is mobile, knowing what a country’s underlying capital flow is exactly is hard to know.
It would be dangerous for any country to assume that any amount of fiscal or current account deficit could always be financed through external capital (selling debt to foreigners). The would make the concept of a fundamental equilibrium exchange rate moot.
Borrowing extensively (a form of capital inflows) and lending extensively (a form of capital outflows) can be economically dangerous and unproductive.
A FEER must be defined in real (i.e., inflation-adjusted) terms. A country that’s undergoing an inflation rate that is five percent higher than that of other countries means that its currency will need to depreciate by five percent in order to restore the same competitive position as before.
Namely, the five percent depreciation will give consumers the same set of choices as they had previously and producers needing to sell their goods will have their competitiveness restored internationally.
The exchange rate considered is also not a bilateral rate in the sense of “the EUR/USD exchange rate is 1.20” but rather an effective rate.
In other words, other countries are taken into consideration and weighted based upon their allocation in the foreign trade of the country in question. This then feeds into the estimate of the overall exchange rate that measures an overall competitive position.
It is misleading to measure a country’s “exchange rate” as one that takes into account only the currency of a single trade partner, assuming that the country’s trade is diversified among several countries.
Complications in finding the FEER can be difficult for certain countries that depend heavily on the exportation of a certain good such as oil and their particular national savings strategy.
For example, Norway is an oil-exporting country that converts its savings into ownership of mostly foreign assets. Another oil-exporting country, such as Ecuador, does not save anywhere near as aggressively.
Therefore, we can expect Norway to be less sensitive to an oil price decline relative to Ecuador.
Under normal circumstances, oil prices are going to be a significant influence on the exchange rates of these particular countries. For non-oil exporters, a country’s sustainable current account level will be the most influential long-run structural factor that impacts the equilibrium exchange rate.
It is commonly, though somewhat arbitrarily, believed that countries should not run current account deficits of more than around 3 percent of GDP.
To fund this deficit, countries will need to finance it through debt.
For the same reason, it is believed that because deficits and surpluses are a zero-sum game, this rule should symmetrically apply to current account surplus countries.
This is part of why purposeful currency depreciation (which makes exports relatively cheaper internationally and helps build a more positive trade balance) is frowned upon.
Some macroeconomists suggest that a +/- 3 percent surplus/deficit situation can be exceeded so long as surplus countries are not increasing their net foreign assets relative to GDP and deficit countries are not decreasing their net foreign assets relative to GDP.
How did this “3 percent rule” come about?
In the past, academics and market practitioners identified ~40 percent as an approximate level of external debt to GDP that should not be exceeded.
Empirically, this tended to increase a country’s vulnerability to default. If emerging market growth rates are 4 percent in real terms and 7 percent in nominal foreign currency terms (and 6 percent in nominal USD terms), this 40 percent multiplied by 6-7 percent produces a value of 2.4 to 2.8 percent.
And this assumes that the deficit is financed in domestic currency where the rates and payments can be controlled, unlike if it’s denominated in a foreign currency.
This 2.4-2.8 percent represents the theoretically sustainable deficit level. Because growth and inflation were somewhat higher in the past, this led to a higher equilibrium estimate of the sustainable current account deficit.
It differs on a country by country basis. Some countries have structurally higher growth and inflation rates and will also depend on the country’s net foreign asset position.
If a country earns more on foreign assets relative to what it pays out on liabilities, this extra income generated can support a higher deficit.
Reserve currency countries also enjoy the advantage of being able to sell their debt to the rest of the world relative to a non-reserve currency country. Though the US has a balance of payments issues with a fiscal and current account deficit, the US dollar is the most widely used currency in a variety of functions, so there is a large amount of foreign demand for it.
Thus, the US can keep its deficits structurally higher relative to a country that has economic and political instability, less robust institutions, higher levels of corruption, less support for commercialism and innovation, less internal investment, inadequate capital markets development, and so forth.
Nonetheless, the US is a country that is likely to only growth at some 3.5 percent nominally (real output plus inflation) going forward, with about 1.7 percent real output and about 1.8 percent inflation. The breakdown in real output can be found below:
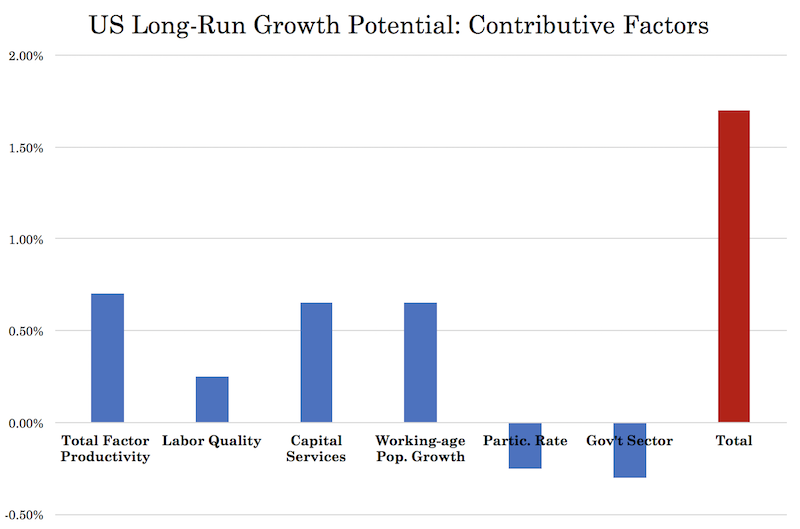
With the world’s reserve currency, the US enjoys the advantage of being able to run a higher current account deficit simply because it’s able to sell a lot of its debt to other countries who want it.
The US effectively enjoys an income effect from this and is why it’s GDP per capita is higher than similar countries, such as Germany, Japan, and the UK. Since the end of World War II, the real GDP per capita of Germany, Japan, and the UK have stabilized at around 70-80 percent of the US’s. The dollar’s influence has been a big part of this.
Namely, it can enjoy higher living standards, which makes having a reserve currency important.
But this amount of debt issuance has its limits. The US has an external debt to GDP ratio of about 45 percent.
If nominal growth is only 3.5 long-term and we assume that the US will have trouble selling even more of its debt to foreigners who are already have USD reserves at 50-60 percent of all reserves, this means current account deficits of more than 1.6 percent will be hard to sustain.
The more the US stays loose with its spending patterns, the more it endangers its status as having the world’s top reserve currency. In the near-term it’s not an issue. The US has the highest national income, which typically conveys top reserve currency status. But it’s an issue over the next decade-plus.
Macroeconomic Balance (MB)
Macroeconomic balance (MB) is an approach used to assess the equilibrium exchange rate of a currency.
The equilibrium exchange rate is the rate at which a country’s current account balance is consistent with its medium-term economic fundamentals.
The MB approach is based on the idea that a country’s current account balance can be divided into two components:
Structural Component
This is determined by the country’s fundamental economic variables, such as the level of savings and investment, fiscal policy, demographics, and other structural factors.
It represents the current account balance that would prevail if the country’s real exchange rate were at its equilibrium level.
Cyclical Component
This reflects temporary factors, such as business cycle fluctuations, that can cause the current account balance to deviate from its structural level.
How to Figure the Macroeconomic Balance
The MB approach involves the following steps:
- Estimate the Structural Current Account Balance: This is done by analyzing the fundamental determinants of the current account, such as the level of savings and investment, fiscal policy, and other structural factors.
- Calculate the Cyclical Adjustment: This involves estimating the impact of temporary factors, such as output gaps, on the current account balance.
- Determine the Equilibrium Exchange Rate: By comparing the actual current account balance with the estimated structural balance, one can infer whether the real exchange rate is overvalued or undervalued. If the actual balance is more positive (or less negative) than the structural balance, it suggests that the currency may be undervalued. Conversely, if the actual balance is more negative (or less positive) than the structural balance, it suggests that the currency may be overvalued.
Since the last couple sentences are really the meat of everything let’s look into that a bit further:
Let’s break down the logic step by step:
The Concept of Equilibrium
In the context of the Macroeconomic Balance (MB) approach, the “equilibrium” refers to a state where the actual current account balance matches the structural (or desired) balance.
The structural balance is the level of the current account that would prevail if all the fundamental economic factors were in their ideal or normal state.
Actual vs. Structural Balance
The actual current account balance reflects the real-world state of a country’s trade and financial transactions with the rest of the world.
The structural balance is a theoretical construct that represents what the current account balance should be, given the country’s fundamental economic conditions.
Interpreting the Differences
If the actual balance is more positive (or less negative) than the structural balance, it means the country has a better trade and financial position than what its fundamentals suggest.
This could be because the country’s currency is undervalued, making its exports cheaper and imports more expensive, leading to a more favorable current account balance.
On the other hand, if the actual balance is more negative (or less positive) than the structural balance, it indicates the country is in a worse position than its fundamentals would suggest.
This could be due to the country’s currency being overvalued, making its exports more expensive and imports cheaper, leading to a less favorable current account balance.
Currency Valuation
An undervalued currency tends to boost exports (because they are cheaper for foreign buyers) and reduce imports (because they are more expensive for domestic buyers).
This can lead to a surplus or reduced deficit in the current account.
An overvalued currency has the opposite effect.
It makes exports more expensive and imports cheaper, which can lead to a deficit or reduced surplus in the current account.
Use of Macroeconomic Balance
The MB approach is widely used by international organizations, such as the International Monetary Fund (IMF), to assess currency misalignments and provide policy recommendations.
However, the approach has its limitations.
Estimating the structural current account balance and the equilibrium exchange rate involves a degree of unknowns, and the results can be sensitive to the choice of variables and methodologies used.
Summary
All in all, by comparing the actual current account balance with the estimated structural balance, one can get insights into the valuation of the currency.
If the actual balance is better than the structural balance, it suggests the currency might be undervalued. If it’s worse, the currency might be overvalued.
The Big Picture
Outside of examining the current macro data on growth, inflation, trade deficits, fiscal deficits, prices of different baskets of goods and services, it’s important to know the big picture.
Looking at the details can obscure important information about where trends are going.
It also won’t capture everything.
For example, one might look at the financial situations of many developed countries and see that they look fundamentally poor. Yet their currencies are still quite strong.
So, it’s important to understand reserve status and how unproductive spending, which leads to the creation of more debt (and money to cover it), can sometimes actually help a currency in the short-run.
Reserve status’s influence on currency valuation
A reserve currency is something that people broadly want to save in. Every great empire has had a reserve currency as their productivity led to trading with other countries. To facilitate this, they used their currency internationally.
They acquired wealth, geopolitical power, and military might to defend their trade routes. They develop robust capital markets and a financial center that helps to attract and distribute capital. All of these help to reinforce the use of a reserve currency.
Naturally, demand for a currency globally (through the purchase of the country’s assets) helps increase the value of it.
This also enables them to borrow more to expand their incomes and live above their means. But this borrowing and overstretched financial position also helps lead to an empire’s eventual decline.
Debt is a promise to deliver money over time. When countries/empires overextend themselves financially, this means they need to create more debt and money to service it.
This means more people want to get out of the debt and currency and move their wealth elsewhere.
Those responsible for making policy decisions get to a point where they need to make the trade-off between:
- a) allowing interest rates to rise to unacceptably high levels as part of a classic currency defense (i.e., compensate investors enough for holding it), or
- b) “print” money to buy the debt, which further reduces the value of money and debt denominated in the currency.
When faced with this choice, central banks almost always choose choice B in printing money, buying the debt, and devaluing the currency. It’s the most discreet way of getting out of financial problems and therefore the most politically acceptable.
But this process normally continues in a self-reinforcing way because the interest rates being received on the money and debt are not adequate to incentivize investors to compensate them for the depreciating value of the currency.
This process will go on to a point where the currency and real interest rates establish a new equilibrium balance of payments.
In other words, this means there will be enough forced selling of financial assets, goods, and services and enough curtailed buying of them by domestic entities to the point where they can be paid for with less debt.
And this generally means the loss of most of a currency’s reserve status. For example, even though the peak of the British empire passed centuries ago, the GBP still represents around five percent of global reserves.
Global reserves
Right now, global reserves – i.e., the share of central bank reserves by currency – look like this:
- USD: 53%
- EUR: 20%
- Gold: 14%
- JPY: 6%
- GBP: 5%
- CNY: 2%
These relative weightings are a function of two main things:
- a) the fundamentals that influence their relative appeals and
- b) the historical reasons behind why these currencies have been used.
The USD, for example, is still north of half of all global reserves because of the US’s reputation and less so because of its fundamentals.
Reserve status is one of the last things an empire loses once its declined in relative terms.
It lags the fundamentals of a country because it’s not easy to change an entrenched system.
It’s very similar to the way languages last over time.
The Portuguese and Spanish empires declined hundreds of years ago, but languages pass on from one generation to the next, which means languages originally spoken as a result of conquests persist for very long periods.
The British empire established the American colonies and passed on their language, which eventually broke off as the United States and became the world’s top superpower. This, in turn, created a lot of English speakers, which persists today because of technologyies and ecosystems produced by American companies (e.g., Facebook, Apple, Twitter, Snapchat).
Currencies are analogous to languages in terms of the social effects.
The current four top reserve currencies – USD, EUR, JPY, and GBP – are in place because they represented the leading empires following the post-World War II period. However, on a fundamental level they are not that attractive.
The relative reserve holdings of each currency are out of line relative to what proportions you’d want to have to be balanced and where the world is going.
For example, China is taking a larger share of the global economy in terms of overall aggregate mass and rate of change and is undervalued relative to where it stands in relation to global reserves.
The dollar, euro, yen, and pound are in wide use because they came from the old Group of Five (G5). These represented the top five countries by per capita GDP in the 1970s (US, West Germany, France, Japan, UK), but that assembly is now outdated.
Fundamentals of each of the main reserve currencies
We’ll briefly discuss the fundamentals of each of these main reserve currencies. This includes gold. As a long-duration store of value reserve asset, it acts more like a currency than a commodity.
Knowing the basic backdrop can help better understand the big picture and also separate short-run from long-run.
US dollar
Based on several long-run measures, the relative proportion of dollars within global reserves will need to come down over time.
- i) The size of the US economy relative to the world economy.
- ii) The size of the US debt markets’ capitalization relative to the debt capitalization of other markets.
- iii) The asset allocation that foreign investors would want to hold to balance their portfolios in a prudent way (i.e., fewer dollars).
- iv) The holdings of reserves that would be appropriate to meet the needs of trade and capital flow funding.
For example, the US is now about 20 percent of the world economy, but more than 50 percent of global reserves.
Euro
The euro is a type of pegged currency union. One of the main benefits of a unified European currency is that it helps not only ease commerce but gain traction as a reserve globally. This can help all of Europe borrow more cheaply and help lift incomes.
But the euro is a weakly structured currency by unifying many different countries’ monetary policies that often have very different economic conditions.
Since each country is tied together through the ECB’s monetary policy, they have limited ability to conduct monetary operations in light of their own economic circumstances.
That creates a currency that’s too weak relative to stronger economies (e.g., Germany) and a currency that’s too strong relative to weaker, periphery economies (e.g., Italy).
This creates disparate economic outcomes and more social friction.
European countries are highly fragmented on a number of different issues and the region is relatively weak economically, geopolitically, and militarily.
Gold
Gold is a popular reserve asset because it has worked for such a long time. Its track record goes back thousands of years.
It is not fiat-based so it is a non-credit dependent asset that bears no risk from being excessively “printed” unlike traditional fiat currencies.
Prior to 1971, during the Bretton-Woods monetary system (and in many other societies and empires before then), gold was the foundation that money was based on. Money represented a certain amount of gold.
When the claims on money become excessive and gold stores are not adequate to meet all these obligations, then policymakers will either alter the convertibility or untie the peg with gold altogether.
This type of dynamic is still in play today. Gold typically receives inflows when financial stores of value yield less in inflation-adjusted terms because it means the natural credit cycle is running out of room in the traditional way.
Money must be created to relieve the gap, which brings on devaluations. This leads to higher demand for alternatives, with gold being one of them.
This decreases the value of money in gold terms and gold goes up in money terms.
The gold market is limited in size and is relatively illiquid. Consequently, its use as a reserve asset is limited in accordance with that.
Gold is not a plausible alternative for vast amounts of debt wealth to shift into being about only one percent of the size of the global debt markets.
However, its price could move substantially in the event of such a shift.
Yen
The Japanese yen suffers from many of the same underlying domestic financial issues that are plaguing the US dollar.
Debts are too high relative to income. As a result, this means a lot of debt that is growing quickly and being purchased by its central bank to enable it to pay very low nominal and real interest rates.
On top of that, Japan is not a leading economic and military power. Its economy stands at around five percent of global GDP and it is losing share as time goes on as its working and overall population shrinks.
The yen is also not widely used or valued outside Japan.
British pound
Before the US dollar became the world’s reserve currency, there was the British empire, which overtook the Dutch empire’s relative power somewhere around the mid-18th century.
The UK is about only three percent of global GDP and has twin deficits (i.e., fiscal and current account deficits). It also has relatively weak overall geopolitical power.
Its proportion of global reserves is another anachronism of the way reserve status tends to linger to various degrees long after the decline of an empire’s relative influence.
Chinese renminbi / yuan (RMB or CNY)
The Chinese renminbi, also known as the yuan, is the only main reserve currency that is under-owned on the basis of its fundamentals.
China has the largest share of global trade of any economy.
Its economy is the second-largest and is projected to be the largest within the first half of the 21st century. It is already richer than the United States on an asset and liability basis.
The RMB has been managed to be approximately stable versus other national currencies and on a purchase price parity (PPP) basis.
Its foreign reserves are also large. (The US, by contrast, has low levels of foreign reserves.)
Also, unlike the other reserves, it doesn’t have a zero percent interest rate or negative real interest rate.
China does have a debt issue in that they’re growing faster than incomes. But these debts are denominated in local currency where that can be controlled through a restructuring (by changing the interest rates paid on the debt, changing the maturities, and/or changing whose balance sheet it’s on).
And China also doesn’t have the problems associated with the debt monetization that the other countries do with room in its yield curve. That is, both short-term and long-term rates are still materially above zero.
The main drawbacks to the RMB are the following:
i) It is not pervasively used globally.
ii) China doesn’t have the widespread trust of global investors, especially with its unique form of top-down governance (“state capitalism”) relative to Western democracies that have a more bottom-up style of governance.
iii) Its capital markets are not yet as well developed and have suffered several setbacks in their development as China figures out its debt situation, regulatory framework, and better gains the trust of the international community.
And Shanghai and Shenzhen are not yet considered global financial centers. All major reserve currencies have established major financial centers (Amsterdam in the 17th and 18th centuries, London in the 18th century to the present, New York in the 19th century to the present).
iv) Its payments clearing system is not well developed.
Geopolitical risk in currency valuation
This risk measures how geopolitical events affect the market value of a currency. This risk is often caused by political instability or by economic factors such as trade imbalances that lead to other actions (e.g., embargoes, tariffs, etc.).
Geopolitical risk can also be caused by military conflict.
Some traders try to take advantage of geopolitical risk by investing in currencies that are expected to appreciate in value if geopolitical events occur.
For example, investors may purchase Japanese yen or Swiss francs before an event that is likely to cause market volatility.
These currencies are known as “safe havens” because they are considered less risky than other currencies.
As another example, the Turkish lira has been declining in value in recent years because of political and economic instability in Turkey.
This decline is also reflected in the prices of other assets, such as stocks and bonds, that are traded in Turkey.
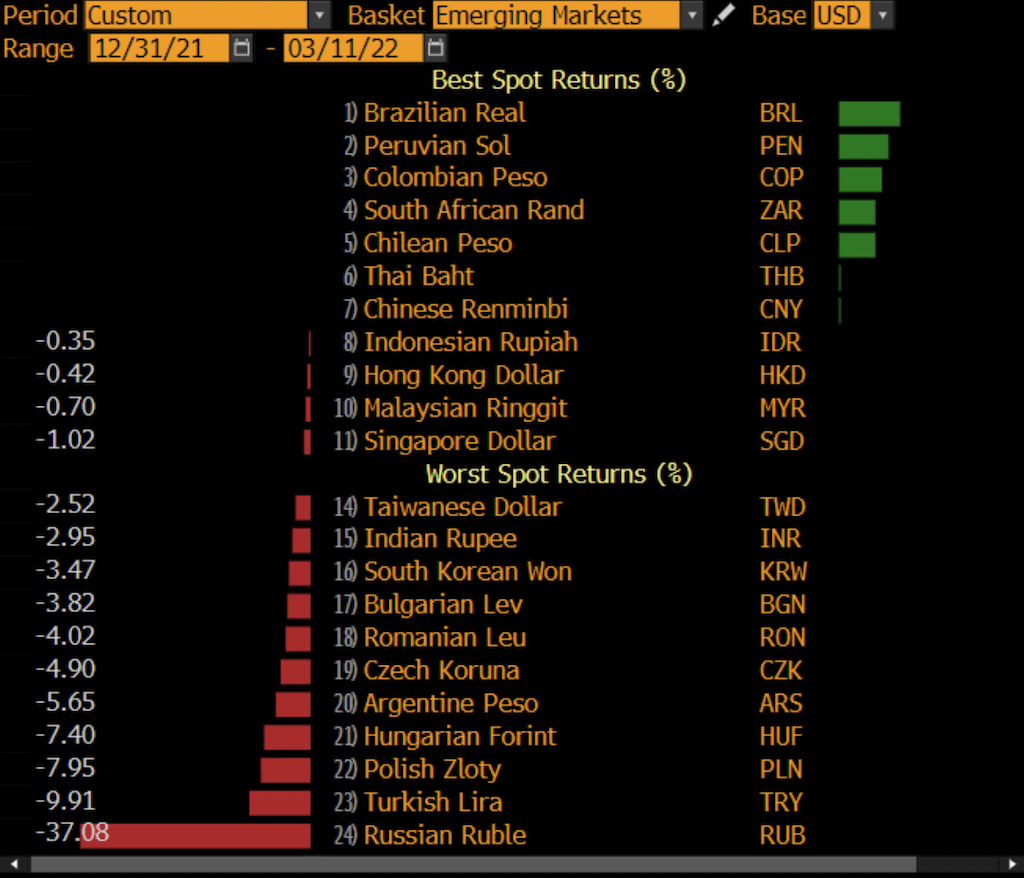
When Russia invaded Ukraine, this had the second-order effect of NATO countries unleashing an unprecedented wave of sanctions that constricted Russia’s ability to do business in the world and badly hit the Russian ruble (RUB).
This also led to Latin American commodity exporters (e.g., Colombia, Peru, Brazil) seeing their currencies rise because countries shifted to buying more of their exports instead of Russia’s.
There is no single measure of geopolitical risk.
Instead, geopolitical risk is often assessed using a variety of indicators, such as:
- The level of political instability in a country
- The size of a country’s military budget relative to its GDP
- The degree to which a country is economically dependent on other countries
- The extent to which a country’s exports are diversified
Currency Valuation Models – FAQs
How do exchange rates influence competitiveness and import prices between countries?
What matters for competitiveness and import prices is the trade-weighted effective exchange rate versus main trade partners.
What is the difference between real and nominal exchange rates?
The real exchange rate is the purchasing power of a currency relative to another.
It tells us how many units of the other currency we can buy with one unit of our currency.
The nominal exchange rate is the rate at which one currency trades for another on the foreign exchange market.
What is a floating exchange rate?
A floating exchange rate is a rate that is allowed to move freely in response to changes in supply and demand in the foreign exchange market.
Most major currencies are floated, while a few (such as the Chinese yuan) are pegged to another currency or set of currencies.
What is a fixed or pegged exchange rate?
A fixed or pegged exchange rate is one where the value of the currency is fixed against another currency, a basket of currencies, or a commodity.
What is an appreciation?
An appreciation is when the value of a currency increases in relation to another currency.
This can happen due to many factors such as economic growth, inflation, and central bank intervention.
What is a depreciation?
A depreciation is when the value of a currency decreases in relation to another currency.
This can happen due to many factors such as economic recession, deflation, inflation that’s too high, geopolitical uncertainty, law changes, and central bank intervention.
What are the effects of an appreciation?
An appreciation can have multiple effects on an economy.
For example, it can make imports cheaper and exports more expensive, leading to a decrease in the trade balance.
It can also lead to inflationary pressures as imported goods become more expensive.
What are the effects of a depreciation?
A depreciation can have multiple effects on an economy.
For example, it can make exports cheaper and imports more expensive, leading to a positive increase in the trade balance.
It can also lead to inflationary pressures as imported goods become more expensive.
What is Purchasing Power Parity (PPP)?
Purchasing Power Parity (PPP) is an economic theory that states that the exchange rate between two currencies is equal to the ratio of their prices levels.
In other words, PPP says that a unit of currency should buy the same amount of goods and services in different countries.
What is the Big Mac Index?
The Big Mac Index is a way of measuring the purchasing power parity between two currencies.
It is based on the idea that a Big Mac should cost the same in every country.
The index uses the price of a Big Mac in different countries to measure the purchasing power parity between their currencies.
What are exchange rate regimes?
Exchange rate regimes are the different ways that countries manage their currency’s value in relation to other currencies.
There are three main types of regimes: floating, fixed, and pegged.
What is a managed float?
A managed float is when a country intervenes in the foreign exchange market to influence the value of its currency.
The country will buy or sell its currency to try and maintain a target level.
What is a free float?
A free float is when a currency is allowed to move freely in the foreign exchange market in response to changes in supply and demand.
Most major currencies have a free float.
What is a pegged exchange rate?
A pegged exchange rate is when the value of a currency is fixed against another currency, a basket of currencies, or a commodity.
The country will intervene in the foreign exchange market to buy or sell its currency to maintain the peg.
What are benefits and drawbacks of floating exchange rates?
Floating exchange rates have the benefit of being flexible and responding to changes in the economy.
However, they can also be volatile and lead to currency crises.
What are benefits and drawbacks of fixed exchange rates?
Fixed exchange rates have the benefit of stability and predictability.
However, they can lead to problems if the country’s economy changes in a way that is not reflected in the pegged rate.
What are benefits and drawbacks of pegged exchange rates?
Pegged exchange rates have the benefit of stability and predictability.
However, if they are inconsistent with the economic fundamentals they will fail.
What is a currency crisis?
A currency crisis is when the value of a currency falls sharply in a short period of time.
This can be caused by many things, such as economic troubles, central bank intervention, or speculative attacks.
Currency crises can lead to problems for the economy, such as inflation or recession.
What is a currency defense?
A currency defense is when a country tries to protect the value of its currency from falling.
This can be done by buying up the currency in the foreign exchange market, raising interest rates, or intervening in other ways.
Currency defenses can lead to recession due to higher credit costs, which hurts credit creation and therefore spending.
What is a speculative attack?
A speculative attack is when investors sell off a currency because they believe it is about to depreciate.
This can lead to a rapid decline in the value of the currency and can cause problems for the economy, such as inflation or recession.
However, when traders short a currency they are often simply following economic fundamentals, not harming a country by itself.
Currency valuation models summary
In total, we have four main currency valuation models that are broadly applied:
- Real effective exchange rate (REER)
- Purchase price parity (PPP)
- Behavioral equilibrium exchange rate (BEER)
- Fundamental Equilibrium Exchange Rate (FEER)
- Macroeconomic Balance (MB)
The REER is defined as the weighted average of a country’s currency relative to a basket of other currencies. A country or jurisdiction’s REER can be calculated by taking the bilateral exchange rates between itself and its trade partners and then weighing each exchange rate by the trade balance (in percentage terms).
PPP suggests that exchange rates should equilibrate over time such that tradable goods between countries become equal in price. For example, if a shirt costs $10 in England and $15 in the US, it suggests that US consumers will want to buy the shirt from England (thus converting US dollars into British pounds), causing an appreciation in the GBP and depreciation in the USD.
Problems with PPP include the distorting influence of structural and idiosyncratic factors between countries, such as trade frictions and transit costs, non-tradable input costs, imperfect competition, tax disparities, goods quality, and price level measurements.
The BEER uses an econometric approach to measure the exchange rate misalignment between different currencies based on temporary influences, random events, and current measurements of economic fundamentals in relation to long-run sustainable levels. Often it is used to explain cyclical influences in the currency.
For example, in the US, each April the US Treasury sees an influx of revenue. This pulls liquidity (i.e., cash) out of the economy as people and businesses pay taxes. Less liquidity in circulation pulls up the value of the USD taking everything altogether. An econometric approach could work to understand this effect.
The FEER uses the concept of a fundamental equilibrium value. For example, if a country is running a balance of payments deficit (combined current account and fiscal account is negative), can it plausibly fund that by issuing debt to foreigners?
The Macroeconomic Balance (MB) approach assesses currency valuation by comparing a country’s actual current account balance with its estimated structural balance.
A more positive actual balance suggests an undervalued currency, while a more negative one indicates an overvalued currency.
Reserve currency countries that issue debt in their own currency where there is strong external demand for it will be able to do a better job of this than emerging market countries.
Emerging market countries that issue debt in foreign currency (generally because it has lower interest rates and it’s more stable in value than their own domestic currency) will run into issues if their currency depreciates against the currency in which many of their liabilities are denominated.
Currencies with structural balance of payments surpluses often see their currencies appreciate, as it indicates a surplus of demand for the currency on the international market.
All of these models assume floating exchange rates.
When there is a fixed exchange rate, the central bank or broader monetary largely controls the exchange rate by buying and selling on the open market.
Some other currency regimes are what you would broadly call “managed.” Namely, they are neither floating nor fixed but kept within a desired band for some period. The Chinese renminbi (also known as the yuan) is one example.
In terms of policy choices, a country will need to fix its exchange rate by either controlling capital flows in and out of the country (through the banks, non-bank financial institutions, and other conduits) or by forgoing the use of an independent monetary policy.
For example, if a country wants to peg their currency against the US dollar and don’t control their flows (because they don’t want to or because they don’t believe they realistically can), then their own monetary policy will be dictated by the US Federal Reserve.
This keeps the interest rate differential relatively constant. When one currency earns more or less relative to another, this makes the currency more or less attractive to hold.
A fixed exchange rate can also be feasible when capital flows between countries are small to the point where managing an exchange rate is relatively easy without flows subjecting it to large changes in demand.
This is part of what made the Bretton Woods monetary system effective from 1944 to 1971.
Even though there are various fixed exchange rates throughout the world – e.g., Hong Kong dollar relative to the US dollar (USD/HKD) – these currency pairs are still tradable. Just don’t expect them to move much unless the peg is broken.
In the end, all pegged systems that are inconsistent with the fundamentals of the currency will eventually fail.