
Ecological and Wildfire Responses to Rapid Landscape Changes within the Last ~900 Years on the South Haven Peninsula, Dorset (Southern England)

Abstract
:1. Introduction
2. Study Site
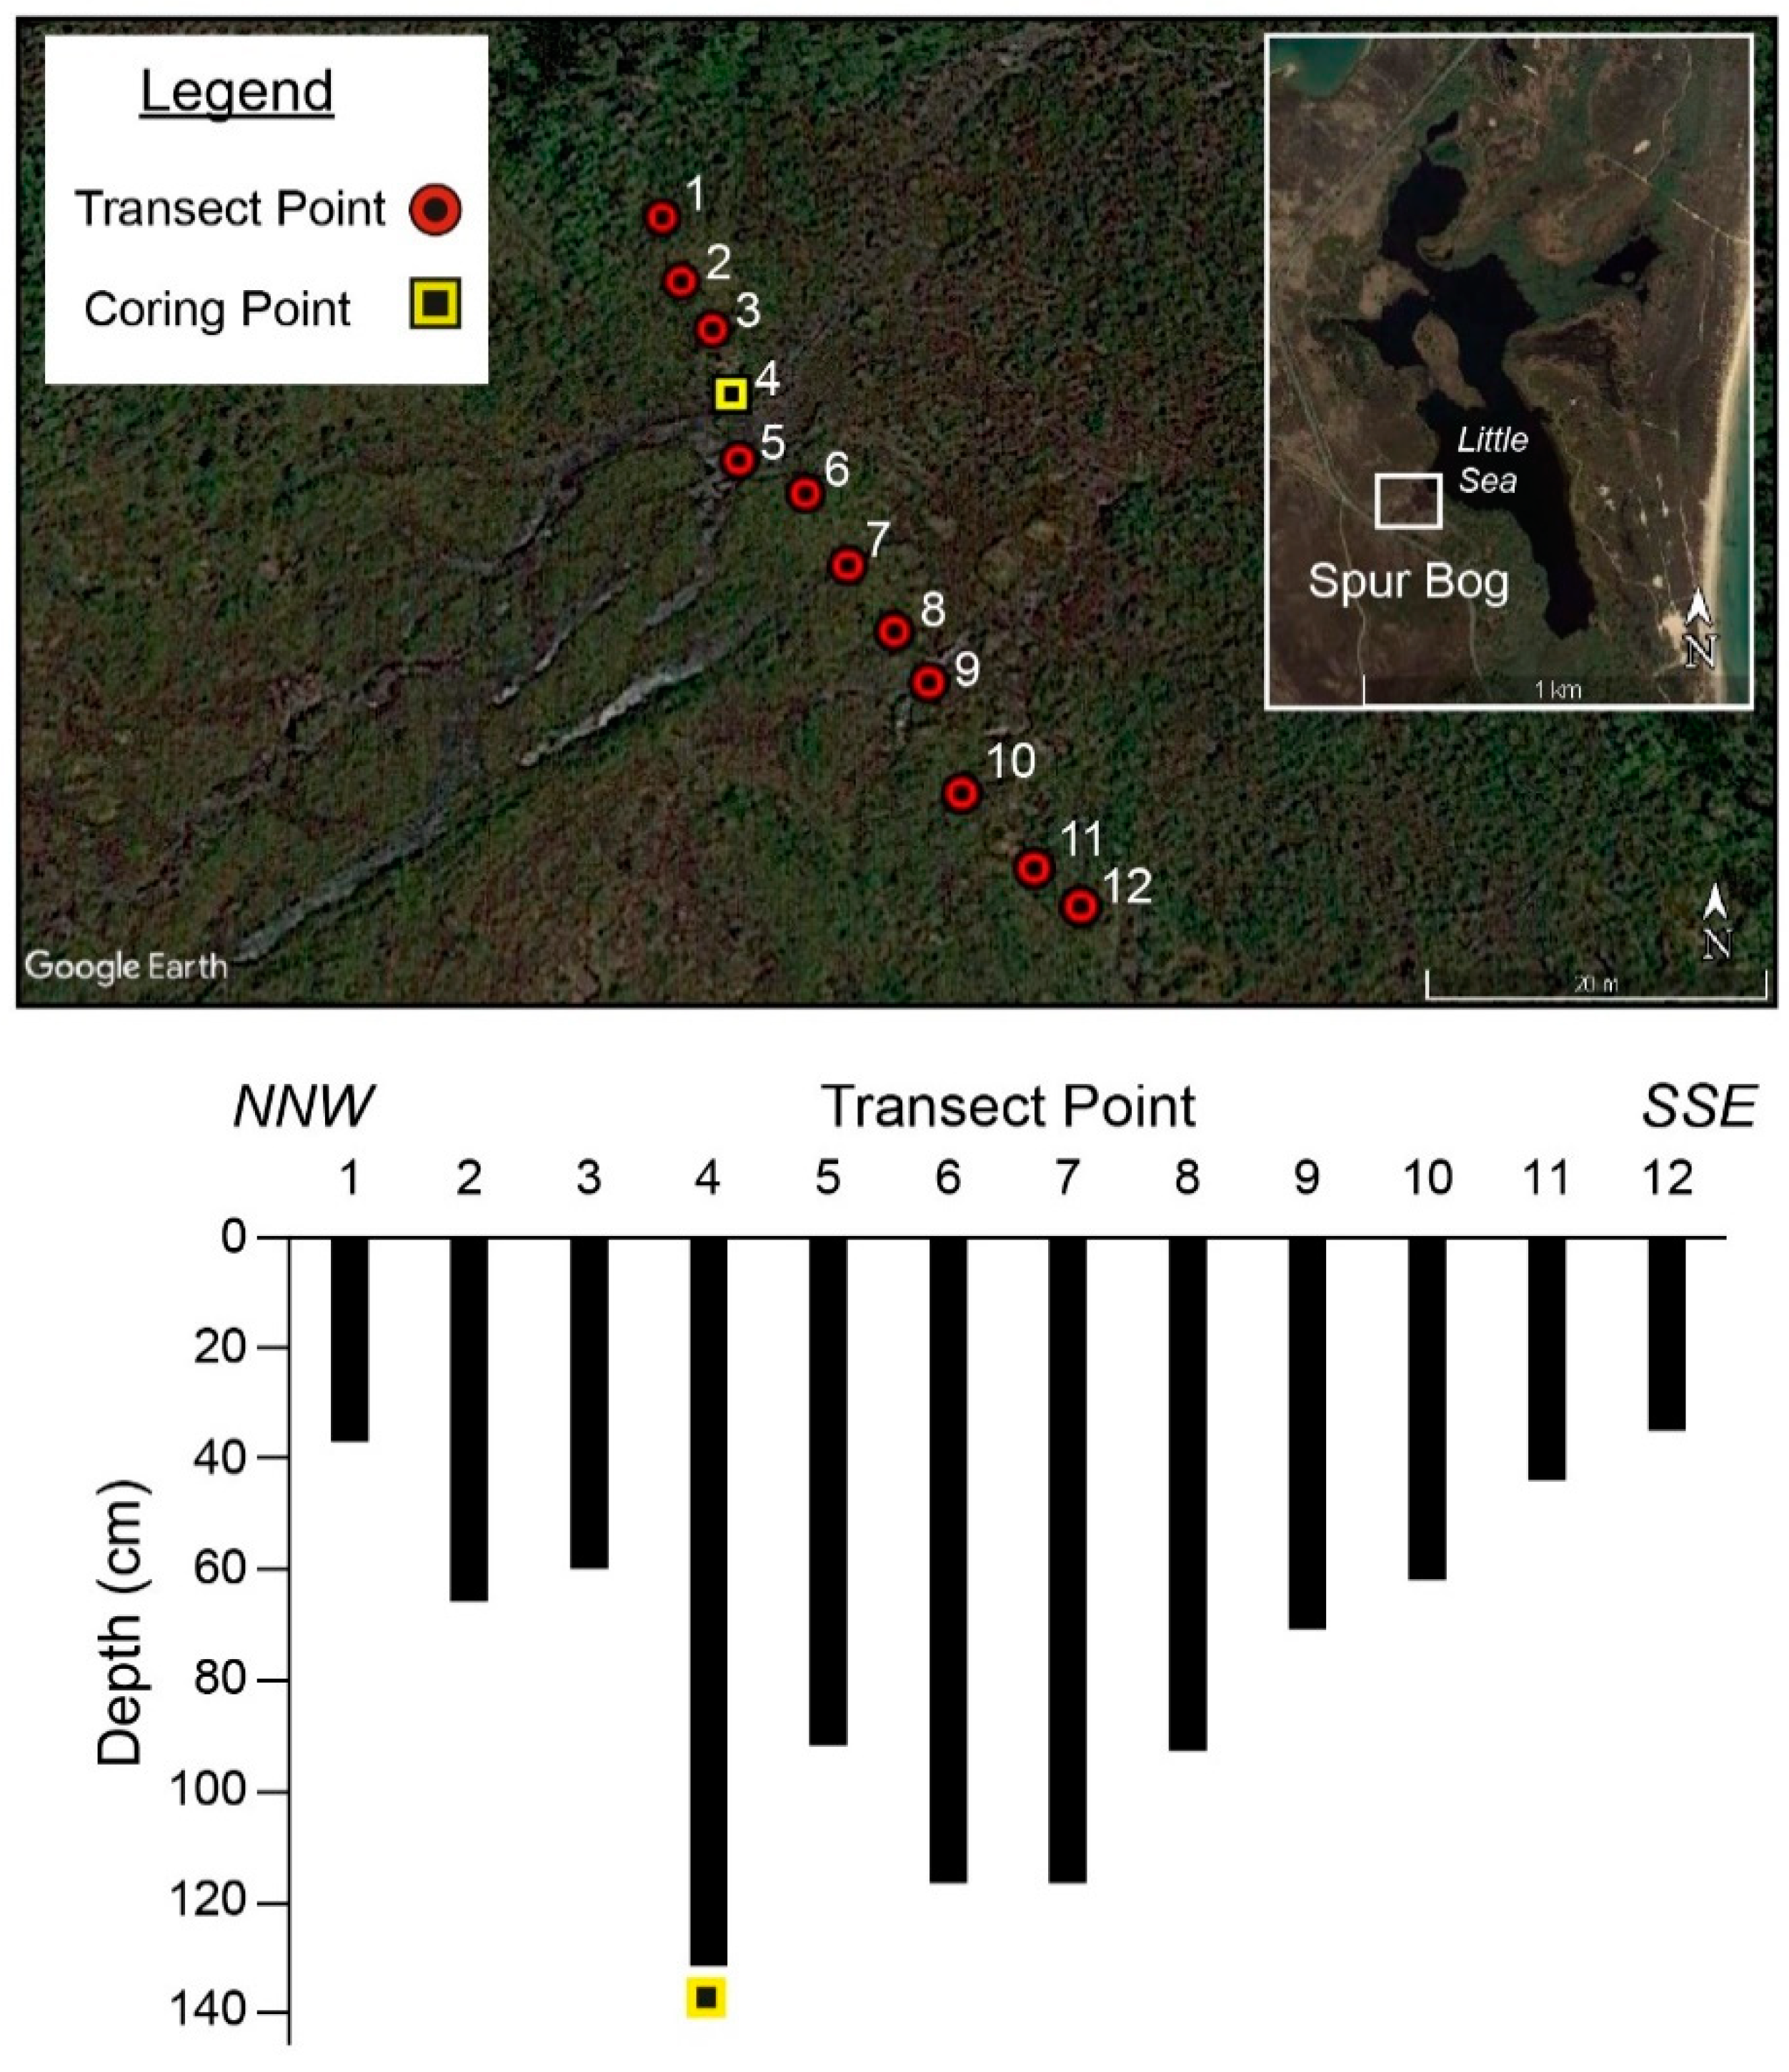
2.1. Location of Spur Bog and Geology of South Haven Peninsula

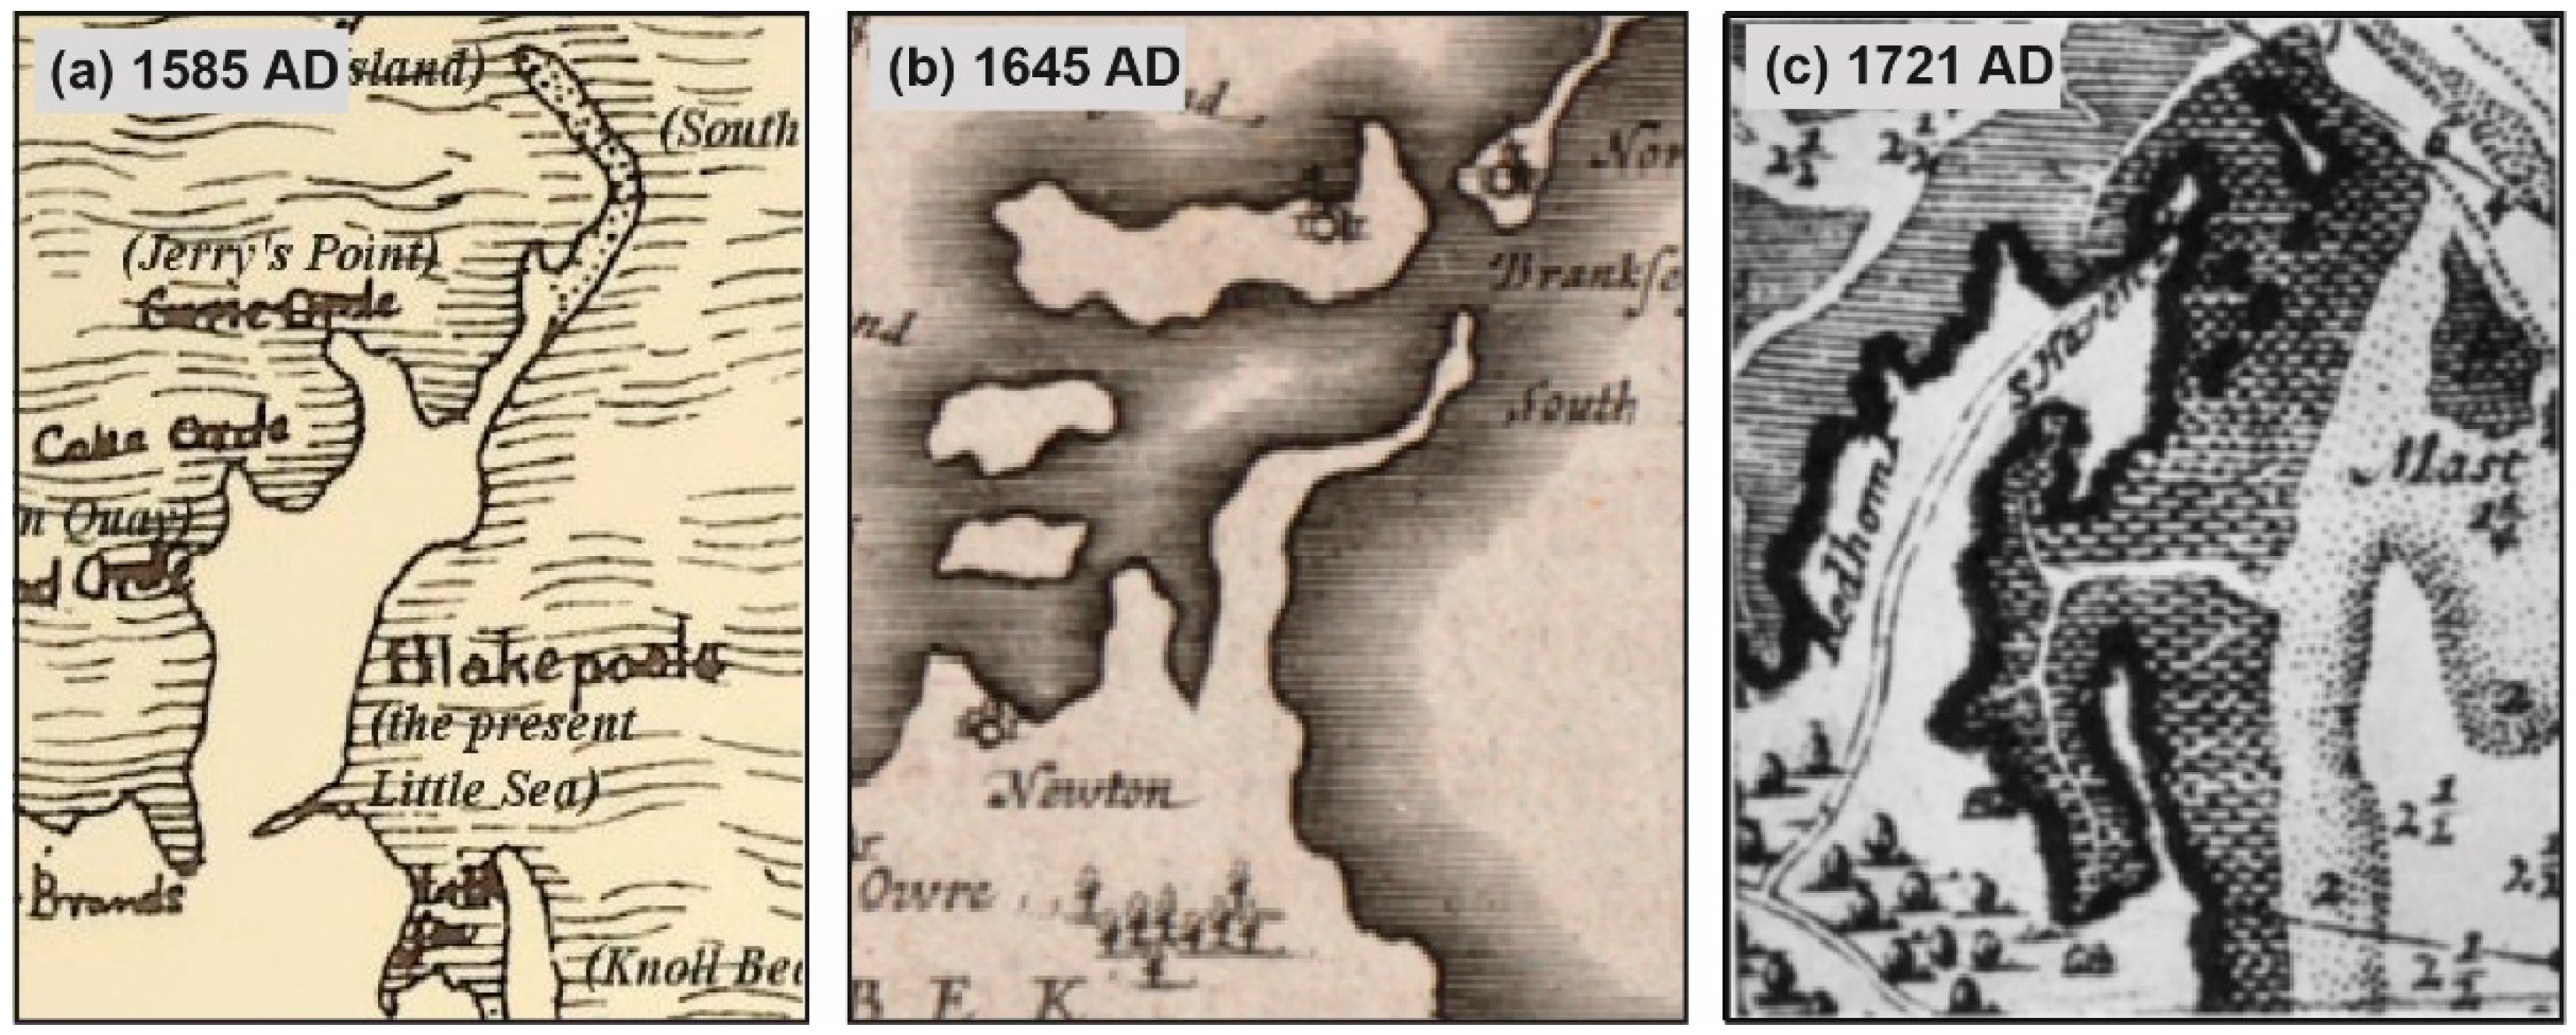
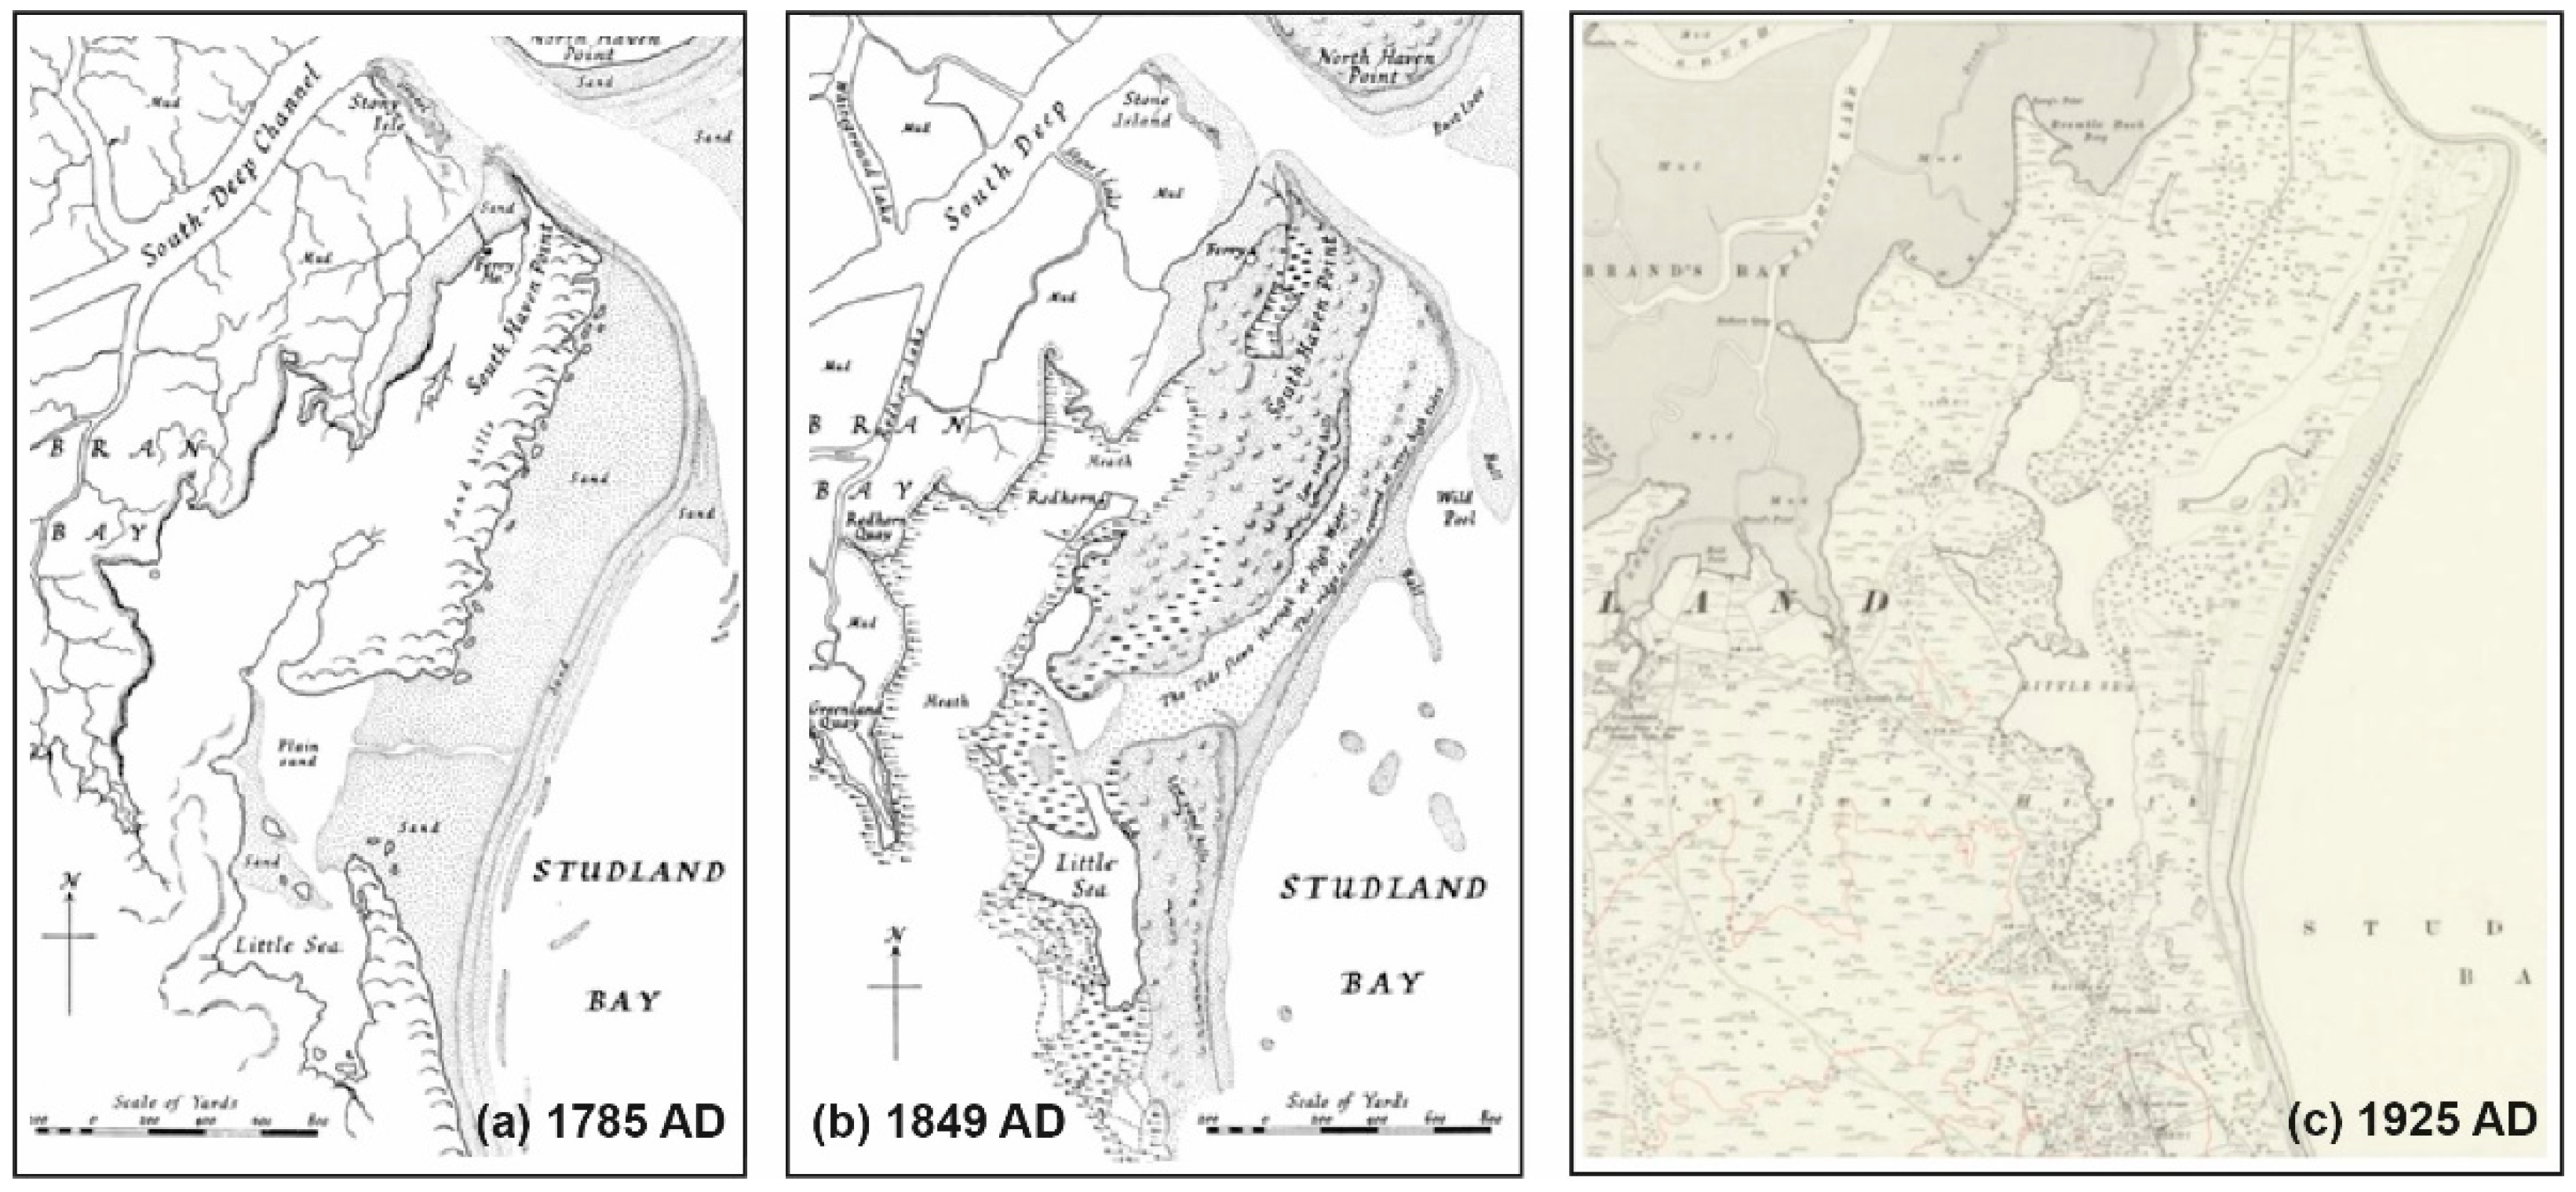
2.2. Historical Records of the Geomorphological Developments of South Haven Peninsula
2.3. Material and Methods
3. Results
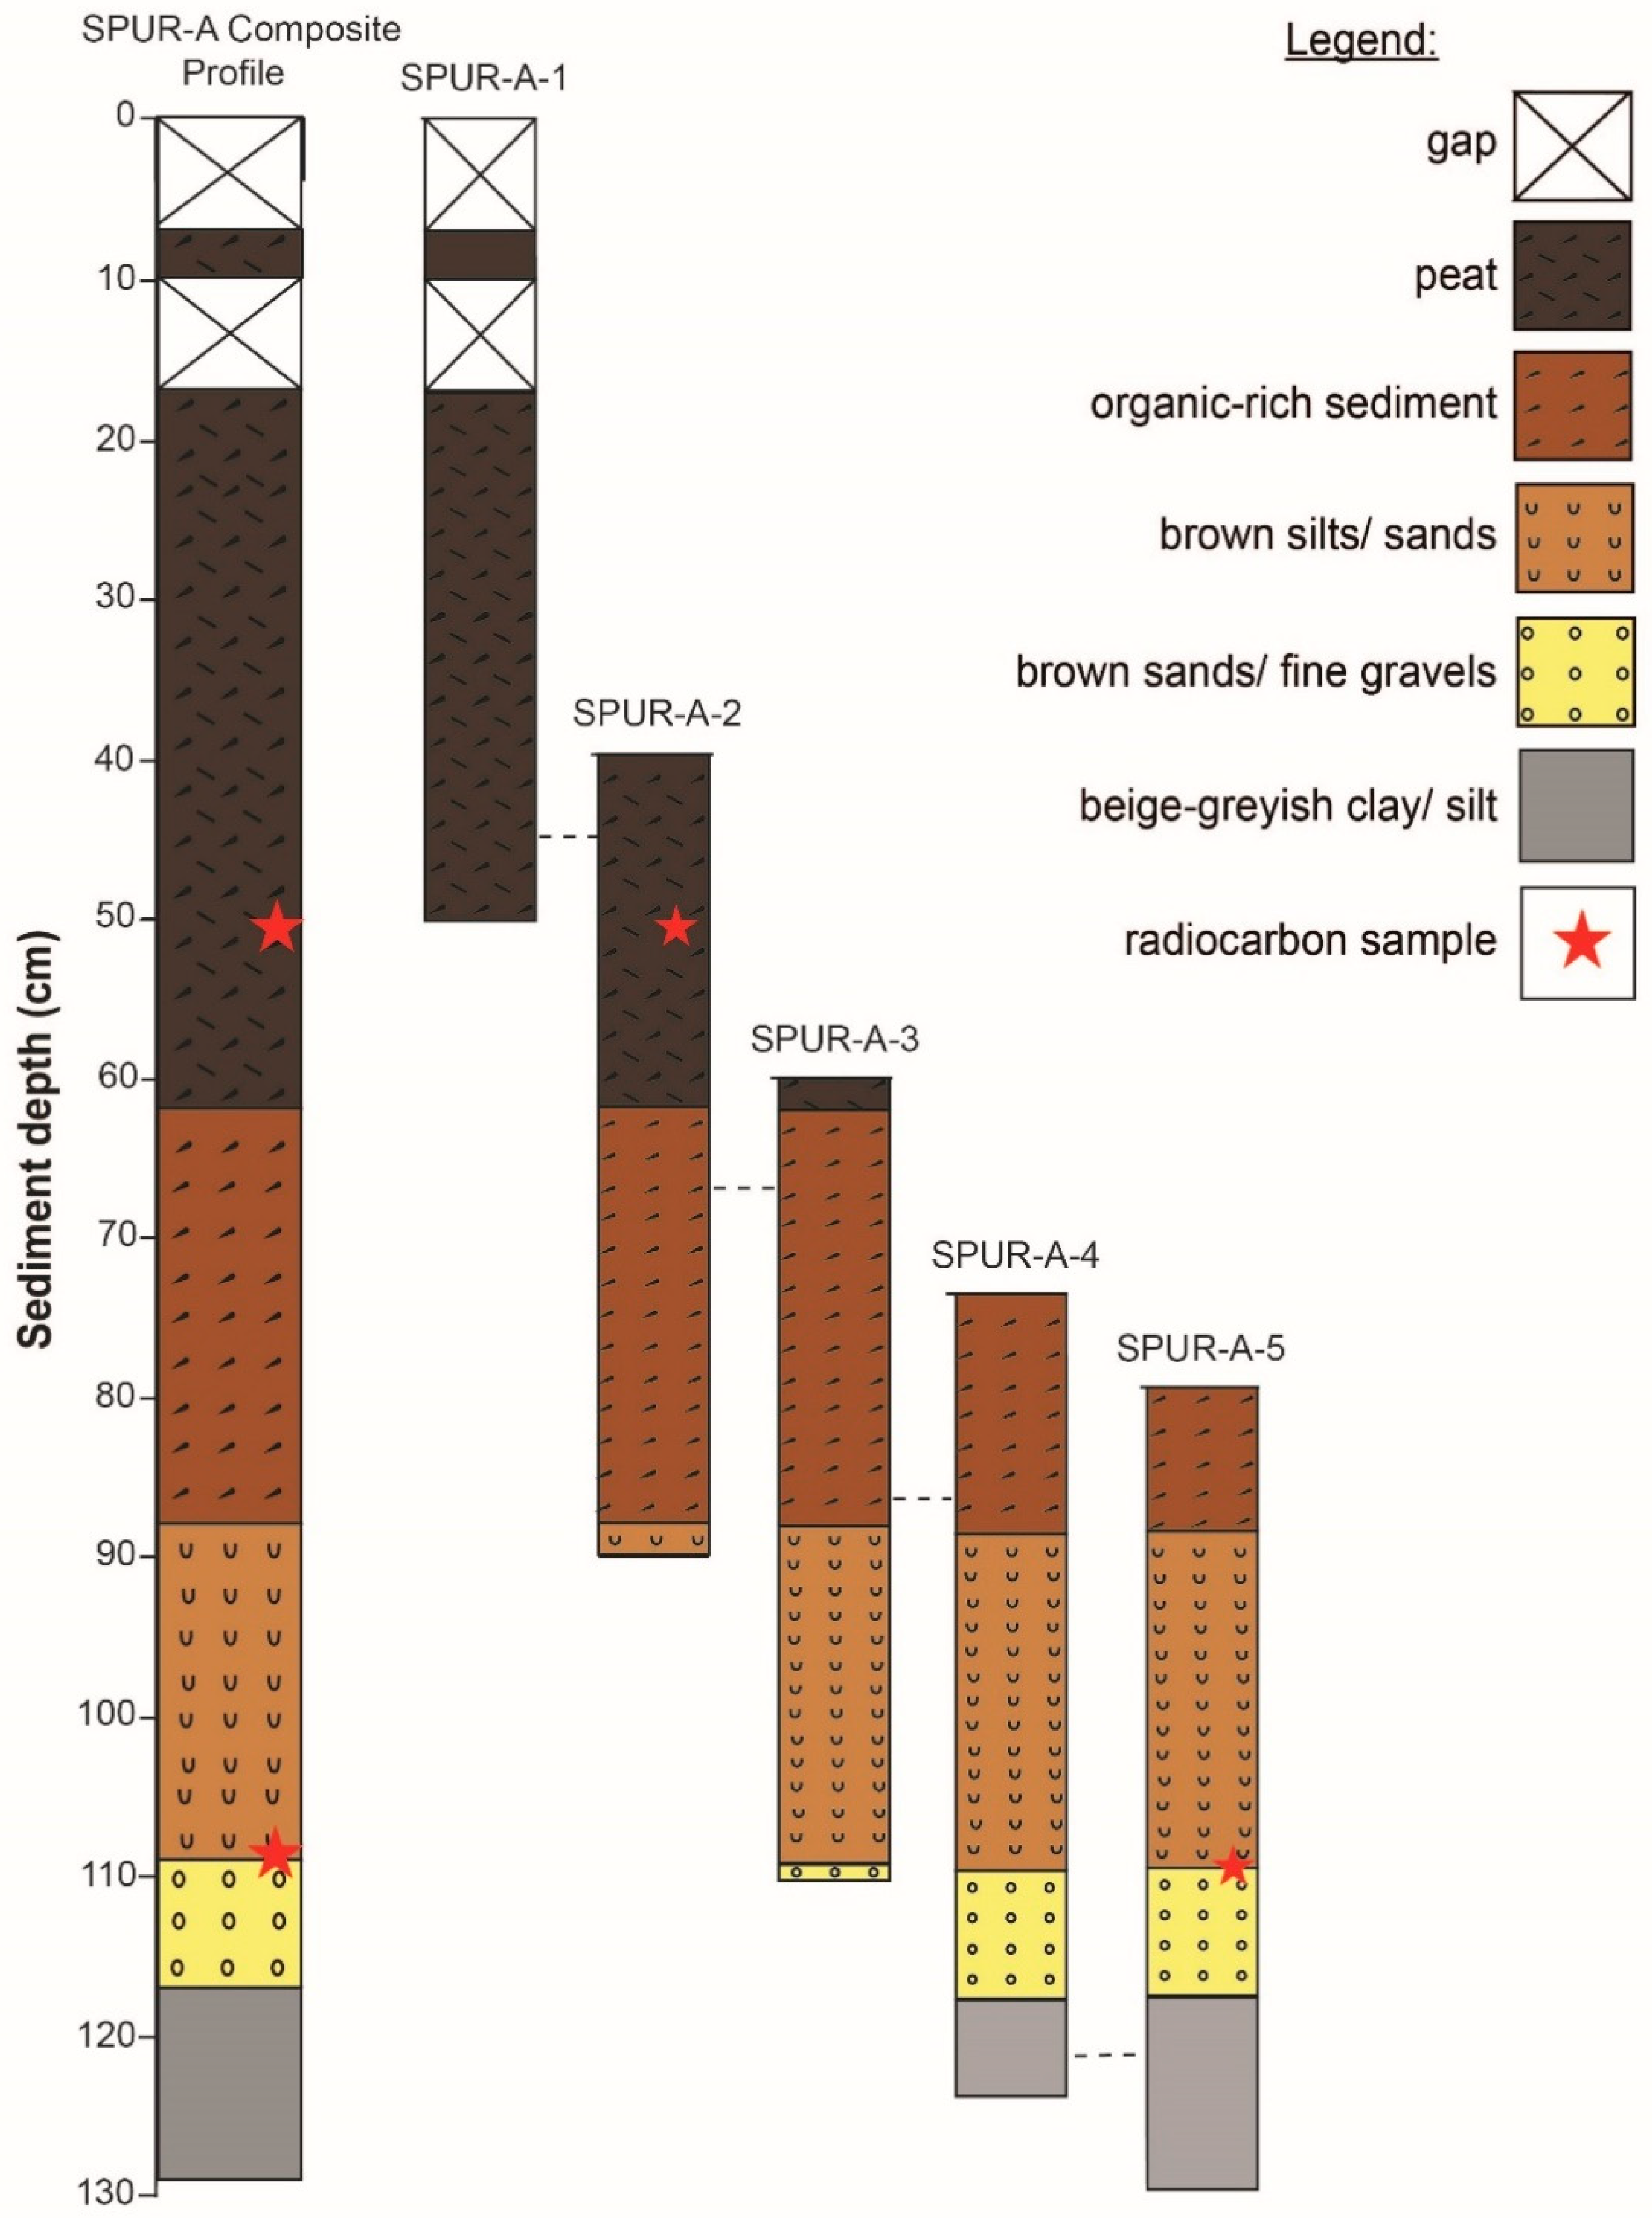
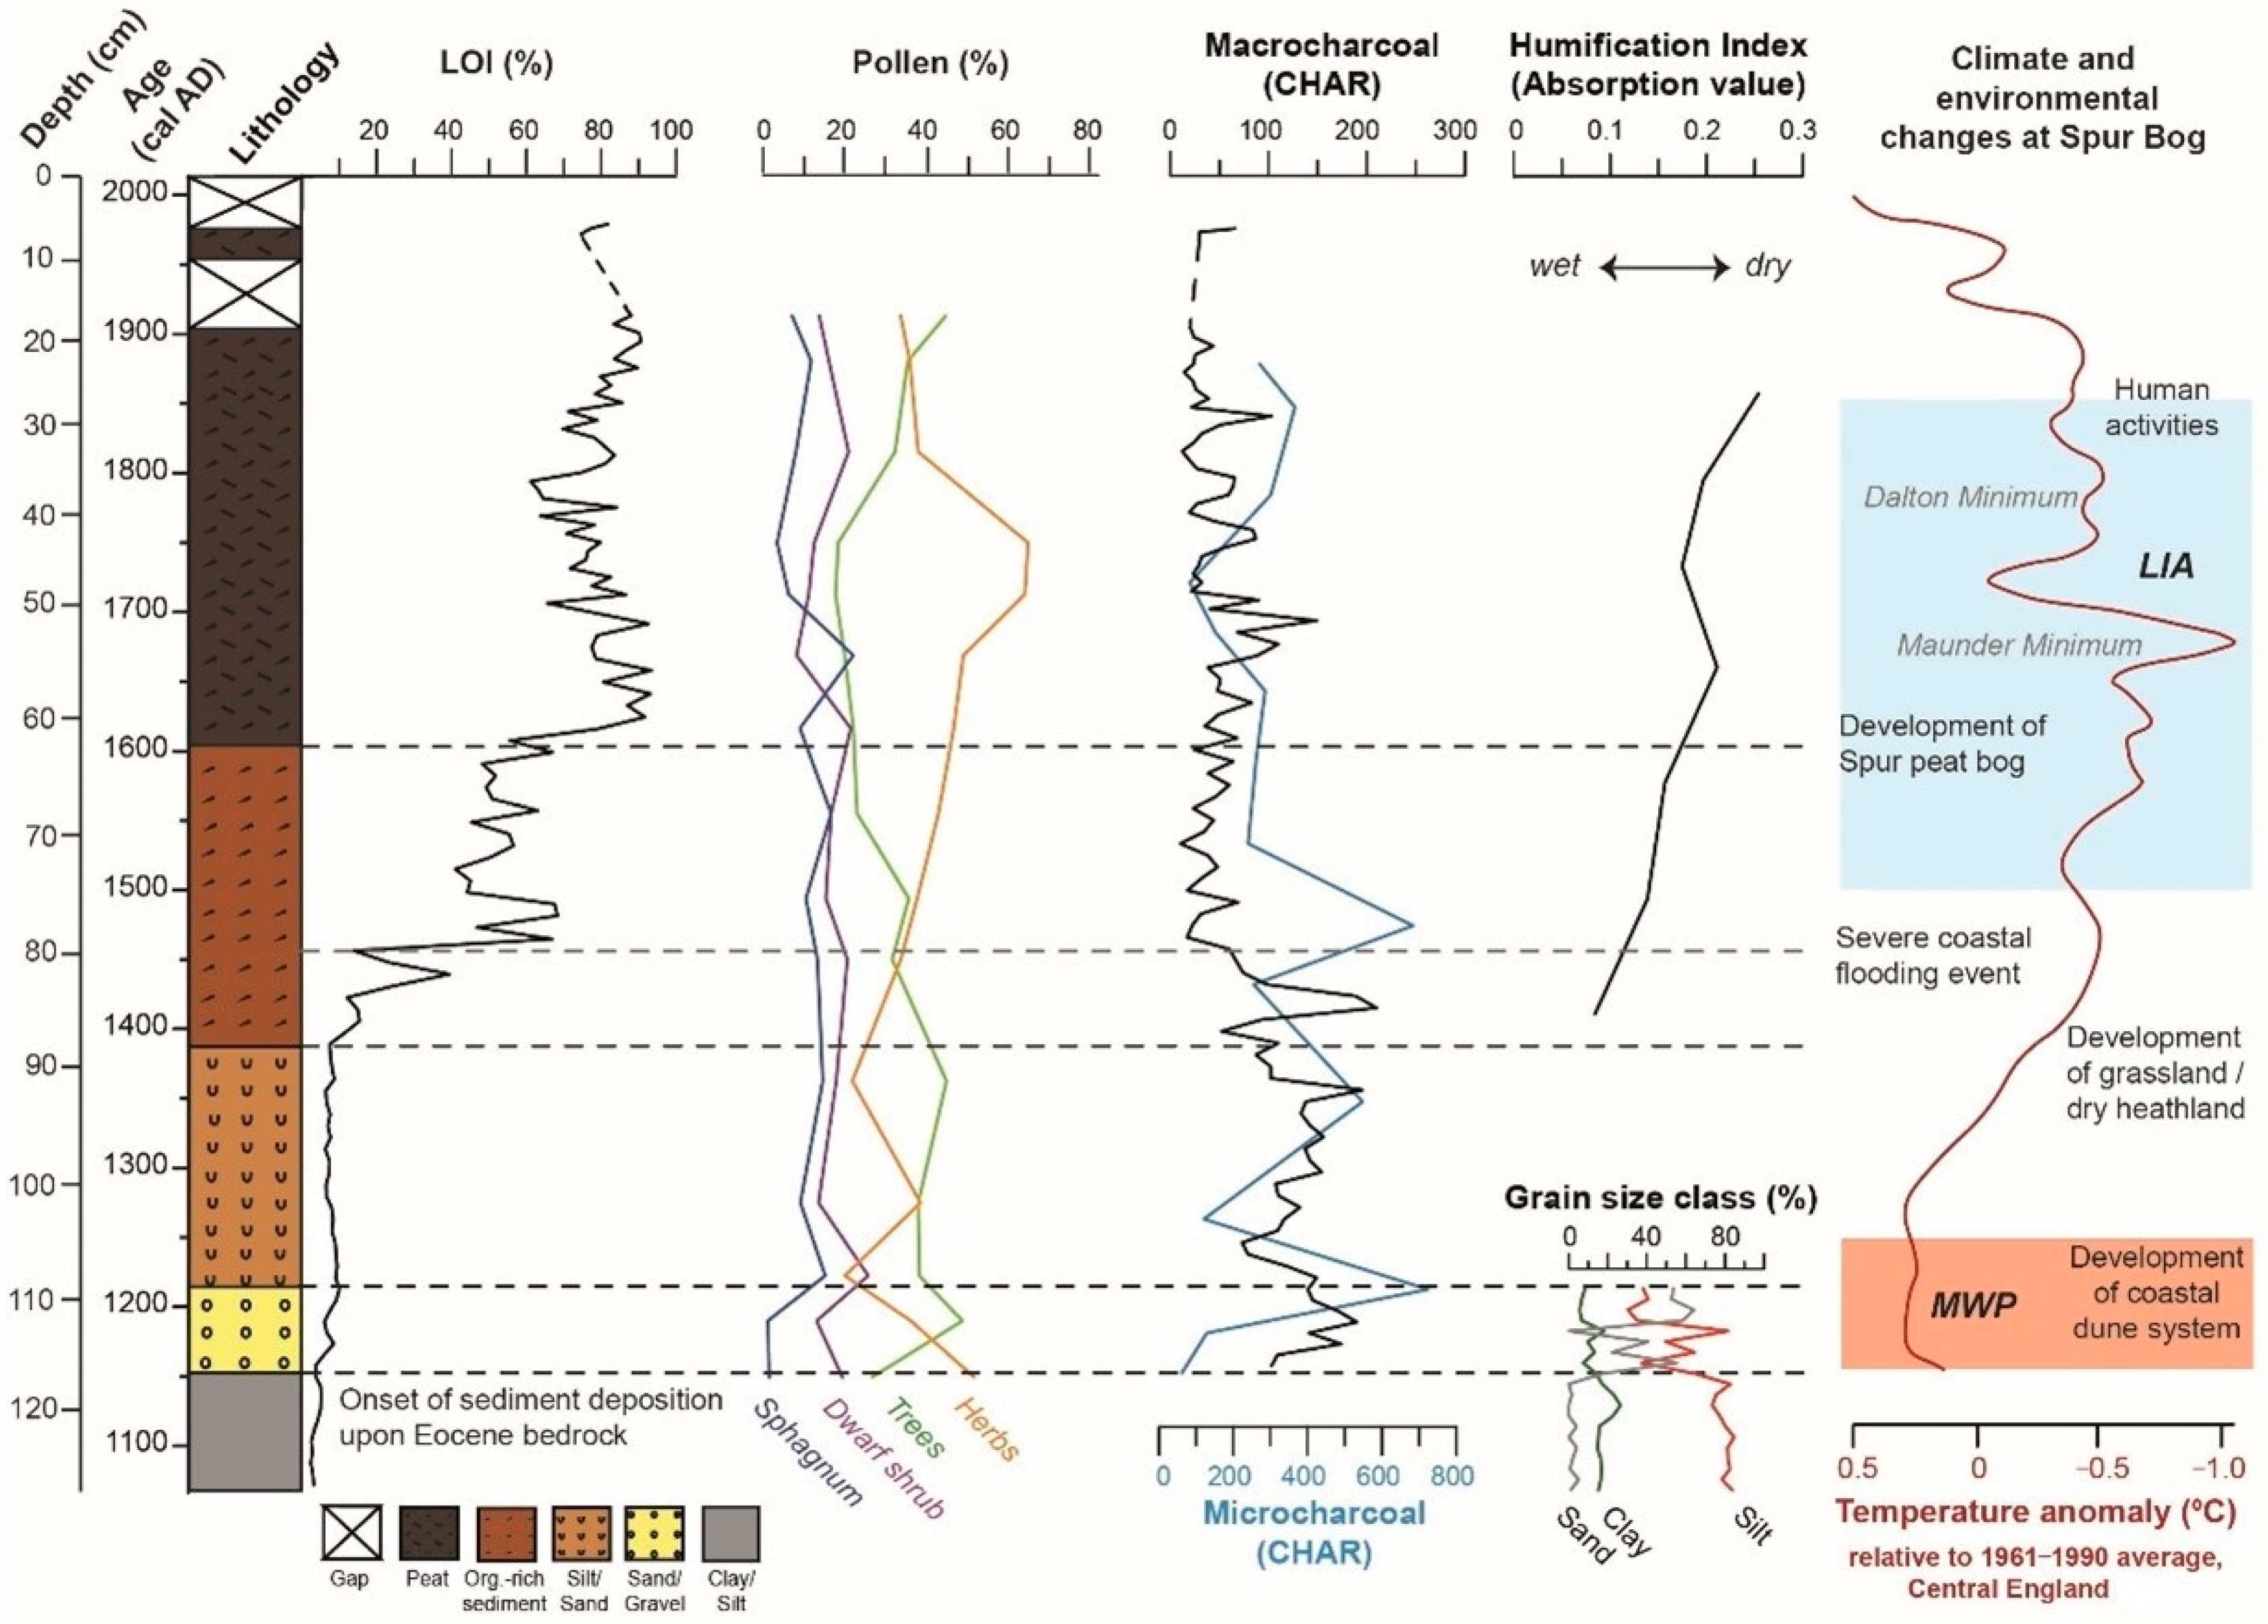
3.1. Lithology
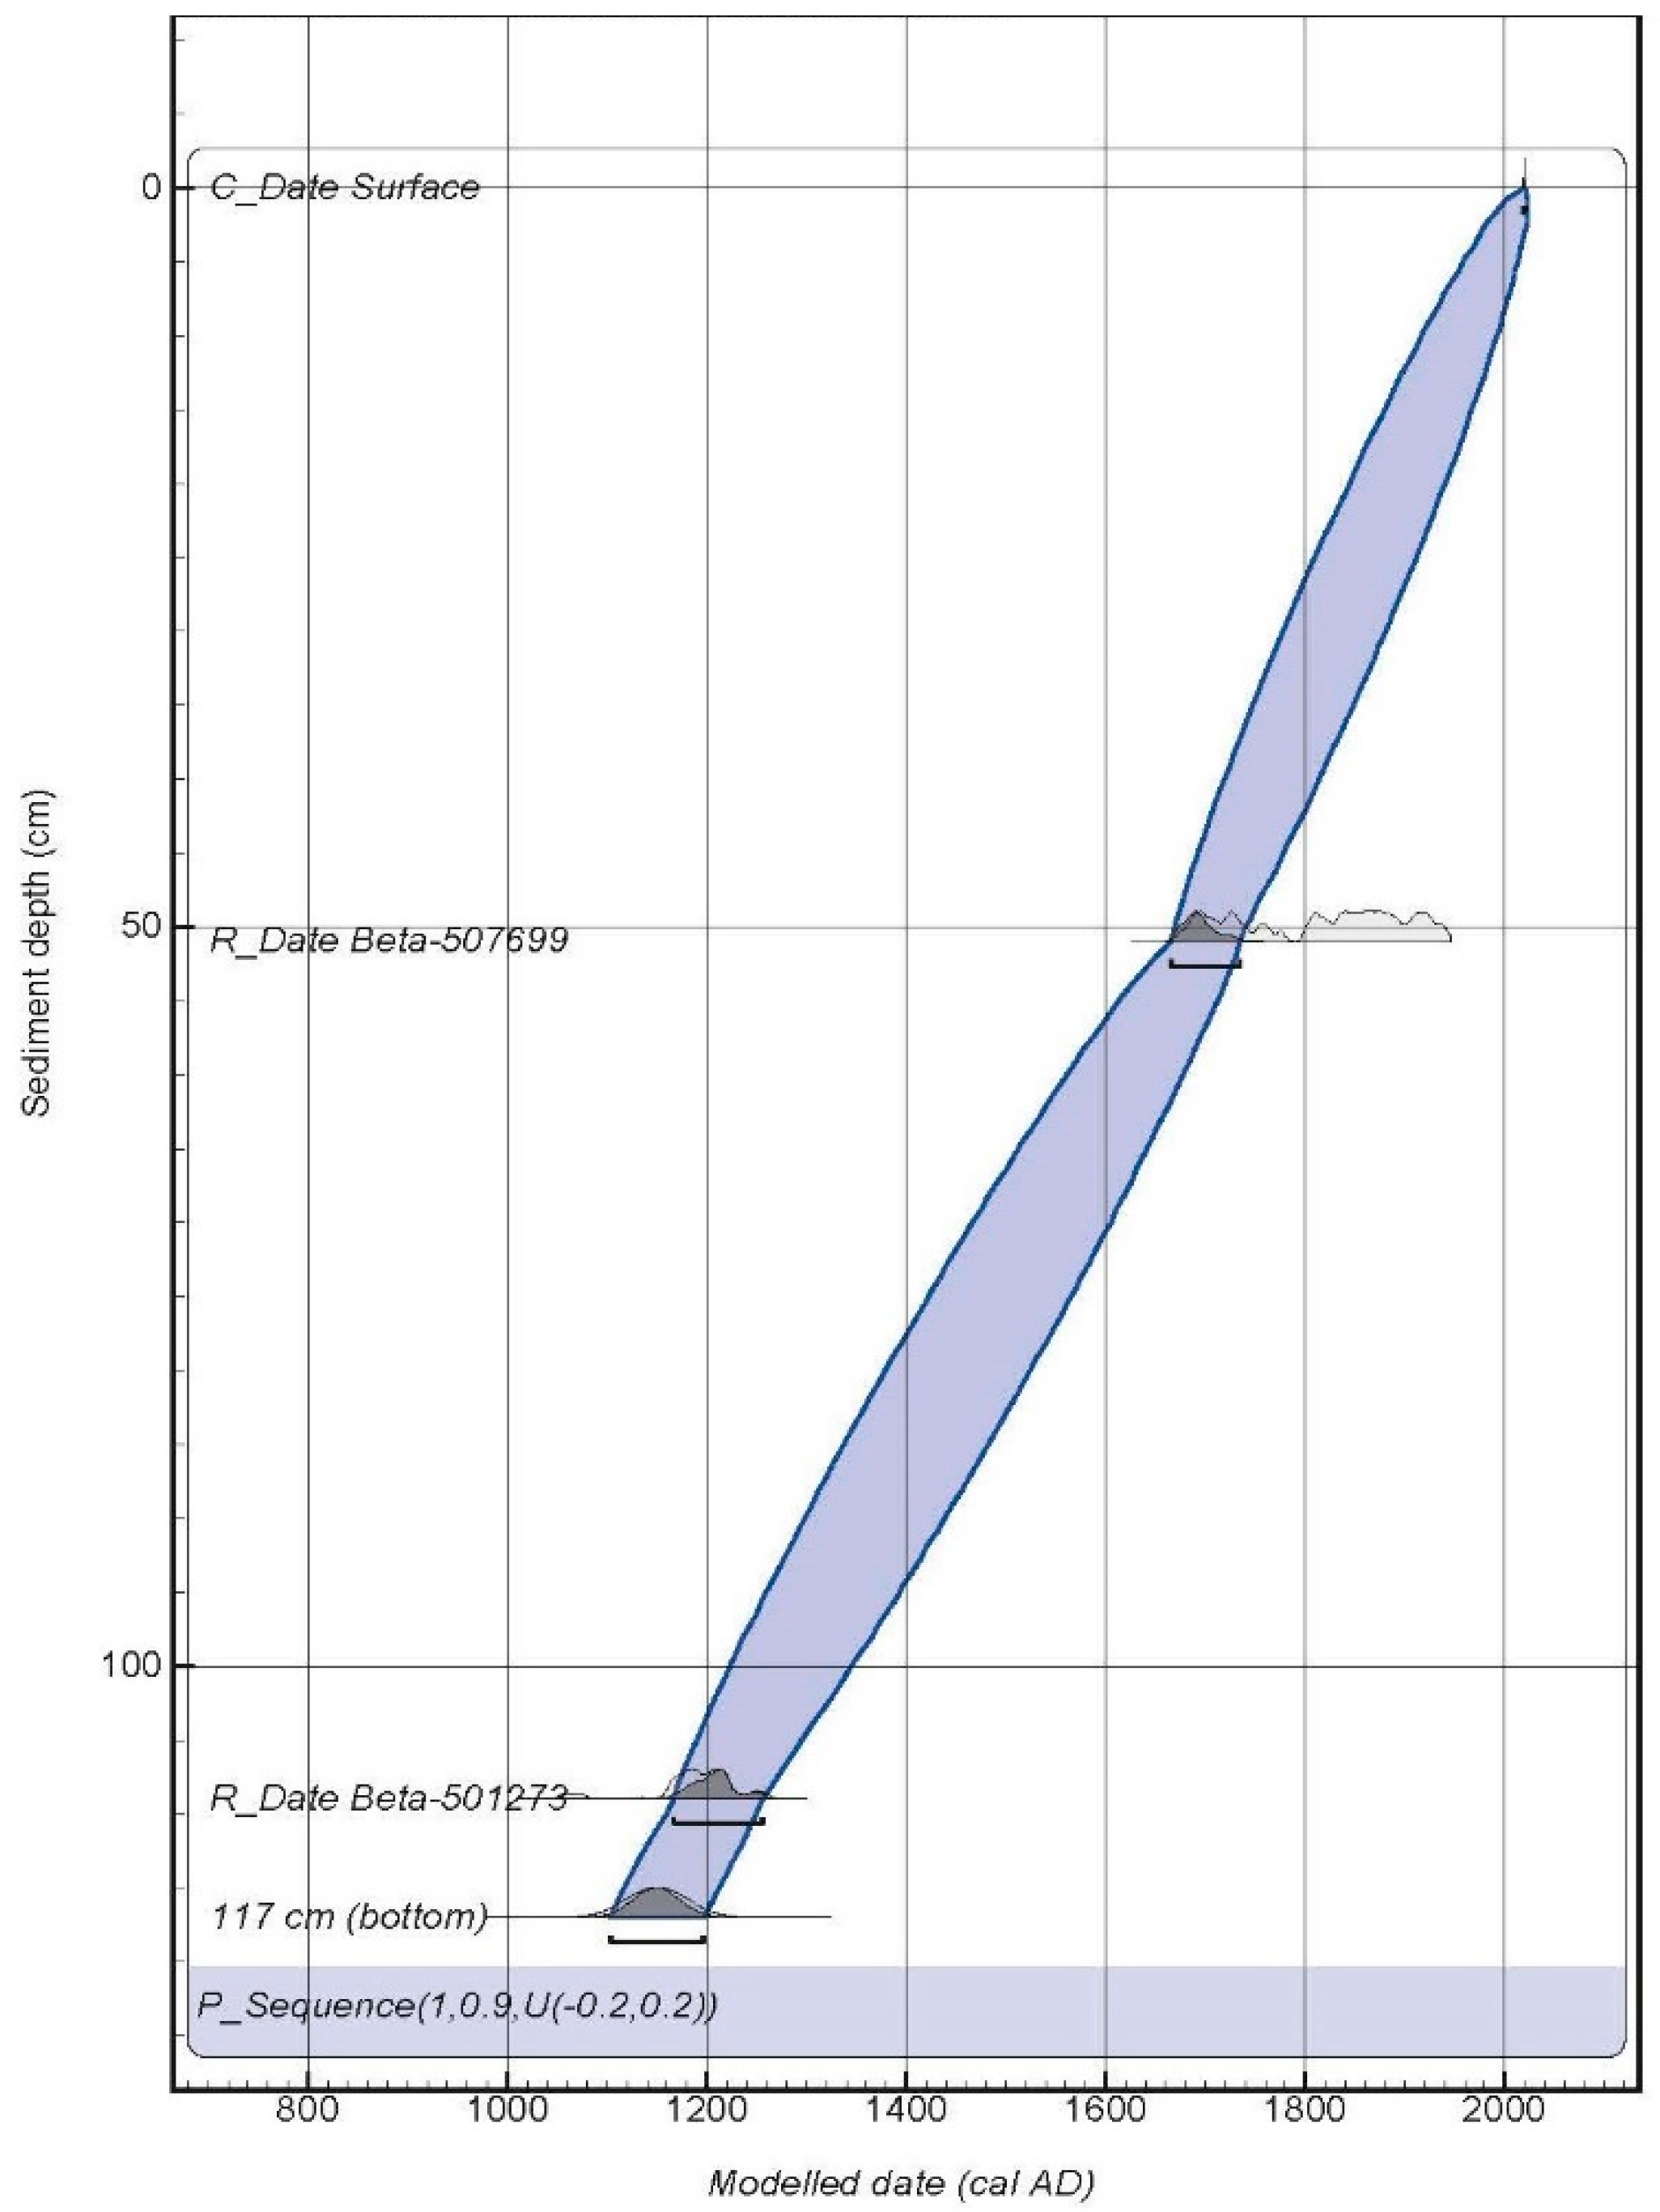
3.2. Chronology
3.3. LOI (Organic Matter Content)
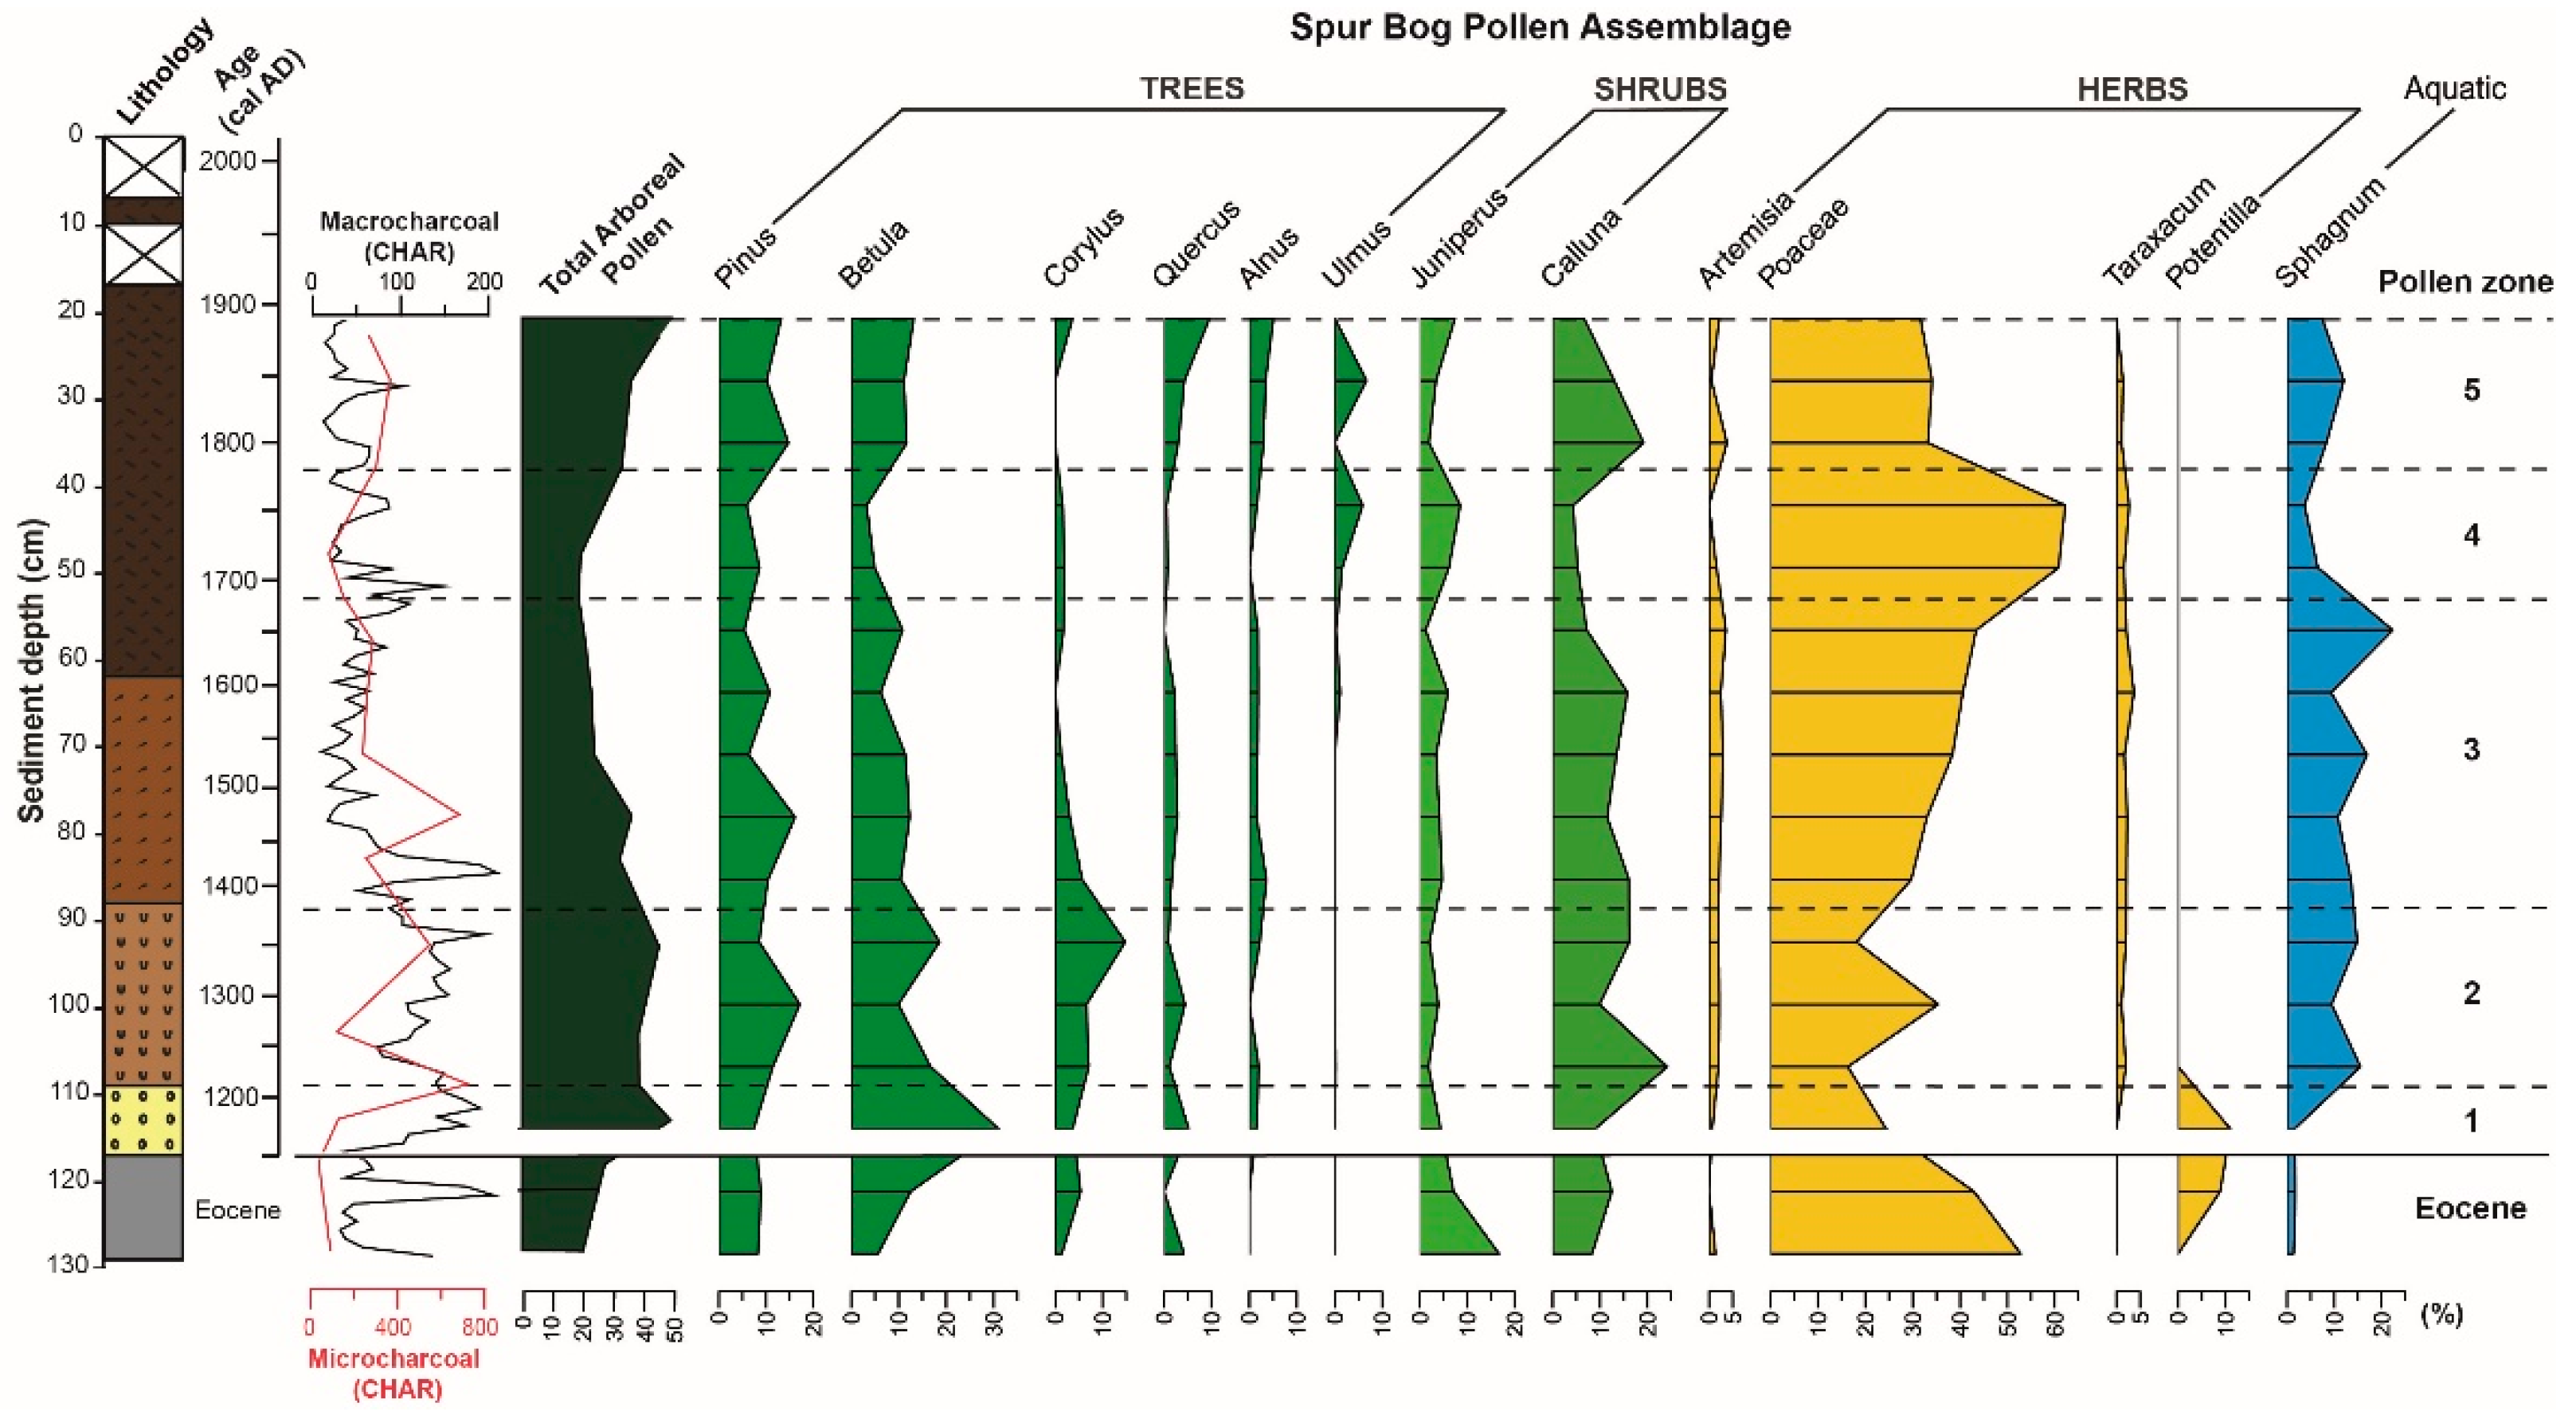
3.4. Pollen
3.4.1. Eocene Bedrock (128–117 cm)
3.4.2. Pollen Zone 1 (117–109 cm; ~1150 to ~1210 cal AD)
3.4.3. Pollen Zone 2 (109–88 cm; ~1210 to ~1390 cal AD)
3.4.4. Pollen Zone 3 (88–53 cm; ~1390 to 1680 cal AD)
3.4.5. Pollen Zone 4 (53–38 cm; ~1680 to 1780 cal AD)
3.4.6. Pollen Zone 5 (43–23 cm; ~1780 to 1880 cal AD)
3.5. Macro- and Microcharcoal
3.6. Grain Size
3.7. The Humification Index
4. Discussion
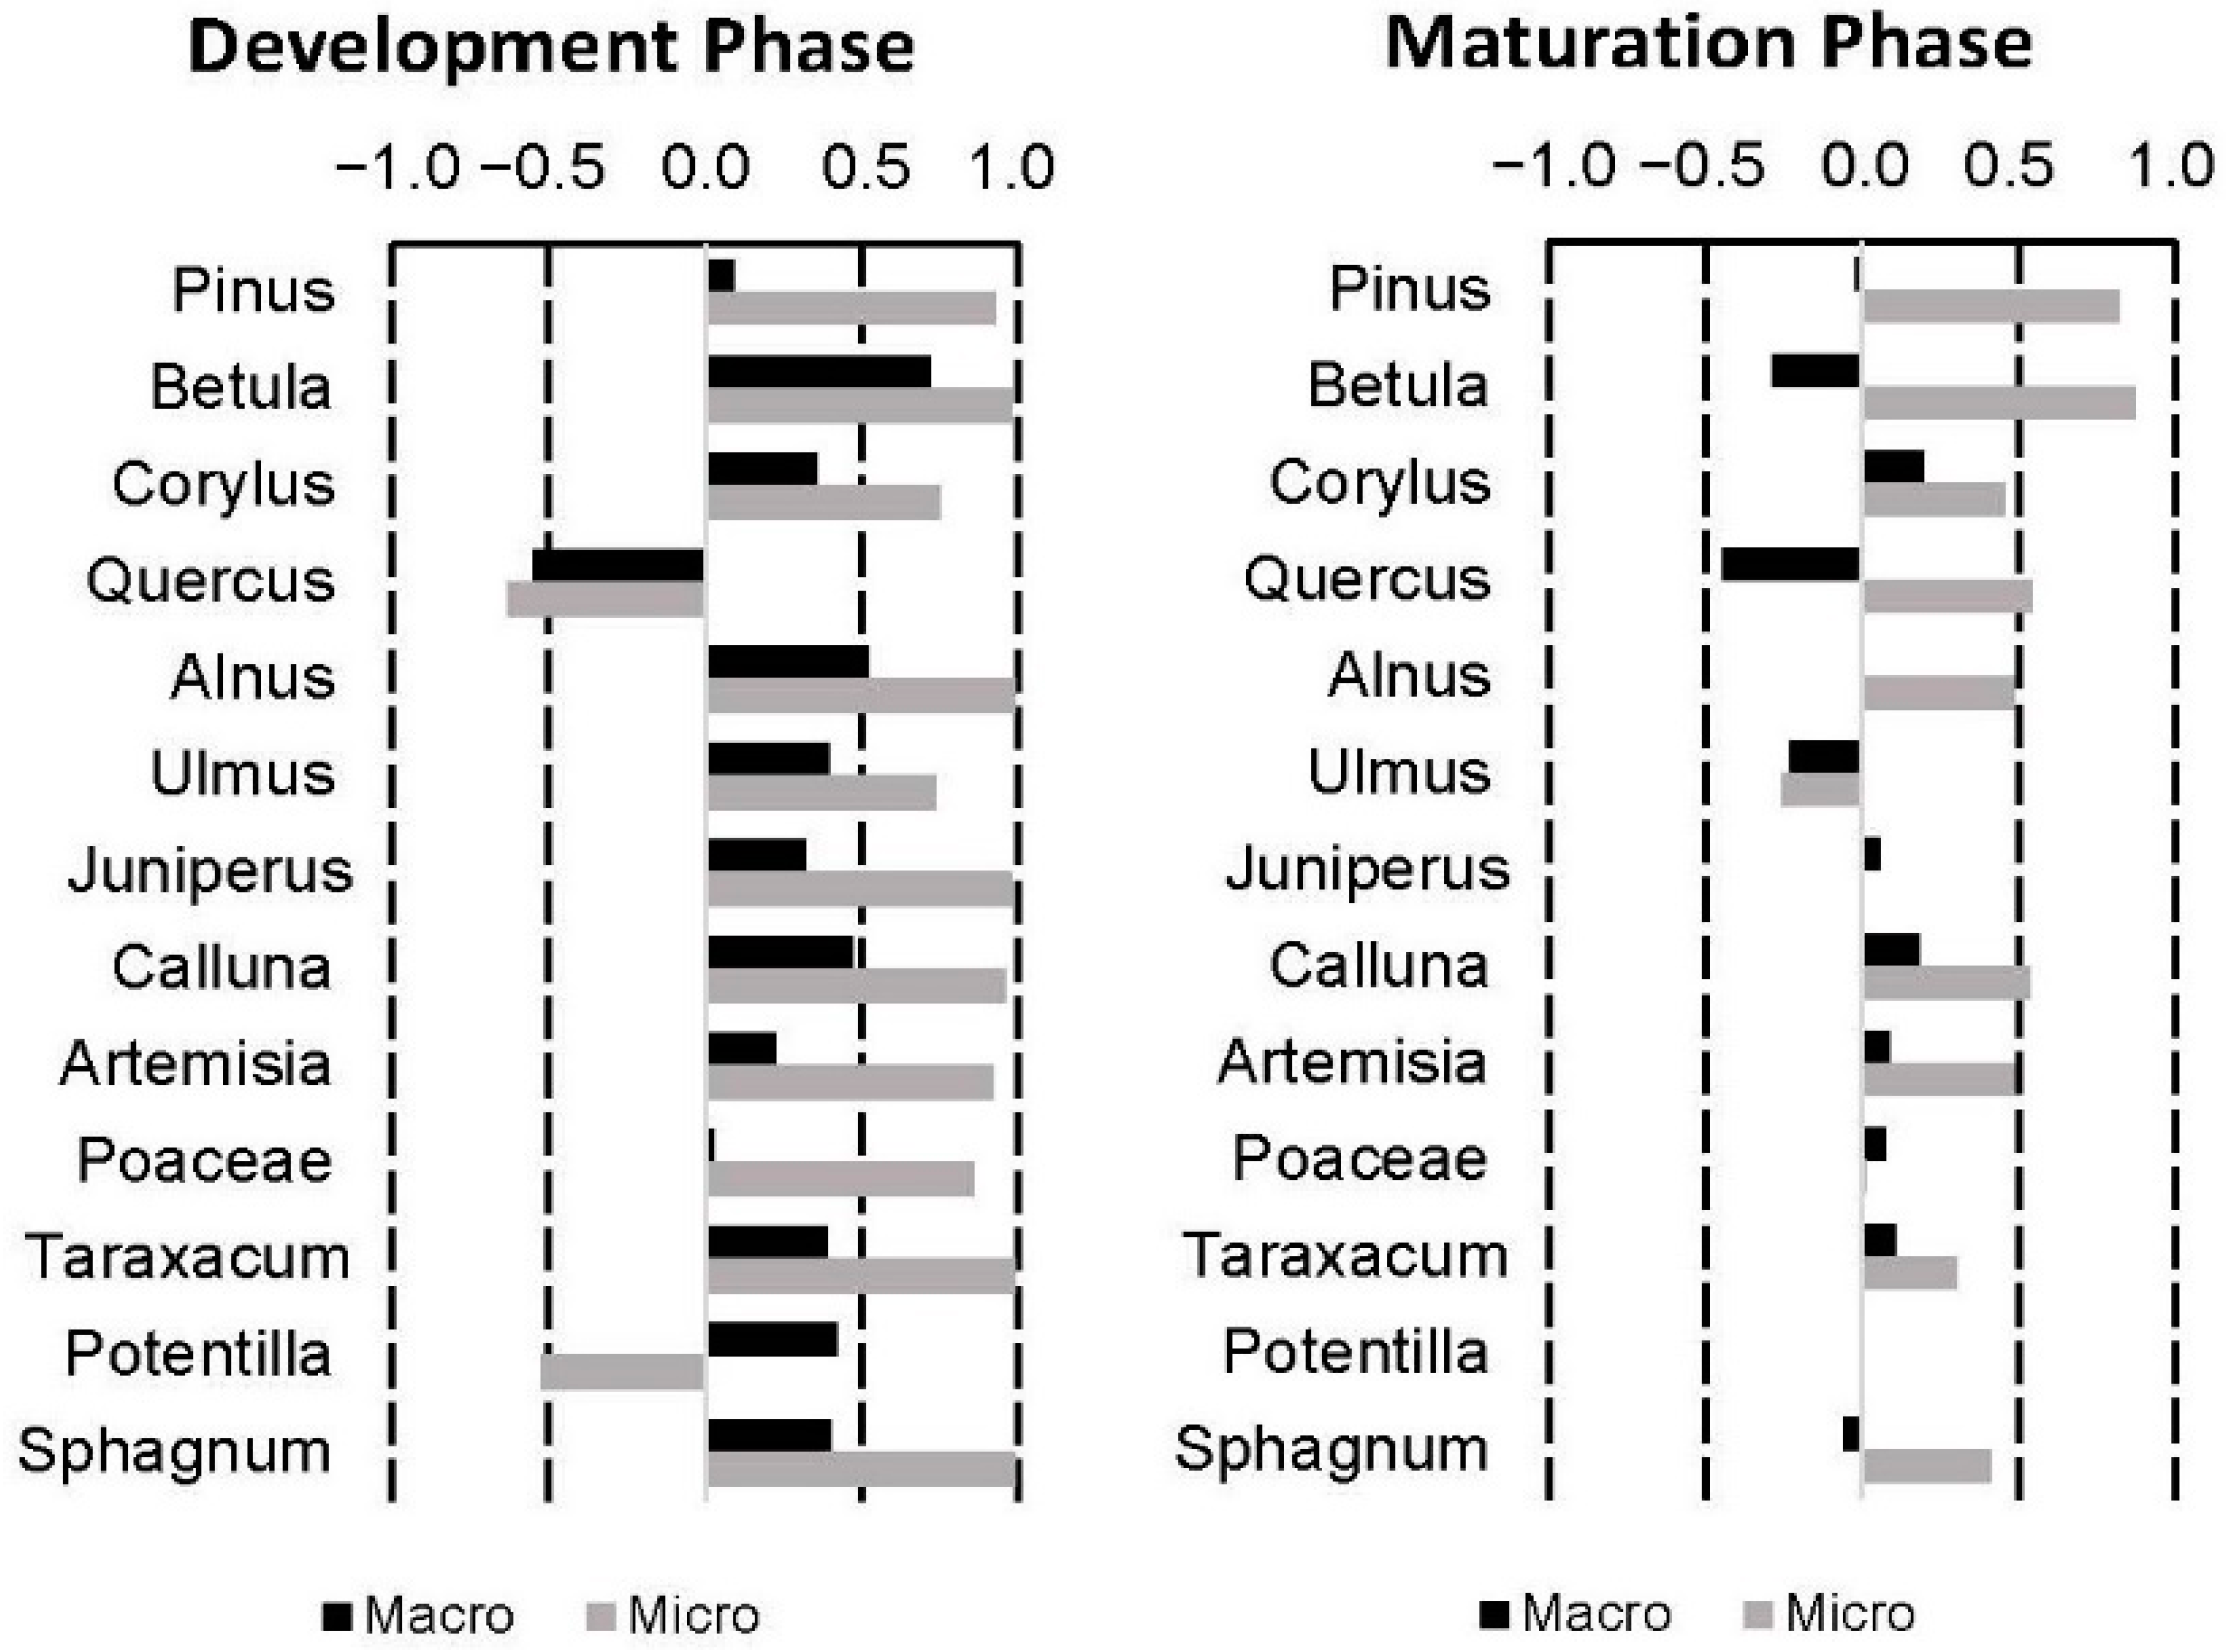
4.1. Relationships between Pollen Taxa and Wildfire Regime
4.2. Climate and Environmental Changes at Spur Bog since ~1150 cal AD
4.3. Geomorphological Changes of the South Haven Peninsula since ~1150 cal AD
5. Conclusions
Supplementary Materials
Author Contributions
Funding
Institutional Review Board Statement
Informed Consent Statement
Data Availability Statement
Acknowledgments
Conflicts of Interest
References
- Harik, G.; Alameddine, I.; Maroun, R.; Rachid, G.; Bruschi, D.; Garcia, D.A.; El-Fadel, M. Implications of adopting a biodiversity-based vulnerability index versus a shoreline environmental sensitivity index on management and policy planning along coastal areas. J. Environ. Manag. 2017, 187, 187–200. [Google Scholar] [CrossRef] [PubMed]
- Ward, N.D.; Megonigal, J.P.; Bond-Lamberty, B.; Bailey, V.L.; Butman, D.; Canuel, E.A.; Diefenderfer, H.; Ganju, N.K.; Goñi, M.A.; Graham, E.B.; et al. Representing the function and sensitivity of coastal interfaces in Earth system models. Nat. Commun. 2020, 11, 2458. [Google Scholar] [CrossRef] [PubMed]
- IPCC. Climate Change 2014: AR5 Synthesis Report. Contribution of Working Groups I, II and III to the Fifth Assessment Report of the Intergovernmental Panel on Climate Change; Core Writing Team, Pachauri, R.K., Meyer, L.A., Eds.; IPCC: Geneva, Switzerland, 2014; 151p. [Google Scholar]
- Nicholls, R.; Lowe, J.A. Benefits of mitigation of climate change for coastal areas. Glob. Environ. Change 2004, 14, 229–244. [Google Scholar] [CrossRef]
- Martínez, M.; Intralawan, A.; Vázquez, G.; Pérez-Maqueo, O.; Sutton, P. The coasts of our world: Ecological, economic and social importance. Ecol. Econ. 2007, 63, 254–272. [Google Scholar] [CrossRef]
- Diver, C. The physiography of South Haven Peninsula, Studland Heath, Dorset. Geogr. J. 1933, 81, 404–422. [Google Scholar] [CrossRef]
- Gray, A.J. Poole Harbour: Ecological Sensitivity Analysis of the Shoreline; Institute of Terrestrial Ecology: Huntingdon, UK, 1985; 36p. [Google Scholar]
- Long, A.J.; Scaife, R.G.; Edwards, R.J. Pine pollen in intertidal sediments from Poole Harbour, UK; implications for late-Holocene sediment accretion rates and sea-level rise. Quat. Int. 1999, 55, 3–16. [Google Scholar] [CrossRef]
- Edwards, R.J. Mid-to late Holocene relative sea-level change in Poole Harbour, southern England. J. Quat. Sci. 2001, 16, 221–235. [Google Scholar] [CrossRef]
- Cook, R.L. Spatial and Temporal Scales of the Morphodynamic Evolution within the Studland Complex. Ph.D. Thesis, Bournemouth University, Bournemouth, UK, 2007. [Google Scholar]
- The National Trust. Coastal Management Policy in Purbeck. 2019. Available online: https://nt.global.ssl.fastly.net/studland-bay/documents/coastal-management-policy-in-purbeck-february-2019.pdf (accessed on 19 July 2021).
- Bristow, C.R.; Freshney, E.C.; Penn, I.E. Geology of the Country around Bournemouth; Memoir of the Geological Survey of Great Britain; Sheet No. 329; HMSO: London, UK, 1991.
- Gale, A. 1. The geology of Poole Harbour. In The Ecology of Poole Harbour; Humphreys, J., May, V., Eds.; Proceedings in Marine Science; Elsevier: Amsterdam, The Netherlands, 2005; Volume 7, pp. 9–23. [Google Scholar]
- Studland and the South Haven Peninsula; Geology of the Wessex Coast of southern England—By Ian West. Available online: http://www.southampton.ac.uk/~imw/Studland.html (accessed on 10 August 2021).
- Arkell, W.J. The Geology of the Country around Weymouth, Swanage, Corfe and Lulworth; Memoir of the Geological Survey; H.M. Stationery Office: Richmond, UK, 1947; 386p.
- New Forest District Council. 2012 Update of Carter, D.; Bray, M.; Hooke, J. 2004. SCOPAC Sediment Transport Study. Available online: http://scopac.org.uk/sts (accessed on 25 April 2021).
- Treswell, R. Survey of the Isle of Purbeck. 1586. Available online: https://app.dorsetcouncil.gov.uk/bankes-archive/the-treswell-survey/ (accessed on 14 August 2021).
- Camden, W. Britannia Sive Florentissimorvm Regnorvm, Angliæ, Scotiæ, Hiberniæ, et Insularum Adiacentium ex Intima Antiquitate Chorographica Description; George Bishop and John Norton: London, UK, 1607; pp. 181–182. [Google Scholar]
- Lucas, P.J. William Camden, seventeenth-century atlases of the British Isles and the printing of Anglo-Saxon. Antiqu. J. 2018, 98, 219–244. [Google Scholar] [CrossRef]
- Blaeu, J. Comitatus Dorcestria, Sive Dorsettia: Vulgo Anglice Dorset Shire; Amsterdam, The Netherlands. 1645. Available online: https://collections.leventhalmap.org/search/commonwealth:ww72bp511 (accessed on 6 January 2022).
- Saxton, C. Christopher Saxton’s 16th Century Maps; Chatsworth Library: Los Angeles, CA, USA, 1992. [Google Scholar]
- Keuning, J. Blaeu’s Atlas: Imago Mundi; Taylor & Francis: Abingdon, UK, 1959; Volume 14, pp. 74–89. [Google Scholar]
- Avery, J. An Actual Survey of the Coast from Arundel Haven in Sussex to St Aldans in Dorsetshire. 1721. Available online: https://collections.rmg.co.uk/collections/objects/565476.html (accessed on 7 June 2021).
- Dummer, E.; Wiltshaw, T. South Coast of England Survey. 1698. Available online: https://collections.rmg.co.uk/collections/objects/544971.html (accessed on 10 June 2021).
- MacKenzie, M. Survey of the South Coast of England. 1785. Available online: https://www.dorsetlife.co.uk/2010/12/charting-poole-harbour/ (accessed on 25 July 2021).
- Sheringham, R.N. MS Plan; Hydrographic Department, Admiralty. 1849. Available online: https://assets.publishing.service.gov.uk/government/uploads/system/uploads/attachment_data/file/332228/UKHO-1849-Archives-Catalogue.pdf (accessed on 12 July 2021).
- Ordnance Survey. Dorset LI.SW. 1925. Available online: https://maps.nls.uk/view/101447375 (accessed on 12 January 2022).
- Lack, D.; Venables, L.S.V. The heathland birds of South Haven Peninsula, Studland Heath, Dorset. J. Anim. Ecol. 1937, 6, 62–72. [Google Scholar] [CrossRef]
- Alvin, K.L. Observations on the lichen ecology of South Haven peninsula, Studland Heath, Dorset. J. Ecol. 1960, 48, 331–339. [Google Scholar] [CrossRef]
- Liley, D.; Pickess, B.; Underhill-Day, J. The Number and Distribution of Black-Necked Grebes and Other Water Birds at Studland, Dorset; The Poole Harbour Study Group: Wareham, UK, 2006. [Google Scholar]
- Carr, A.P. Experiments on Longshore Transport and Sorting on Pebbles: Chesil Beach, England. J. Sediment. Petrol. 1971, 41, 1084–1104. [Google Scholar]
- Halcrow Group Limited. Poole Bay and Harbour Coastal Strategy Study: Assessment of Flood and Coast Defense Options Poole Bay; Halcrow Group Limited: Swindon, UK, 2004. [Google Scholar]
- May, V. Studland Beach: Changes in the Beach and Dunes and their Implications for Shoreline Management Between Poole Harbour and Old Harry; Report to National Trust; Department of Conservation Sciences, Bournemouth University: Bournemouth, UK, 1977; 26p. [Google Scholar]
- Long, A.J.; Tooley, M.J. Holocene sea-level and crustal movements in Hampshire and Southeast England, United Kingdom. J. Coastal. Res. 1995, 17, 299–310. [Google Scholar]
- Shennan, I.; Horton, B. Holocene land-and sea-level changes in Great Britain. J. Quat. Sci. 2002, 17, 511–526. [Google Scholar] [CrossRef]
- Moore, P.D.; Webb, J.A.; Collinson, M.E. Pollen Analysis; Blackwell Scientific Publications: Oxford, UK, 1991. [Google Scholar]
- Faegri, K.; Kaland, P.E.; Krzywinski, K. Textbook of Pollen Analysis, 4th ed.; John Wiley & Sons Ltd.: Chichester, UK, 1989. [Google Scholar]
- Juggins, S. Rioja: Analysis of Quaternary Science Data. 2020. Available online: https://cran.r-project.org/package=rioja (accessed on 14 January 2021).
- Finsinger, W.; Kelly, R.; Fevre, J.; Magyari, E.K. A guide to screening charcoal peaks in macrocharcoal-area records for fire-episode reconstructions. Holocene 2014, 24, 1002–1008. [Google Scholar] [CrossRef]
- Chambers, F.M.; Beilman, D.W.; Yu, Z. Methods for determining peat humification and for quantifying peat bulk density, organic matter and carbon content for palaeostudies of climate and peatland carbon dynamics. Mires Peat 2011, 7, 1–10. [Google Scholar]
- Reimer, P.J.; Austin, W.E.N.; Bard, E.; Bayliss, A.; Blackwell, P.G.; Bronk Ramsey, C.; Butzin, M.; Cheng, H.; Edwards, R.L.; Friedrich, M.; et al. The IntCal20 Northern Hemisphere Radiocarbon Age Calibration Curve (0–55 cal kBP). Radiocarbon 2020, 62, 725–757. [Google Scholar] [CrossRef]
- Bronk Ramsey, C. OxCal Version 4.4.2. 2020. Available online: https://c14.arch.ox.ac.uk/oxcal.html (accessed on 4 August 2021).
- Brown, A.G.; Carpenter, R.G.; Walling, D.E. Monitoring Fluvial Pollen Transport, its Relationship to Catchment Vegetation and Implications for Palaeoenvironmental Studies. Rev. Palaeobot. Palynol. 2007, 147, 60–76. [Google Scholar] [CrossRef] [Green Version]
- Tinner, W.; Conedera, M.; Gobet, E.; Hubschmid, P.; Wehrli, M.; Ammann, B. A palaeoecological attempt to classify fire sensitivity of trees in the southern Alps. Holocene 2000, 10, 565–574. [Google Scholar] [CrossRef]
- Finsinger, W.; Tinner, W.; van der Knaap, W.O.; Ammann, B. The expansion of hazel (Corylus avellana L.) in the southern Alps: A key for understanding its early Holocene history in Europe? Quat. Sci. Rev. 2006, 25, 612–631. [Google Scholar] [CrossRef]
- Gottschalk, M.K.E. Storm Surges and River Floods in The Netherlands I (The Period 1400–1600); Van Gorcum: Assen, The Netherlands, 1975. [Google Scholar]
- Lamb, H.H. Climate, History and the Modern World; Methuen: London, UK, 1982. [Google Scholar]
- Lamb, H.H.; Frydendahl, K. Historic Storms of the North Sea, British Isles and Northwest Europe; Cambridge University Press: Cambridge, UK, 1991. [Google Scholar]
- Wilcox, D.A.; Andrus, R.E. The role of Sphagnum fimbriatum in secondary succession in a road salt impacted bog. Can. J. Bot. 1987, 65, 2270–2275. [Google Scholar] [CrossRef] [Green Version]
- Vasquez, E.A.; Glenn, E.P.; Guntenspergen, G.R.; Brown, J.J.; Nelson, S.G. Salt tolerance and osmotic adjustment of Spartina alterniflora (Poaceae) and the invasive M haplotype of Phragmites australis (Poaceae) along a salinity gradient. Am. J. Bot. 2006, 93, 1784–1790. [Google Scholar] [CrossRef] [PubMed]
- Stofberg, S.F.; Klimkowska, A.; Paulissen, M.P.C.P.; Witte, J.P.M. Potential Sensitivity of Fen Plant Species to Salinity; Knowledge for Climate Programme Office: Utrecht, The Netherlands, 2014; Volume 113, 59p.
- Lamb, H.H.; Brooks, C.E.P. The English Climate; English Universities Press: London, UK, 1964. [Google Scholar]
- Brazell, J.H. London Weather; HMSO: London, UK, 1968.
- Goosse, H.; Arzel, O.; Luterbacher, J.; Mann, M.E.; Renssen, H.; Riedwyl, N.; Timmermann, A.; Xoplaki, E.; Wanner, H. The origin of the European “Medieval Warm Period”. Clim. Past 2006, 2, 99–113. [Google Scholar] [CrossRef] [Green Version]
- Chambers, F. The ‘Little Ice Age’: The first virtual issue of The Holocene. Holocene 2016, 26, 335–337. [Google Scholar] [CrossRef]
- Ilyashuk, E.A.; Heiri, O.; Ilyashuk, B.P.; Koinig, K.A.; Psenner, R. The Little Ice Age signature in a 700-year high-resolution chironomid record of summer temperatures in the Central Eastern Alps. Clim. Dyn. 2019, 52, 6953–6967. [Google Scholar] [CrossRef] [PubMed] [Green Version]
- Webb, N.R.; Haskins, L.E. An ecological survey of heathlands in the Poole Basin, Dorset, England, in 1978. Biol. Conserv. 1980, 17, 281–296. [Google Scholar] [CrossRef]
- Rumsby, B.T.; Macklin, M.G. River Response to the Last Neoglacial (The ‘Little Ice Age’) in Northern, Western and Central Europe; Geological Society, Special Publications: London, UK, 1996; Volume 115, pp. 217–233. [Google Scholar]
- Mörner, N.A. Solar Minima, Earth’s rotation and Little Ice Ages in the past and in the future: The North Atlantic-European case. Glob. Planet. Change 2010, 72, 282–293. [Google Scholar] [CrossRef]
- Macadam, J. English Weather: The Seventeenth-Century Diary of Ralph Josselin. J. Interdiscip. Hist. 2012, 43, 221–246. [Google Scholar] [CrossRef]
- Alheit, J.; Hagen, E. Long-term climate forcing of European herring and sardine populations. Fish. Oceanogr. 1997, 6, 130–139. [Google Scholar] [CrossRef]
- Reid, G.C. Solar forcing of global climate change since the mid-17th century. Clim. Change 1997, 37, 391–405. [Google Scholar] [CrossRef]
- Parker, G. Global Crisis: War, Climate Change, & Catastrophe in the Seventeenth Century; Yale University Press: New Haven, CT, USA, 2013. [Google Scholar]
- Gonzáles-Hidalgo, J.C.; Peña-Angulo, D.; Beguería, S. Temporal variations of trends in the Central England temperature series. Cuad. Investig. Geográfica 2020, 46, 345–369. [Google Scholar] [CrossRef] [Green Version]
- Barbour-Mercer, S.A. Prosecution and Process: Crime and Criminal Law in Late Seventeenth-Century Yorkshire. Ph.D. Thesis, University of York, York, UK, 1988. [Google Scholar]
- Waddell, B. Governing England through the manor courts, 1550–1850. Hist. J. 2012, 55, 279–315. [Google Scholar] [CrossRef] [Green Version]
- Natural England. Dorset’s Purple Patch: Dorset Heathlands from Pre-History to the Present Day. 2015. Available online: https://www.poole.gov.uk (accessed on 10 January 2022).
- McGrath, M.J.; Luyssaert, S.; Meyfroidt, P.; Kaplan, J.O.; Bürgi, M.; Chen, Y.; Erb, K.; Gimmi, U.; McInerney, D.; Naudts, K.; et al. Reconstructing European forest management from 1600 to 2010. Biogeosciences 2015, 12, 4291–4316. [Google Scholar] [CrossRef] [Green Version]
- Parker, D.E.; Legg, T.P.; Folland, C.K. A new daily Central England Temperature Series, 1772–1991. Int. J. Climatol. 1992, 12, 317–342. [Google Scholar] [CrossRef]
- Alexander, L.V.; Jones, P.D. Updated precipitation series for the UK and discussion of recent extremes. Atmos. Sci. Lett. 2001, 1, 142–150. [Google Scholar] [CrossRef]
- Stagg, D.J. A Calendar of New Forest Documents: The Fifteenth to the Seventeenth Centuries; Hampshire Record Office for Hampshire County Council: Winchester, UK, 1983.
- Tavener, L.E. Dorset. Part 88 in The Land of Britain; The Report of the Land Utilization Survey of Britain; Dudley Stamp: London, UK, 1940. [Google Scholar]
- Moore, N.W. The heaths of Dorset and their conservation. J. Ecol. 1962, 50, 369–391. [Google Scholar] [CrossRef]
- Wigley, T.M.L.; Lough, J.M.; Jones, P.D. Spatial patterns of precipitation in England and Wales and a revised, homogeneous England and Wales precipitation series. J. Climatol. 1984, 4, 1–25. [Google Scholar] [CrossRef]
- Durschmied, E. The Weather Factor; Hodder & Stoughton: London, UK, 2000. [Google Scholar]
- Grove, J.M. The Little Ice Age; Routledge: London, UK, 2012. [Google Scholar]
- Fagan, B. The Little Ice Age: How Climate Made History 1300–1850; Hachette: New York, NY, USA, 2019. [Google Scholar]
- Brooks, C.E.P. Climate in Everyday Life; Ernest Benn: London, UK, 1950. [Google Scholar]
- Legg, R. Brownsea: Dorset’s Fantasy Island; The Dorset Publishing Company: Sherborne, UK, 1986; 80p. [Google Scholar]
- Garnett, O. Brownsea Castle; The National Trust: Swindon, UK, 2005. [Google Scholar]
- Wilson, K. The Time Factor in the Development of Dune Soils at South Haven Peninsula, Dorset. J. Ecol. 1960, 48, 341–359. [Google Scholar] [CrossRef]
- Lane, F.W. The Elements Rage. Newton Abbot: David and Charles. Q. J. R. Meteorol. Soc. 1966, 93, 280. [Google Scholar]
- Owens, M.J.; Lockwood, M.; Hawkins, E.; Usoskin, I.; Jones, G.S.; Barnard, L.; Schurer, A.; Fasullo, J. The Maunder minimum and the Little Ice Age: An update from recent reconstructions and climate simulations. J. Space Weather Space Clim. 2017, 7, A33. [Google Scholar] [CrossRef]
- Zumbühl, H.J.; Steiner, D.; Nussbaumer, S.U. 19th century glacier representations and fluctuations in the central and western European Alps: An interdisciplinary approach. Glob. Planet. Change 2008, 60, 42–57. [Google Scholar] [CrossRef]
- Good, R. A Geographical Handbook of the Dorset Flora; The Dorset Natural History and Archaeological Society, County Museum: Dorchester, UK, 1948; 255p. [Google Scholar]
- Mahdi, H. Preservation Plan for Studland and Godlingston heaths in Dorset. Ph.D. Thesis, Newcastle University, Newcastle, UK, 2015. [Google Scholar]
- Webb, N.R. Changes on the heathlands of Dorset, England between 1978 and 1987. Biol. Conserv. 1990, 51, 272–286. [Google Scholar] [CrossRef]
- Rose, R.J.; Webb, N.R.; Clarke, R.T.; Traynor, C.H. Changes on the heathlands in Dorset, England, between 1987 and 1996. Biol. Conserv. 2000, 93, 117–125. [Google Scholar] [CrossRef]
- Forup, M.L.; Henson, K.S.; Craze, P.G.; Memmott, J. The restoration of ecological interactions: Plant-pollinator networks on ancient and restored heathlands. J. Appl. Ecol. 2008, 45, 742–752. [Google Scholar] [CrossRef] [Green Version]
- Carroll, T.; Gillingham, P.K.; Stafford, R.; Bullock, J.M.; Diaz, A. Improving estimates of environmental change using multilevel regression models of Ellenberg indicator values. Ecol. Evol. 2018, 8, 9739–9750. [Google Scholar] [CrossRef] [PubMed]
- Carroll, T. Unravelling Abiotic and Biotic Drivers of Biodiversity Change in Local Plant and Invertebrate Communities after 80 Years-a Re-Visitation Study on the Studland Peninsula. Ph.D. Thesis, Bournemouth University, Bournemouth, UK, 2020. [Google Scholar]
- Kragh, G. The motivations of volunteers in citizen science. Environ. Sci. 2016, 25, 32–35. [Google Scholar]
- Munns, L.H. Is It All about the Ants? What Are the Factors Influencing the Presence of Plebejus Argus (The Silver-Studded Blue Butterfly) On Studland Peninsula? Ph.D. Thesis, Bournemouth University, Bournemouth, UK, 2017. [Google Scholar]


| Sample ID | Material | Depth (cm) | 14C Age (a BP), 2 σ Error | Calibrated Age (cal BP), 2 σ Error (Median) | Modelled Age (cal BP/cal AD) |
|---|---|---|---|---|---|
| Beta-507699 | Wood macrofossil | 51 | 130 ± 30 | 143 ± 135 (116) | 250/1700 AD |
| Beta-501273 | Wood macrofossil | 109 | 860 ± 30 | 793 ± 104 (758) | 740/1210 AD |
Publisher’s Note: MDPI stays neutral with regard to jurisdictional claims in published maps and institutional affiliations. |
© 2022 by the authors. Licensee MDPI, Basel, Switzerland. This article is an open access article distributed under the terms and conditions of the Creative Commons Attribution (CC BY) license (https://creativecommons.org/licenses/by/4.0/).
Share and Cite
Howlett, D.; Wulf, S.; Wharram, S.; Hardiman, M.; Byrne, H. Ecological and Wildfire Responses to Rapid Landscape Changes within the Last ~900 Years on the South Haven Peninsula, Dorset (Southern England). Quaternary 2022, 5, 27. https://doi.org/10.3390/quat5020027
Howlett D, Wulf S, Wharram S, Hardiman M, Byrne H. Ecological and Wildfire Responses to Rapid Landscape Changes within the Last ~900 Years on the South Haven Peninsula, Dorset (Southern England). Quaternary. 2022; 5(2):27. https://doi.org/10.3390/quat5020027
Chicago/Turabian StyleHowlett, Daniel, Sabine Wulf, Scarlett Wharram, Mark Hardiman, and Harry Byrne. 2022. "Ecological and Wildfire Responses to Rapid Landscape Changes within the Last ~900 Years on the South Haven Peninsula, Dorset (Southern England)" Quaternary 5, no. 2: 27. https://doi.org/10.3390/quat5020027