
The 200 Year Pound to Dollar Exchange Rate History - From $5 in 1800s to Today's $1.29
Published: 6 Feb at 1 PM by Elaine Housten and tagged under category Exchange Rates History
If you're looking to make an international money transfer, we recommend TorFX as our preferred currency provider.
Sending money overseas over £5000? Free Transfers, No Fees, Competitive Exchange Rates Request a quote today!
Sending money overseas over £5000? Free Transfers, No Fees, Competitive Exchange Rates Request a quote today!
Pound Sterling to US Dollar Exchange Rates Over 200 Years
Post-EU referendum price action for the Pound Sterling (GBP) has seen GBP-crosses swing rapidly, often by upwards of 1% per day as markets react to a constant stream of Brexit related developments. It’s easy to get up in the day-to-day developments which make it ever more important to take a step back and remember that recent moves represent the very tail end of an over 200 year relationship.
While it’s unlikely the time frame of your FX charts or analysis spans the last 200 years, we’re taking a look at the tumultuous historical relationship between the Pound Sterling and US Dollar (GBP/USD) which has seen the GBP depreciate from $5 to the current level of $1.29, a massive 74.2% decline.
1791 – Early 1900s: War Driven Rates
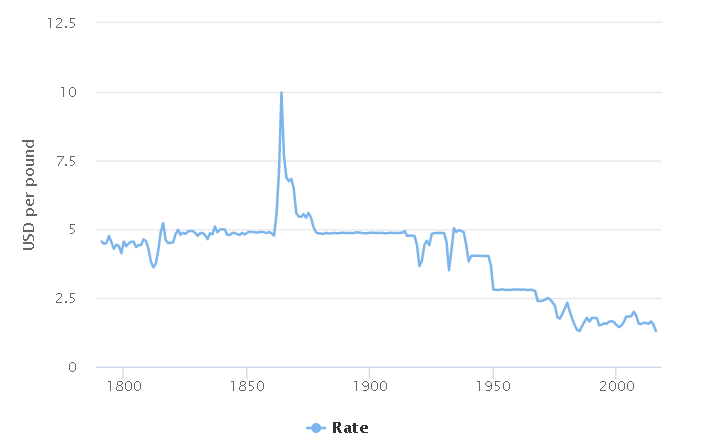
The 1800s saw the Pound Sterling to US Dollar (GBPUSD) exchange rate by and large maintain a rate of around $5 to every £1 with the notable deviations from the rate seen to be aligned with periods of war.
The early 1800s for example saw the Pound Sterling depreciate against the Greenback to $3.62 during the Pound-weakening Napoleonic wars (1803 -1815). For the US Dollar, the US Civil war (1861 – 1875) saw the Dollar depreciate vastly, sending the spiking to $10 to the £1.
Entering the 20th century just shy of $5, the next big development for the cross saw the Sterling come under pressure during World War One (1914 – 1918). The abandonment of the gold standard and the financial burden of the Great War saw the GBP/USD decline to $3.66.
Former hedge fund manager and head of research at QuotedData, James Carthew, wrote, “The expense of the First World War took its toll on sterling as the currency was allowed to float, but Britain returned to the gold standard in 1925. The advent of the Great Depression in 1931 meant that the gold standard had to be abandoned."
1930s – 1971: WWII, the End of the Gold Standard the Bretton Woods Arrangement
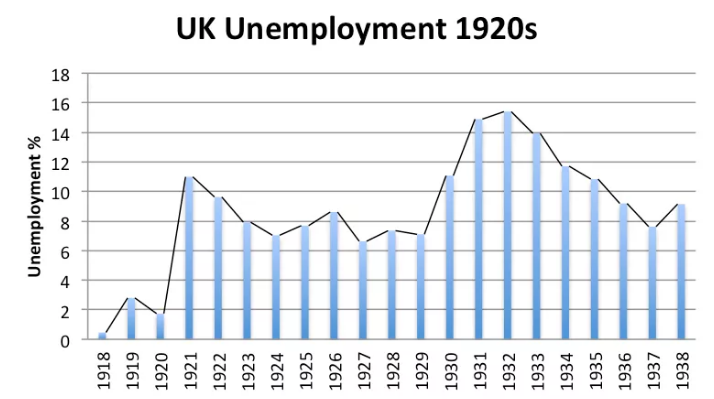
The collapse of the coal industry in 1925, exacerbated by a 6-month miner strike in 1926 prompted vast, protracted, unemployment and and coupled with persistent deflation prompted economic slide culminating in a savage run on the Pound in 1931 at which point the the Gold Standard was abandoned for a second, and final time. Globally, the standard collapsed between 1930 and 1933.
The Pound rebounded towards the $5 level and even briefly breached, topping out at $5.04 in 1934. Thus far, the Pound Sterling has never retaken the level again.
The outbreak of World War 2 saw the Pound peel away from the $5 level, dipping to a fresh historical low of $3.25. The depreciation was largely driven by uncertainty over the outcome of the war as fundamental economic drivers were expected to deteriorate, based on historical precedent, pushing the British economy further into debt.
Germany also embarked on the large-scale dissemination of counterfeit Sterling notes in an effort to destabilise the currency further. On a historical side-note this prompted the Mint to introduce metal threads to banknotes in an effort to differentiate between forgeries and the real thing.
A 1940 agreement between the US and the UK pegged the Pound-to-Dollar rate at $4.03 given the governments’ desire to maintain a relatively fixed rate. In the wake of the Bretton Woods conference in 1944, 44 countries around the world signed a deal to govern financial regulations while also establishing the World Bank and International Monetary Fund.
Any hopes of a post-war recovery for the Sterling against the Dollar were dashed by Britain’s emergence from the war with an unprecedented level of debt, nearly 250% of the nation’s GDP with the US holding the majority.
Despite the soft-loan agreement between the UK and US in which the UK would repay a wartime $3.75B loan at 2% over fifty years, the Pound Sterling remained under intense pressure. Rumours abounded that the Sterling was heading for devaluation and on the business front the UK’s inability to rapidly switch from a wartime production footing to service the growing demand from consumer goods from British colonies saw foreign purchasers turn to the US and US Dollar.
In September of 1949, speculation became fact when at the time Chancellor of the Exchequer, Sir Stafford Cripps, announced a 30% devaluation for the Pound, reducing the Pound-to-Dollar rate from $4.03 to $2.80.
The following two decades were characterised by persistent balance of payment problems for the UK, leading to the Sterling crisis of 1964/65 when the UK was compelled to seek financial assistance from the Bank of International Settlement and International Monetary Fund (IMF).
Sterling’s role as a reserve currency rendered UK exports noncompetitive with a drop in export levels in turn leading to a manufacturing slowdown while the US economy boomed. A persistent ebb of reserve from Pounds to Dollars continued to pressure the Sterling.
By 1966/67, the Bank of England was covering persistent Sterling weakness by lines of credit extended from other central banks (i.e., swaps with the New York Federal Reserve) and the IMF. It wasn’t enough however and in 1967, Prime Minister Harold Wilson announced a 14.3% devaluation, reducing the Pound-to-Dollar rate from $2.80 to $2.40.
The Bretton Woods system was abandoned in 1971, largely due to its inflexibility, thus ending the era of fixed exchange rates with currency crosses adopting the free-floating nature that persists today.
Carthew said, “In the early years… the UK was sucking in wealth from all its colonies, and this buoyed sterling. In some ways the weakening pound marked the shift as the US took up the mantle of the world's largest economy from Britain.”
He added, “For long periods, while the Government sought to control the exchange rate, sterling was overvalued and this would have hurt UK exporters and would have played a part in the collapse of the UK manufacturing industry."
1971 – 1980: Free Floating Currency Exchange Rates
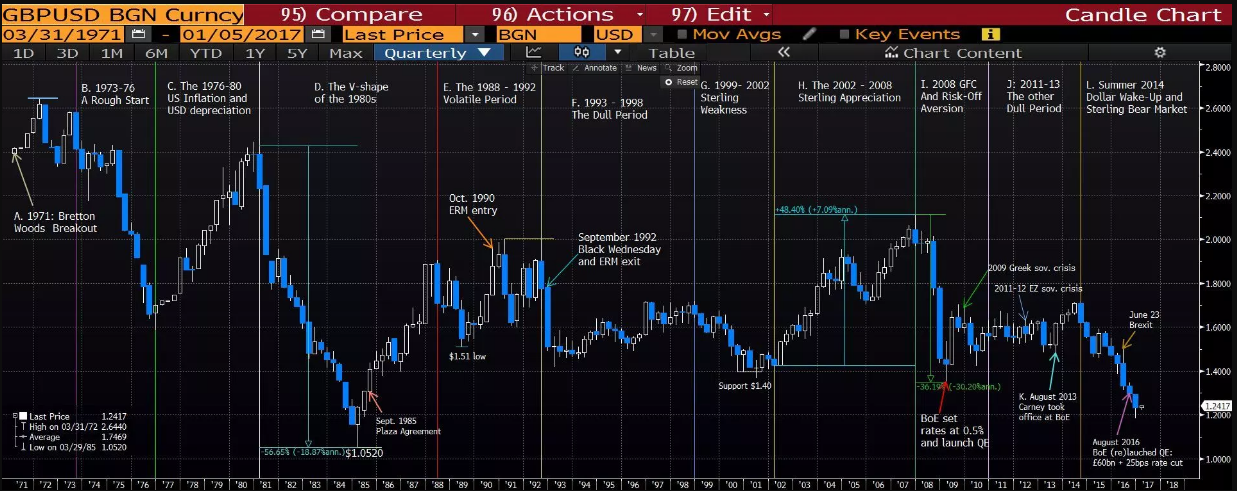
In the US, post-Vietnam war pressure on the US Dollar saw President Nixon devalue the US Dollar, pegging the Greenback at $38 an ounce as opposed to the $35 per ounce throughout the Bretton Woods period. The Pound gained, hitting $2.65 by the end of Q2 1972.
However, the troubles returned to the Pound shortly thereafter in the face of war in the Middle East, higher oil prices and a global recession combined with domestic economic pressures. In response, the Cable dipped to a (at the time) historic low of $1.5875 and the UK was forced once again seek financial aid from the IMF.
The loan, plus a variety of austerity measures imposed by the government prompted reduced inflation and rising levels of economic activity, supporting the Pound Sterling higher against the . The positive UK-US carry trade (due to low interest rates imposed by the Federal Reserve in mid-70s) also supported a stronger Pound. From 1976 to 1980, the Cable rose by 54%, hitting a Q4 1980 high of $2.45.
1980 – 2002: Widening Interest Rate Differentials, ERM Overvaluation and US Double-Deficits
Price actions over the 1980s was characterised by a distinct V-shaped profile. Doubling oil prices in response to the Shah revolution in oil-producing Iran in 1979 saw inflation in the US surge to a peak of 15% in Q1 2018. The Federal reserve reacted, hiking the Fed Funds target rate to nearly 20%, which while causing a sharp recession and mass unemployment resulted in growing international capital inflows and a surge in the USD’s foreign exchange value.
The first half of the 80’s saw the Cable decline by over 50% to a Q1 1985 historic low of $1.0520 which still stands to this day.
5 Years of bullish US Dollar momentum were reversed in the late 80s following a concerted effort between the US, France, Japan, West Germany and the UK to devalue the USD in an effort to combat the US’ current account and trade balance deficits. The resultant effect saw the Pound Sterling appreciate by around 80%.
The unofficial pegging of the Pound Sterling to the German Mark caused soaring inflation; a credit bubble and a boom in the UK property market which eventually crashed in 1989, plunging the UK into recession and sending the Pound down against the Greenback once more.
Meanwhile in the US, the Federal Reserve, under the chairmanship of Alan Greenspan, pursued a period of monetary loosening, decreasing the Fed Funds rate from 9.75% in 1989 to 3% in 1992. Supported by a widening interest rate differential, the Pound rebounded against the Dollar to double peak at $2 (Q1 1991 and Q3 1992). The Pound also benefitted from joining the Exchange Rate Mechanism (ERM, October 1990).
The Pound’s inclusion in the ERM was short-lived however, with the UK forced to withdraw from the system, prompting a historic one-day downward slide of 15% for the Cable.
"On one desperate day - Wednesday 16th September, the UK government increased interest rates to 15%. In theory, these high interest rates should attract hot money flows. But, the market saw it for what it was - a measure of desperation. The market knew these interest rates were unsustainable and couldn't be maintained; the sell off continued and eventually, the government caved into the inevitable and left the ERM. The Pound fell 15%, interest rates were cut, and the economy was able to recover." Source and further reading on the ERM
1993 to 1998 was a relatively dull period for the Cable, with the cross oscillating around the $1.60 level. 1996 to 98 particularly saw price action constrained to a tight range with $1.70 roof.
1999 to 2002 saw the Pound depreciate against the Greenback, toying with support at $1.40 and hitting a Q2 2001 low of $1.37. Dollar appreciation in the period was partially attributed to a surge in the equity market capitalisation in the US – in response to the tech boom.
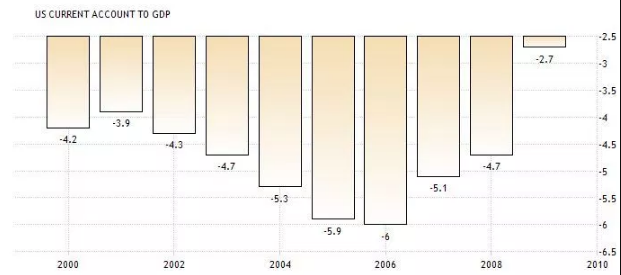
2002 saw the beginning for a six year bullish run for the Cable in favour of the Pound with the x-rate rising by over 50% to hit a 2007 decade high of $2.11.
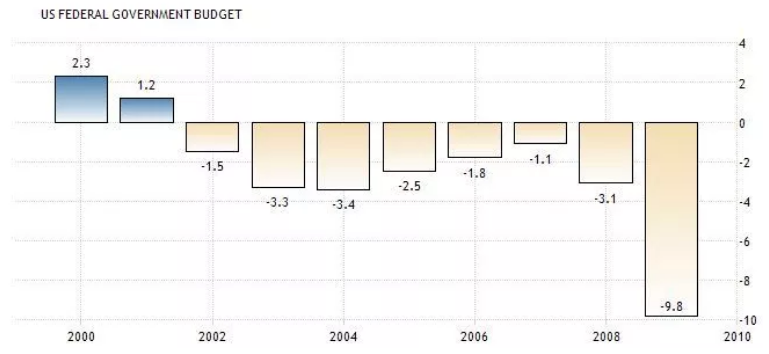
During the period, the US was struggling to combat twin deficits, with the current account deficit hitting 6% or GDP and the budget deficit ranging between 2.5 and 3%.
2008 – 2009: Global Financial Crisis and Risk Aversion
A sudden demand for the US Dollar due to soaring risk-off sentiment saw the Pound Sterling depreciate by over 36% against the US Dollar, dropping from a Q4 2007 peak of $2.11 to a Q1 2009 low of $1.35.
The Bank of England (BoE) responded by slashing interest rates from 5% at the start of 2008 to a record low of 0.5% in Q1 2009, the lowest rate since the BoE was established in 1694. In a bid to pursue quantitative easing, the Bank central bank also created £375B in new money between 2009 and 2012.
2013 – EU Referendum: Sterling Spikes and Retreats as US Dollar Embarks on Bull Run
Following a period of relatively dull price action between 2011 and 2013 in which the Cable traded around $1.50 - $1.60, 2013 saw a distinct turnaround for the UK economy and Pound Sterling.
Investors welcomed the placement of Mark Carney as the new Bank of England governor and positive fundamentals saw the GBP/USD soar from $1.48 to a six-year high of $1.72. in 2014, Britain was the fastest growing major economy in the world, printing 2.9% annual growth.
Governor Carney said the UK was experiencing a period of positive momentum and futures markets were pricing in a quarter point rate hike by the end of Q4 2014, everything seemed rosy for the GBP.
Mere weeks later the Pound Sterling’s bull run on the Greenback appeared to be running out of steam and by early 2015 market participants were pricing in a 15 to 20% Dollar appreciation amid expectations of the Fed to pursue a tightening policy.
2016 – Present: The Brexit Effect
While the Fed pursued a policy of monetary tightening, commencing a rate hike cycle which extended up to late 2018 (and possibly further), the UK voted to leave the European Union, sending Pound Sterling crosses reeling across the board.
Against the Dollar, the Pound cross decline to sub $1.20, 21-year lows.
The subsequent two and half years saw the pound Sterling (GBP) rebound against the Greenback (USD), topping out at around $1.43 in early/mid 2018 before declining amid growing expectations that the UK is heading for a messy Brexit outcome.
Pound-to-Dollar Exchange Rate – Real Versus Nominal
While it’s a long way back to the dizzying heights of $5 or even $10 to the £1, the stark 74.2% decline in the Cable since 1791 to present may not be quite as drastic as it appears at first glance.
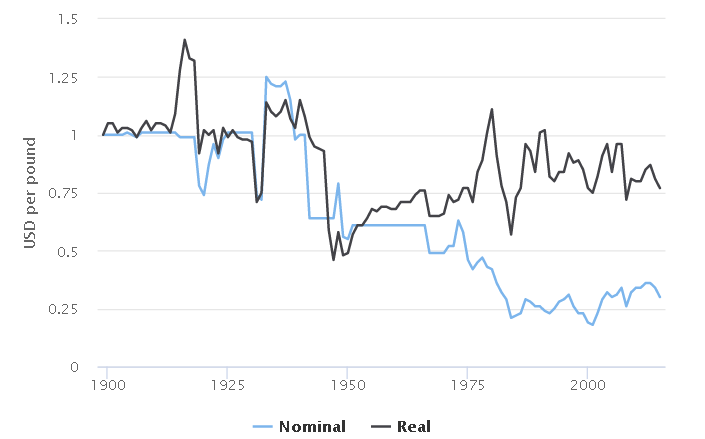
Emeritus professor of finance at the London Business School, Elroy Dimson, notes,
“Over the long term, the pound has been weak against the dollar, depreciating over the past 116 years by an annualised 1pc - that is largely attributable to Britain's higher inflation rate, which had the effect of debasing the purchasing power of the pound.
Dimson added, “If you look at the real (inflation adjusted) exchange rate of the pound against the dollar, it has weakened over the past 116 years by a minuscule 0.22pc per year."
Commenting on the chart above, professor of pension economics at Cass Business School, David Blake, seconded Dimson’s interpretation, “The chart shows precisely what you would expect - that the real exchange rate shows no real trend from when sterling started floating against the dollar following the collapse of the Bretton Woods agreements,” adding, “This is because the nominal exchange rate will adjust to reflect differences in inflation rates in order to maintain 'purchasing-power parity'."
