Below is a snapshot of the Web page as it appeared on 4/8/2023 (the last time our crawler visited it). This is the version of the page that was used for ranking your search results. The page may have changed since we last cached it. To see what might have changed (without the highlights), go to the current page.
Bing is not responsible for the content of this page.
Environment Gene Interactions | Just another WordPress.com weblog
The Effects of Antibiotics and Pesticides on Plants and and Covid mRNA Vaccine on Microbia 2023-04-01 Jorma Jyrkkanen, BSc, PDP
ANTIBIOTICS ON PLANTS
PESTICIDES ON PLANTS
mRNA on MICROBIOTA
I SUSPECT A LOT OF THESE EFFECTS ARE DUE TO DAMAGE TO THE MITOCHONDRIA THEREBY HARMING THE IMMUNE HEALTH, METABOLISM, AND REPRODUCTION OF THESE ORGANISMS AND AM INVESTIGATING THAT POSSIBILITY. MY RESEARCH PREDICTED THESE RESULTS FOR OTHER SPECIES WITH MITOCHONDRIA. SEE
Start with a video by Pediatric Nurse and Doctors and their anecdotal observations, impressions.
WHISTLEBLOWER NURSE EXPOSES RISE IN FETAL DEMISE Comments
Leave a Reply Leave a Reply You must Register or Login to post a comment. Obstetrician, Dr. James Thorp, and Postpartum Nurse, Michelle Gershman, speak out about unprecedented elevation of reproductive and pregnancy complications that have been reported that directly coincide with the Covid-19 vaccine rollout. #JamesThorpMD #FetalDeathWhistleblower
Canadian Surveillance of COVID-19 in Pregnancy: Epidemiology, Maternal and Infant Outcomes
PLEASE NOTE: Due to changes in COVID-19 testing and reporting across the country we will no longer be updating the map on our website. For the Canadian epidemiology of COVID-19 in pregnancy, we recommend referencing our regularly published reports and manuscripts linked below.
Globally, there is limited data on COVID-19 in pregnancy to inform recommendations for pregnant women and their care providers. This national surveillance project serves to better our understanding of the epidemiology and outcomes associated with COVID-19 in pregnancy and to thereby provide critical data to inform recommendations for pregnant women and their infants. A national approach, with regional leadership across Canada, is in progress with provincial/territorial data collection being combined for a national dataset of cases of COVID-19 in pregnancy. This project also lays the foundation for additional COVID-19 research through the establishment of a biospecimen repository from COVID-19 affected mother-infant pairs.
Coordinating centre lead: Dr. Deborah Money, Professor, Obstetrics & Gynaecology, Medicine, & SPPH Clinician Scientist, Women’s Health Research Institute
As a sub-protocol of the Canadian Surveillance of COVID-19 in Pregnancy: Epidemiology, Maternal and Infant Outcomes, the Rapid Response Maternal-Infant Clinical and Biospecimen Access Platform, or Biorepository Study was developed to better understand the burden of COVID-19 on pregnancy. To do this, we have established a Biorepository of data and samples for future studies related to COVID-19 in pregnant populations.
Recruitment for the Biorepository Study is now closed.
For further information on the bio repository sub-study please reference our study page: Biorepository Sub Study
For further supporting information please reference the sections below
Reports
Protocols
Data Collection Forms
Publications
Supporting Information
Reproductive Infectious Diseases Program | Department of Obstetrics & Gynaecology
Results: Repetitive measurements revealed -15.4% sperm concentration decrease on T2 (CI -25.5%-3.9%, p = 0.01) leading to total motile count 22.1% reduction (CI -35% – -6.6%, p = 0.007) compared to T0. Similarly, analysis of first semen sample only and samples’ mean per donor resulted in concentration and total motile count (TMC) reductions on T2 compared to T0 – median decline of 12 million/ml and 31.2 million motile spermatozoa, respectively (p = 0.02 and 0.002 respectively) on first sample evaluation and median decline of 9.5 × 10⁶ and 27.3 million motile spermatozoa (p = 0.004 and 0.003, respectively) on samples’ mean examination. T3 evaluation demonstrated overall recovery without. Semen volume and sperm motility were not impaired.
Research Letter
June 17, 2021
Sperm Parameters Before and After COVID-19 mRNA Vaccination
Between December 17, 2020, and January 12, 2021, 45 men volunteered (median age, 28 years [IQR, 25-31]); follow-up samples were obtained at a median of 75 days (IQR, 70-86) after the second dose. The study ended on April 24, 2021. Baseline samples were obtained after a median abstinence period of 2.8 days (IQR, 2-3) and follow-up samples after a median of 3 days (IQR, 3-4). Of the 45 men, 21 (46.7%) received BNT162b2 and 24 (53.3%) received mRNA-1273. Baseline median sperm concentration and TMSC were 26 million/mL (IQR, 19.5-34) and 36 million (IQR, 18-51), respectively. After the second vaccine dose, the median sperm concentration significantly increased to 30 million/mL (IQR, 21.5-40.5; P = .02) and the median TMSC to 44 million (IQR, 27.5-98; P = .001). Semen volume and sperm motility also significantly increased (Table).
3 Allotey et al. Clinical manifestations, risk factors, and maternal and perinatal outcomes of coronavirus disease 2019 in pregnancy: living systematic review and meta-analysis. (2019) BMJ Sep 1:370. https://pubmed.ncbi.nlm.nih.gov/32873575/
mRNA Vaccine a Spiker. Is it a Mitochondria Killer Ergo Cardiac Whacker, Cancer Causer, Immune Integrity Trasher, Brain Fogger. Yes if Spike Hits Mitochondria. 2023-01-22 Jorma Jyrkkanen
Thanks to Robin Monotti
RELATED NEWS TODAY Immunity. Author manuscript; available in PMC 2016 Mar 17. Published in final edited form as: Immunity. 2015 Mar 17; 42(3): 406–417.
Mitochondria in the regulation of innate and adaptive immunity Samuel E. Weinberg, Laura A. Sena, and Navdeep S. Chandel* Author information Copyright and License information Disclaimer The publisher’s final edited version of this article is available at Immunity Go to: Summary
Mitochondria are well appreciated for their role as biosynthetic and bioenergetic organelles. In the past two decades, mitochondria have emerged as signaling organelles that contribute critical decisions about cell proliferation, death and differentiation. Mitochondria not only sustain immune cell phenotypes but also are necessary for establishing immune cell phenotype and their function. Mitochondria can rapidly switch from primarily being catabolic organelles generating ATP to anabolic organelles that generate both ATP and building blocks for macromolecule synthesis. This enables them to fulfill appropriate metabolic demands of different immune cells. Mitochondria have multiple mechanisms that allow them to activate signaling pathways in the cytosol including altering in AMP/ATP ratio, the release of ROS and TCA cycle metabolites, as well as the localization of immune regulatory proteins on the outer mitochondrial membrane. In this Review, we discuss the evidence and mechanisms that mitochondrial dependent signaling controls innate and adaptive immune responses.
ORIGINAL ARTICLE
Published: 02 October 2021
Mitochondrial Dynamics in SARS-COV2 Spike Protein Treated Human Microglia: Implications for Neuro-COVID
Erin Clough, Joseph Inigo, Dhyan Chandra, Lee Chaves, Jessica L. Reynolds, Ravikumar Aalinkeel, Stanley A. Schwartz, Alexander Khmaladze & Supriya D. Mahajan
Journal of Neuroimmune Pharmacology volume 16, pages 770–784 (2021)
This article has been updated Abstract
Emerging clinical data from the current COVID-19 pandemic suggests that ~ 40% of COVID-19 patients develop neurological symptoms attributed to viral encephalitis while in COVID long haulers chronic neuro-inflammation and neuronal damage result in a syndrome described as Neuro-COVID. We hypothesize that SAR-COV2 induces mitochondrial dysfunction and activation of the mitochondrial-dependent intrinsic apoptotic pathway, resulting in microglial and neuronal apoptosis. The goal of our study was to determine the effect of SARS-COV2 on mitochondrial biogenesis and to monitor cell apoptosis in human microglia non-invasively in real time using Raman spectroscopy, providing a unique spatio-temporal information on mitochondrial function in live cells. We treated human microglia with SARS-COV2 spike protein and examined the levels of cytokines and reactive oxygen species (ROS) production, determined the effect of SARS-COV2 on mitochondrial biogenesis and examined the changes in molecular composition of phospholipids. Our results show that SARS- COV2 spike protein increases the levels of pro-inflammatory cytokines and ROS production, increases apoptosis and increases the oxygen consumption rate (OCR) in microglial cells. Increases in OCR are indicative of increased ROS production and oxidative stress suggesting that SARS-COV2 induced cell death. Raman spectroscopy yielded significant differences in phospholipids such as Phosphatidylinositol (PI), phosphatidylserine (PS), phosphatidylethanolamine (PE) and phosphatidylcholine (PC), which account for ~ 80% of mitochondrial membrane lipids between SARS-COV2 treated and untreated microglial cells. These data provide important mechanistic insights into SARS-COV2 induced mitochondrial dysfunction which underlies neuropathology associated with Neuro-COVID. THE FOLLOWING CHARTS WITH COVID MORTALITY ON THE VERTICAL AXIS AND TIME ON THE HORIZONTAL AXIS AND A DASHED VERTRICAL LINE FOR START OF MASS VACCINATION SUGGEST A VERY NEGATIVE IMPACT OF VACCINE EXHIBITING AN INCREASE IN VACCINE MORTALITY
THIS IS STRONG EVIDENCE FOR THE HYPOTHESIS THAT THE SPIKE PROTEIN OF THE VACCINE IS IN FACT WHACKING THE MITOCHONDRIA. THE OTHER INCONVENIENT TRUTH WAS DISCOVERED IN ISRAEL. UNVACCINATED PEOPLES IMMUNE SYSTEMS ARE BETTER THAN VACCINATED PEOPLES
CDC’s VAERS safety signal analysis based on reports from Dec. 14, 2020 – July 29, 2022 for mRNA COVID-19 vaccines shows clear safety signals for death and a range of highly concerning thrombo-embolic, cardiac, neurological, hemorrhagic, hematological, immune-system and menstrual adverse events (AEs) among U.S. adults.
There were 770 different types of adverse events that showed safety signals in ages 18+, of which over 500 (or 2/3) had a larger safety signal than myocarditis/pericarditis.
The CDC analysis shows that the number of serious adverse events reported in less than two years for mRNA COVID-19 vaccines is 5.5 times larger than all serious reports for vaccines given to adults in the US since 2009 (~73,000 vs. ~13,000).
Twice as many mRNA COVID-19 vaccine reports were classified as serious compared to all other vaccines given to adults (11% vs. 5.5%). This meets the CDC definition of a safety signal.
There are 96 safety signals for 12-17 year-olds, which include: myocarditis, pericarditis, Bell’s Palsy, genital ulcerations, high blood pressure and heartrate, menstrual irregularities, cardiac valve incompetencies, pulmonary embolism, cardiac arrhythmias, thromboses, pericardial and pleural effusion, appendicitis and perforated appendix, immune thrombocytopenia, chest pain, increased troponin levels, being in intensive care, and having anticoagulant therapy.
There are 66 safety signals for 5-11 year-olds, which include: myocarditis, pericarditis, ventricular dysfunction and cardiac valve incompetencies, pericardial and pleural effusion, chest pain, appendicitis & appendectomies, Kawasaki’s disease, menstrual irregularities, vitiligo, and vaccine breakthrough infection.
The safety signals cannot be dismissed as due to “stimulated,” exaggerated, fraudulent or otherwise artificially inflated reporting, nor can they be dismissed due to the huge number of COVID vaccines administered. There are several reasons why, but the simplest one is this: the safety signal analysis does not depend on the number of reports, but whether or not some AEs are reported at a higher rate for these vaccines than for other non-COVID vaccines. Other reasons are discussed in the full post below.
In August, 2022, the CDC told the Epoch Times that the results of their safety signal analysis “were generally consistent with EB [Empirical Bayesian] data mining [conducted by the FDA], revealing no additional unexpected safety signals.” So either the FDA’s data mining was consistent with the CDC’s method—meaning they “generally” found the same large number of highly alarming safety signals—or the signals they did find were expected. Or they were lying. We may never know because the FDA has refused to release their data mining results.
INTRODUCTION
Finally! Zachary Stieber at the Epoch Times managed to get the CDC to release the results of its VAERS safety signal monitoring for COVID-19 vaccines, and they paint a very alarming picture (see his reporting and the data files here, or if that is behind a paywall then here). The analyses cover VAERS reports for mRNA COVID vaccines from the period from the vaccine rollout on December 14, 2020 through to the end of July, 2022. The CDC admitted to only having started its safety signal analysis on March 25, 2022 (coincidentally 3 days after a lawyer at Children’s Health Defense wrote to them reminding them about our FOIA request for it).
[UPDATE: T Coddington left a link in comments to a website where he made the data in the Excel files more accessible.]
Like me, you might be wondering why the CDC waited over 15 months before doing its first safety signal analysis of VAERS, despite having said in a document posted to its website that it would begin in early 2021—especially since VAERS is touted as our early warning vaccine safety system. You might also wonder how they could insist all the while that the COVID-19 vaccines are being subjected to the most rigorous safety monitoring the world has ever known. I’ll come back to that later. First I’m going to give a little background information on the analysis they did (which you can skip if you’re up to speed) and then describe what they found.
BACKGROUND ON SAFETY SIGNAL ANALYSIS
Back in June 2022, the CDC replied to a Freedom of Information Act (FOIA) request for the safety signal monitoring of the Vaccine Adverse Events Reporting System (VAERS)—the one it had said it was going to do weekly beginning in early 2021. Their response was: we never did it. Then a little later they said they had been doing it from early on. But by August, 2022, they had finally gotten their story straight, saying that they actually did do it, but only from March 25, 2022 through end of July. You can get up to speed on that here.
The analysis they were supposed to do uses what’s called proportional reporting ratios (PRRs). This is a type of disproportionality analysis commonly used in pharmacovigilance (meaning the monitoring of adverse events after drugs/vaccines go to market). The basic idea of disproportionality analysis is to take a new drug and compare it to one or more existing drugs generally considered safe. We look for disproportionality in the number of adverse events (AEs) reported for a specific AE out of the total number of AEs reported (since we generally don’t know how many people take a given drug). We then compare to existing drugs considered safe to see if there is a higher proportion of particular adverse events reported for the new drug compared to existing ones. (In this case they are looking at vaccines, but they still use PRR even though they generally have a much better sense of how many vaccines were administered.)
There are many ways to do disproportionality analysis. The PRR is one of the oldest. Empirical Bayesian data mining, which was supposed to be done on VAERS by the FDA, is another. The PRR is calculated by taking the number of reports for a given adverse event divided by the total number of events reported for the new vaccine or the total number of reports. It then divides that by the same ratio for one or more existing drugs/vaccines considered safe. Here is a simple formula:
So for example, if half of all adverse events reported for COVID-19 vaccines and the comparator vaccine(s) are for myocarditis, then the PRR is 0.5/0.5 = 1. If one quarter of all AEs for the comparator vaccine are for myocarditis, then the PRR is 0.5/0.25 = 2.
Traditionally, for a PRR to count as a safety signal, the PRR has to be 2 or greater, have a Chi-square value of 4 or greater (meaning it is statistically significant) and there has to be at least 3 events reported for a given AE. (This also means that if there are tons of different AEs reported for COVID vaccines that have never been reported for any other vaccine, it will not count as a safety signal. I found over 6,000 of those in my safety signal analysis from 2021.
Ah yes, shared with the public — after first refusing to share the results and months of foot-dragging following repeated FOIA requests! We will see that the CDC has not done a more focused study on almost any of adverse events with “new patterns” (AKA safety signals).
SO WHAT DID THE CDC ACTUALLY DO?
The Epoch Times obtained 3 weeks of safety signal analyses from the CDC for VAERS data updated on July 15, 22 and 29, 2022. Here I will focus on the last one, since there is very little difference between them and it is more complete. The safety signal analysis compares adverse events1 reported to VAERS for mRNA COVID-19 vaccines from Dec. 14, 2020 through July 29, 2022 to reports for all non-COVID vaccines from Jan 1, 2009 through July 29, 2022.
PRRs are calculated separately for 5-11 year-olds, 12-15 year-olds and 18+ separately. For each age group, there are separate tables for AEs from all reports, AEs from reports marked serious and AEs from reports not marked as serious.2 Recall that a serious report is one that involves death, a life-threatening event, new or prolonged hospitalization, disability or permanent damage, or a congenital anomaly. I will focus on the reports for all AE’s.
They also have a table that calculates PRRs by comparing reports for the Pfizer COVID-19 vaccine to reports for the Moderna vaccine and vice versa, again for all reports, serious reports only and non-serious reports. There were no remarkable findings in those tables, so I will not discuss them. [Edit: I forgot what Norman Fenton noted in his analysis: the overall proportion of reports with serious adverse events is 9.6% for Modern compared to 12.6% for Pfizer.] This isn’t that surprising since both vaccines are very similar and so should present relatively similar adverse events when compared to each other, and any differences are likely not large enough to be picked up by a PRR analysis. [Though the difference in the overall rate of serious adverse events, which are not specific to a particular type of event only how serious it is, was significant.]
The CDC seems to have calculated PRRs for every different type of adverse event reported for all the COVID vaccines examined – though it’s possible they only analyzed a subset. What seems clear is that, among the AEs they examined, the only ones included in the tables satisfy at least one of two conditions: a PRR value of at least 2 and a Chi-square value of at least 4 (Chi is the Greek letter χ and is pronounced like ‘kai’). When both conditions were met, they highlighted the adverse event in yellow, which appears to indicate a safety signal. There were no COVID vaccine AEs listed with fewer than 3 reported events, though for non-COVID vaccines there were many AEs listed that had only 1 or 2 reported since 2009. The CDC tables still include these and highlight them in yellow when the PRR is greater than 2 and the Chi-square value is great than 4, indicating these events are counted as safety signals.
WHAT SAFETY SIGNALS DID THE CDC FIND?
I’m going to divide this up by age groups and the Pfizer v. Moderna comparison. Let’s start with the 18+ group.
There are 772 AEs that appear on the list. Of these, 770 are marked in yellow and have PRR and Chi-square values that qualify them as safety signals. Some of these are new COVID-19 related codes, and we would expect those to trigger a signal since they didn’t exist in prior years to be reported by other vaccines. So if we take those off, we are left with 758 different types of non-COVID adverse events that showed safety signals.
I grouped these 758 safety signals into different categories. The figure below shows the total number of AEs reported for each of the major categories of safety signals:
Let’s dig into some of these categories to look at what types of AEs generated the most number of reports:3
You can peruse the adverse events using the Excel tables provided by the CDC, which were posted by The Epoch Times and Children’s Health Defense at the links at the top of this post.
What about The Children?
If there is anything that looks remotely like a bright spot in all of this is that the list of safety signals for 12-17 and 5-11 year-olds is much shorter than for 18+. There are 96 AEs that qualify as a safety signal for the 12-17 group and 67 for the 5-11. When we take out the new COVID-era AEs, there are 92 safety signals for 12-17 year-olds and 65 for 5-11 year-olds. Here are the most alarming ones:
I don’t know why the list of AE’s is so much shorter for these age groups. It could be that the list of AE’s for other vaccines for these age groups is much shorter, so in a case where AEs have been reported for the mRNA COVID vaccines but not for other vaccines, it will not be counted as a safety signal by definition.
COMPARISONS TO MYOCARDITIS & PERICARDITIS
We are told that the existence of a safety signal doesn’t necessarily mean the AE is caused by the vaccine, and I accept that premise. But the current practice seems to be to ignore safety signals, dismiss them as noise without any evidence, and stall any investigation into them as long as possible. The precautionary principle, however, dictates we should presume that a safety signal indicates causality, until proven otherwise. Since, it has been acknowledged that the mRNA COVID vaccines can cause myocarditis and pericarditis (often referred to as myo-pericarditis), we can take those AEs as a kind of benchmark, and propose that, at minimum, any AE with a signal of equal or greater size should be considered potentially causal and investigated more thoroughly.4
After dropping the new COVID-era AEs, there are 503 AEs with PRRs larger than myocarditis (PRR=3.09) and 552 with PRRs larger than pericarditis (PRR=2.82).5This means that 66.4% of the AEs had a bigger safety signal than myocarditis and 77.3% were larger than pericarditis. You can see what those were by use this Excel file provided by the CDC and sorting the 18+ tab by the 12/14-07/29 PRR column (Column E). Then just look at which AEs have PRRs larger than the ones for pericarditis and myocarditis.
For 12-17 year-olds, there is 1 safety signal larger than myocarditis (it’s ‘troponin increased’) and 14 safety signals larger than pericarditis (excluding myocarditis), which include: mitral valve incompetence, bell’s palsy, heavy menstrual bleeding, genital ulceration, vaccine breakthrough infection, and a range of indicators of cardiac abnormalities.
For 5-11 year-olds, the comparison to myo/pericarditis is less germane, as they seem to suffer less from this side effect. But we can still make the comparison: there are 7 safety signals larger than pericarditis, including bell’s palsy, left ventricular dysfunction, mitral valve incompetence, and ‘drug ineffective’ (presumably meaning they still got COVID). There are 16 safety signals larger than myocarditis (excluding pericarditis), which in addition to those listed above also include: pericardial effusion, diastolic blood pressure increase, tricuspid valve incompetence, and vitiligo. Sinus tachycardia (high heart rate), appendicitis, and menstrual disorder come in just below myocarditis.
Now if we think of a safety signal as having both strength and clarity, then the PRR can be thought of as an indicator of how strong the signal is, while the Chi-square is a measure of how clear or unambiguous the signal is, because it gives us a sense of how likely the signal is due to chance alone: the larger the Chi-square value, the less likely the signal is due to chance. A Chi-square of 4 means there is only a 5% chance the observed signal is due to chance. A Chi-square of 8 means there is only a 0.5% chance of it being due to chance.6
For the 18+ group, there are 57 AEs with a Chi-square larger than myocarditis (Chi-square=303.8) and 68 with a Chi-square larger than pericarditis (Chi-square=229.5). Again, you can see what these are by going the Excel file linked above and sorting on Column D.
For the 12-17 group, there are 4 AEs with a larger Chi-square than myocarditis (Chi-square=681.5) and 6 larger than pericarditis (Chi-square=175.4).
For the 5-11 group, there are 22 AEs with a Chi-square larger than myocarditis (Chi-square=30.42) and 34 AEs with a Chi-square larger than pericarditis (Chi-square=18.86).
RESPONDING TO OBJECTIONS
Let’s dispense with some of the criticisms used to dismiss VAERS data, which will undoubtedly be raised if you try to bring the CDC’s analysis to people’s attention.
Objection: Anybody can report to VAERS. The reports are unreliable. Anti-vaxxers made lots of fraudulent reports. Nobody was aware of VAERS in the past, but now they are. So many people were afraid of the vaccine so they blamed all their health problems on it. Health workers were required by law to report certain adverse events, like deaths and anaphylaxis. Etc. Etc.All of these objections ultimately rely on the notion that VAERS reports for COVID-19 vaccines have been artificially inflated over previous years for one reason or another. The thing of it is, though, that the CDC has a method for distinguishing between artificial inflation and real signal. The idea is simple: if adverse events are artificially inflated, they should be artificially inflated to the same degree. Meaning, the PRRs for all of these safety signals should be about the same. But even a casual glance at the PRRs in the Excel file show they vary widely, from as low at 2 to as high as 105 for vaccine breakthrough infection or 74 for cerebral thrombosis. This method does not on the number of reports, but the rate of reporting for certain events out of all events reported. If anything, this method would tend to hide safety signals in a situation where a new vaccine generates a very large number of reports. The CDC has even done us the favor of calculating upper and lower confidence intervals, meaning that we can be at least 95% confident that two PRRs are truly different if their confidence intervals don’t overlap. So for example the lower confidence interval for pulmonary thrombosis is 19.7, which is higher than the upper confidence interval for 543 other signals. Artificially inflated reporting cannot explain why so many different adverse events have large PRRs that are statistically distinct from one another.
Objection: The safety signals are due to the huge number of COVID vaccines given out. Never before have we given out so many vaccine doses. By the end of July, the US had administered something like 600 million vaccine doses to people aged 18+. But the CDC analysis compares VAERS reports for these doses to all doses for all other vaccines for this age group since Jan. 1, 2009. But from 2015-2020 there were over 100 million flu doses administered annually to this age group alone. In previous work, I estimated 538 million doses of flu given to people 18+ from July 2015-June 2020. The number of flu and other non-COVID vaccines for this age group administered from Jan 1., 2009 through July 29, 2022 must be well over double this number, meaning VAERS reports for COVID vaccines are being compared to reports for at least double the number of doses for other vaccines. In addition to this, as already noted, the PRR methodology does not depend, strictly speaking, on the number of doses, but rather the rate of reporting of a specific AE out of all AEs for that vaccine.
Objection: the vaccines are mainly being given to older people who tend to have health problems, whereas other vaccines are given to younger people. This objection is dealt with, since the analyses are stratified by age groups. It might be still be somewhat valid for the 18+ group, except that in the safety signal analysis I did in the fall of 2021, I stratified by smaller age bands and still found safety signals. In any case, this objection is not enough to dismiss the safety signal analysis out of hand, but rather calls for better and more refined research.
Objection: The VAERS data is not verified and cannot be trusted. I’ll be the first person to agree that VAERS is not high quality data, but if it is completely untrustworthy, then how is it that the CDC uses these data to publish in the best medical journals such as JAMA and The Lancet? If the data were worthless, then these journals shouldn’t accept these papers. In that JAMA paper, they reported that 80% of the myocarditis reports met their definition of myocarditis and were included in the analysis. Many other reports simply needed more details for validation. Furthermore, the CDC has the ability and budget to follow-up on every report VAERS receives to get more details and even medical records to verify the report. So if myocarditis shows a clear signal in the CDC’s analysis, and 80% of those reports were apparently high quality enough to be included in a paper published in one of the world’s top medical journals, how is it possible that all the rest of the reports are junk? That all of the other safety signals are meaningless? Answer: it isn’t.And since we’re on the topic of safety signals that turned out to be real, it’s instructive to find appendicitis turn up as a safety signal in all 3 age groups, since a study published in NEJM based on medical records of over a million adult Israelis found an increased risk of appendicitis in the 42 days following Pfizer vaccination (but not following a positive SARS-CoV-2 PCR test). That study also found an increase in lymphadenopathy (swollen lymph nodes) after vaccination, but not after positive COVID test. Lymphadenopathy was another safety signal.
And that brings us to our last objection to be dispensed with: all of these AEs were due to COVID. There was an epidemic and so people were falling ill due to COVID and having all of these problems that were then blamed on the vaccine. Well to begin with, as we just saw, at least two of them (appendicitis and lymphadenopathy) do not appear to have increased risk ratios following a positive SARS-CoV-2 test, and we know that the mRNA vaccines increase risk of myo/pericarditis independent of infections. So how can we assume the rest of these are and dismiss them with the wave of a hand? We can’t. At minimum, they need further investigation. Furthermore, in the safety signal analysis I did in 2021, I dropped all VAERS reports where any sign of a SARS-CoV-2 exposure or infection was indicated on the report, and I still found large, significant safety signals.
PUTTING IT ALL INTO PERSPECTIVE
The Epoch Times article quotes my esteemed colleague and friend, Norman Fenton, Professor of Risk Management and an world renowned expert in Bayesian statistical analysis: “from a Bayesian perspective, the probability that the true rate of the AE of the COVID-19 vaccines is not higher than that of the non-COVID-19 vaccines is essentially zero…. The onus is on the regulators to come up with some other causal explanation for this difference if they wish to claim that the probability a COVID vaccine AE results in death is not significantly higher than that of other vaccines.” (See his post on the CDC analysis here.) The same is true for all the safety signals they found.
The CDC’s VAERS SOP analysis document lists 18 Adverse Events of Special Interest says they are going to pay close attention to. In their 2021 JAMA paper (and similar presentations to ACIP), the researchers responsible for analyzing the millions of medical records in the CDC’s Vaccine Safety Datalink (VSD) using the ‘Rapid Cycle Analysis’ only studied 23 outcomes. A Similar analysis in NEJM from Israeli researchers focused on only 25 outcomes. Compare this to over 700 safety signals found by the CDC when they finally decided to look—and that’s not even counting all the adverse events that have never been reported for other vaccines so cannot ever show a safety signal by definition. How can the CDC say that these safety signals are meaningless if almost none of them have been studied any further? And yet we are assured that these vaccines have undergone the most intensive safety monitoring effort in history. It’s complete and utter hogwash!
* * *
Josh Guetzkow is a senior lecturer at The Hebrew University of Jerusalem. Subscribe to his Substack here.
1) To be precise, the ‘adverse events’ are for ‘preferred terms’ (PTs) which is a type/level of classification used in the Medical Dictionary for Regulatory Activities (MedDRA), which is the classification system used by VAERS and in other pharmacovigilance systems and clinical research for coding reported adverse events. Not all preferred terms are a symptom or adverse event per se. Some refer to a specific diagnostic test that was done or a treatment that was given.
2) It’s not entirely clear how they divided these up, since there are clearly AEs that should be considered serious that don’t show up in the serious Excel table — though maybe they don’t come up simply because they are looking within serious reports. I believe that they just filtered the reports to include only serious reports or non-serious reports, then did the safety signal analysis on all the AE’s coded in those reports. The reason I think this is that I used the MedAlerts Wayback Machine, selected just the serious COVID-19 vaccine reports, and the numbers of total reports was very close to the one in the table provided by the CDC (MedAlerts actually had a bit less). The files obtained by the Epoch Times do not include much in the way of a description as to how the analyses were done, so I had to infer some details, which might be incorrect. I will try to note when I am drawing an inference about how the analysis was done.
3) Generally speaking, these figures show the top ten AEs in each category. In some cases I combined AEs that indicated the same thing, such as combining ‘heart rate irregular’ with ‘arrythmia.’ [UPDATE: Note that the charts of all categories, cardiac and thrombo-embolic events were updated on Jan 7, 2023. The reason is that I had previously categorized acute myocardial infarction as a cardiac issue and myocardial infarction as thrombo-embolic. To be consistent, I have now combined myocardial infarction and acute myocardial infarction into one AE category in the thrombo-embolic events (which made the total AEs reported for that category larger than for pulmonary ones) and then added a different cardiac AE to the cardiovascular AE category, ventricular extrasystoles, AKA premature ventricular contraction (PVC), which dependent on frequency and the presence of other cardiomyopathies is associated with sudden cardiac arrest.]
4) Note that using the myo-pericarditis signal as a yardstick doesn’t mean that these are the only signals that matter. To give one example, anaphylactic reactions don’t even show up in the list of safety signals, even though that was one of the very first risk of the vaccine that became apparent from day one of the vaccine rollout.
One potential objection to this benchmark is that it is too low of a bar, since myo-pericarditis appears to disproportionately affect younger men and so a proper safety signal should be stratified by age and gender then compared with myocarditis similarly stratified. I agree, and it is the CDC’s job to do that. But the fact is that any adverse reaction might disproportionately affect some subgroup of people, in which case the safety signal for that group would be similarly faint or diluted when we look at everyone together. So objection overruled.
5) In their Standard Operation Procedures document, the CDC said they would combine these and related codes together to assess a safety signal, but never mind – at least they finally got around to doing something.
6) In this context, the Chi-square is largely driven by the sheer number of adverse events: the more adverse events reported, including for the comparator vaccine, the larger the Chi-square. For example, the PRR for pericarditis and subdural haematoma is the same (2.82), but there were 1,701 incidents of pericarditis reported for mRNA COVID vaccines versus 221for the comparator vaccines, with Chi-square of 229.5. For subdural haematoma, these numbers are 162 verus 21, for a Chi-square of 21.2.
Booster Jab boosts IgG4 Which Makes Cancer More Aggressive
REF: Bianchini R, Karagiannis SN, Jordakieva G, Jensen-Jarolim E. The Role of IgG4 in the Fine Tuning of Tolerance in IgE-Mediated Allergy and Cancer. Int J Mol Sci. 2020 Jul 16;21(14):5017. doi: 10.3390/ijms21145017. PMID: 32708690; PMCID: PMC7404042. Mechanism of Malfeasance.
See Also REF: IgG4 induces tolerogenic M2-like macrophages and correlates with disease progression in colon cancer. Jordakieva G, Bianchini R, Reichhold D, Piehslinger J, Groschopf A, Jensen SA, Mearini E, Nocentini G, Crevenna R, Zlabinger GJ, Karagiannis SN, Klaus A, Jensen-Jarolim E. Oncoimmunology. 2021 Feb 8;10(1):1880687. doi: 10.1080/2162402X.2021.1880687. PMID: 33628623
RELATED HISTORY Announcing the settlement Wednesday, the Justice Department said that it included the largest criminal fine in U.S. history — $1.2 billion. The agreement also included a criminal forfeiture of $105 million. Drugmaker Pfizer Inc. has paid a record fine of $2.3 billion US in a court settlement.Sep 2, 2009
MY PREVIOUS ANALYSIS SUGGESTS AND PREDICTS MITOCHONDRIAL SUPPORT OF THE IMMUNE SYSTEM IS COMPROMISED BY THE INCLUSION OF SPIKE PROTEIN INTO PEOPLES BODIES WHERE IT WREAKS HAVOC ALONG WITH ANTIBIOTICS AND PESTICIDES ON THE IMMUNE SYSTEM ALSO INCREASING THE RISK OF HEART PROBLEMS AND CANCER. IT ALSO PUTS AT RISK THE HEART AND BRAIN SIMPLY BY DAMAGE TO MITOCHONDRIAL ATP AND NAD PRODUCTION. SEE: https://jorma-jyrkkanen.blogspot.com/2022/03/spike-protein-binding-to-ace2-receptor.html
CDC Finally Releases VAERS Safety Monitoring Analyses For COVID Vaccines Tyler Durden’s Photo by Tyler Durden Monday, Jan 09, 2023 – 04:25 AM
Authored by Professor Josh Guetzkow via Jackanapes Junction (some emphasis ours), SUMMARY
CDC’s VAERS safety signal analysis based on reports from Dec. 14, 2020 – July 29, 2022 for mRNA COVID-19 vaccines shows clear safety signals for death and a range of highly concerning thrombo-embolic, cardiac, neurological, hemorrhagic, hematological, immune-system and menstrual adverse events (AEs) among U.S. adults.

There were 770 different types of adverse events that showed safety signals in ages 18+, of which over 500 (or 2/3) had a larger safety signal than myocarditis/pericarditis.

The CDC analysis shows that the number of serious adverse events reported in less than two years for mRNA COVID-19 vaccines is 5.5 times larger than all serious reports for vaccines given to adults in the US since 2009 (~73,000 vs. ~13,000).

Twice as many mRNA COVID-19 vaccine reports were classified as serious compared to all other vaccines given to adults (11% vs. 5.5%). This meets the CDC definition of a safety signal.

There are 96 safety signals for 12-17 year-olds, which include: myocarditis, pericarditis, Bell’s Palsy, genital ulcerations, high blood pressure and heartrate, menstrual irregularities, cardiac valve incompetencies, pulmonary embolism, cardiac arrhythmias, thromboses, pericardial and pleural effusion, appendicitis and perforated appendix, immune thrombocytopenia, chest pain, increased troponin levels, being in intensive care, and having anticoagulant therapy.

There are 66 safety signals for 5-11 year-olds, which include: myocarditis, pericarditis, ventricular dysfunction and cardiac valve incompetencies, pericardial and pleural effusion, chest pain, appendicitis & appendectomies, Kawasaki’s disease, menstrual irregularities, vitiligo, and vaccine breakthrough infection.

The safety signals cannot be dismissed as due to “stimulated,” exaggerated, fraudulent or otherwise artificially inflated reporting, nor can they be dismissed due to the huge number of COVID vaccines administered. There are several reasons why, but the simplest one is this: the safety signal analysis does not depend on the number of reports, but whether or not some AEs are reported at a higher rate for these vaccines than for other non-COVID vaccines. Other reasons are discussed in the full post below.

In August, 2022, the CDC told the Epoch Times that the results of their safety signal analysis “were generally consistent with EB [Empirical Bayesian] data mining [conducted by the FDA], revealing no additional unexpected safety signals.” So either the FDA’s data mining was consistent with the CDC’s method—meaning they "generally" found the same large number of highly alarming safety signals—or the signals they did find were expected. Or they were lying. We may never know because the FDA has refused to release their data mining results.
INTRODUCTION
Finally! Zachary Stieber at the Epoch Times managed to get the CDC to release the results of its VAERS safety signal monitoring for COVID-19 vaccines, and they paint a very alarming picture (see his reporting and the data files here, or if that is behind a paywall then here). The analyses cover VAERS reports for mRNA COVID vaccines from the period from the vaccine rollout on December 14, 2020 through to the end of July, 2022. The CDC admitted to only having started its safety signal analysis on March 25, 2022 (coincidentally 3 days after a lawyer at Children’s Health Defense wrote to them reminding them about our FOIA request for it).
[UPDATE: T Coddington left a link in comments to a website where he made the data in the Excel files more accessible.]
Like me, you might be wondering why the CDC waited over 15 months before doing its first safety signal analysis of VAERS, despite having said in a document posted to its website that it would begin in early 2021—especially since VAERS is touted as our early warning vaccine safety system. You might also wonder how they could insist all the while that the COVID-19 vaccines are being subjected to the most rigorous safety monitoring the world has ever known. I’ll come back to that later. First I’m going to give a little background information on the analysis they did (which you can skip if you’re up to speed) and then describe what they found. BACKGROUND ON SAFETY SIGNAL ANALYSIS
Back in June 2022, the CDC replied to a Freedom of Information Act (FOIA) request for the safety signal monitoring of the Vaccine Adverse Events Reporting System (VAERS)—the one it had said it was going to do weekly beginning in early 2021. Their response was: we never did it. Then a little later they said they had been doing it from early on. But by August, 2022, they had finally gotten their story straight, saying that they actually did do it, but only from March 25, 2022 through end of July. You can get up to speed on that here.
The analysis they were supposed to do uses what’s called proportional reporting ratios (PRRs). This is a type of disproportionality analysis commonly used in pharmacovigilance (meaning the monitoring of adverse events after drugs/vaccines go to market). The basic idea of disproportionality analysis is to take a new drug and compare it to one or more existing drugs generally considered safe. We look for disproportionality in the number of adverse events (AEs) reported for a specific AE out of the total number of AEs reported (since we generally don’t know how many people take a given drug). We then compare to existing drugs considered safe to see if there is a higher proportion of particular adverse events reported for the new drug compared to existing ones. (In this case they are looking at vaccines, but they still use PRR even though they generally have a much better sense of how many vaccines were administered.)
There are many ways to do disproportionality analysis. The PRR is one of the oldest. Empirical Bayesian data mining, which was supposed to be done on VAERS by the FDA, is another. The PRR is calculated by taking the number of reports for a given adverse event divided by the total number of events reported for the new vaccine or the total number of reports. It then divides that by the same ratio for one or more existing drugs/vaccines considered safe. Here is a simple formula:
So for example, if half of all adverse events reported for COVID-19 vaccines and the comparator vaccine(s) are for myocarditis, then the PRR is 0.5/0.5 = 1. If one quarter of all AEs for the comparator vaccine are for myocarditis, then the PRR is 0.5/0.25 = 2.
Traditionally, for a PRR to count as a safety signal, the PRR has to be 2 or greater, have a Chi-square value of 4 or greater (meaning it is statistically significant) and there has to be at least 3 events reported for a given AE. (This also means that if there are tons of different AEs reported for COVID vaccines that have never been reported for any other vaccine, it will not count as a safety signal. I found over 6,000 of those in my safety signal analysis from 2021.
Of course a safety signal does not necessarily mean there is a problem or that the vaccine caused the adverse event. But it is supposed to set off alarm bells to prompt closer inspection, as in this CDC pamphlet:
Ah yes, shared with the public — after first refusing to share the results and months of foot-dragging following repeated FOIA requests! We will see that the CDC has not done a more focused study on almost any of adverse events with “new patterns” (AKA safety signals). SO WHAT DID THE CDC ACTUALLY DO?
The Epoch Times obtained 3 weeks of safety signal analyses from the CDC for VAERS data updated on July 15, 22 and 29, 2022. Here I will focus on the last one, since there is very little difference between them and it is more complete. The safety signal analysis compares adverse events1 reported to VAERS for mRNA COVID-19 vaccines from Dec. 14, 2020 through July 29, 2022 to reports for all non-COVID vaccines from Jan 1, 2009 through July 29, 2022.
PRRs are calculated separately for 5-11 year-olds, 12-15 year-olds and 18+ separately. For each age group, there are separate tables for AEs from all reports, AEs from reports marked serious and AEs from reports not marked as serious.2 Recall that a serious report is one that involves death, a life-threatening event, new or prolonged hospitalization, disability or permanent damage, or a congenital anomaly. I will focus on the reports for all AE’s.
They also have a table that calculates PRRs by comparing reports for the Pfizer COVID-19 vaccine to reports for the Moderna vaccine and vice versa, again for all reports, serious reports only and non-serious reports. There were no remarkable findings in those tables, so I will not discuss them. [Edit: I forgot what Norman Fenton noted in his analysis: the overall proportion of reports with serious adverse events is 9.6% for Modern compared to 12.6% for Pfizer.] This isn’t that surprising since both vaccines are very similar and so should present relatively similar adverse events when compared to each other, and any differences are likely not large enough to be picked up by a PRR analysis. [Though the difference in the overall rate of serious adverse events, which are not specific to a particular type of event only how serious it is, was significant.]
The CDC seems to have calculated PRRs for every different type of adverse event reported for all the COVID vaccines examined – though it’s possible they only analyzed a subset. What seems clear is that, among the AEs they examined, the only ones included in the tables satisfy at least one of two conditions: a PRR value of at least 2 and a Chi-square value of at least 4 (Chi is the Greek letter χ and is pronounced like ‘kai’). When both conditions were met, they highlighted the adverse event in yellow, which appears to indicate a safety signal. There were no COVID vaccine AEs listed with fewer than 3 reported events, though for non-COVID vaccines there were many AEs listed that had only 1 or 2 reported since 2009. The CDC tables still include these and highlight them in yellow when the PRR is greater than 2 and the Chi-square value is great than 4, indicating these events are counted as safety signals. WHAT SAFETY SIGNALS DID THE CDC FIND?
I’m going to divide this up by age groups and the Pfizer v. Moderna comparison. Let’s start with the 18+ group.
There are 772 AEs that appear on the list. Of these, 770 are marked in yellow and have PRR and Chi-square values that qualify them as safety signals. Some of these are new COVID-19 related codes, and we would expect those to trigger a signal since they didn’t exist in prior years to be reported by other vaccines. So if we take those off, we are left with 758 different types of non-COVID adverse events that showed safety signals.
I grouped these 758 safety signals into different categories. The figure below shows the total number of AEs reported for each of the major categories of safety signals: Let’s dig into some of these categories to look at what types of AEs generated the most number of reports:3
Let’s dig into some of these categories to look at what types of AEs generated the most number of reports:3
You can peruse the adverse events using the Excel tables provided by the CDC, which were posted by The Epoch Times and Children’s Health Defense at the links at the top of this post. What about The Children?
If there is anything that looks remotely like a bright spot in all of this is that the list of safety signals for 12-17 and 5-11 year-olds is much shorter than for 18+. There are 96 AEs that qualify as a safety signal for the 12-17 group and 67 for the 5-11. When we take out the new COVID-era AEs, there are 92 safety signals for 12-17 year-olds and 65 for 5-11 year-olds. Here are the most alarming ones:
I don’t know why the list of AE’s is so much shorter for these age groups. It could be that the list of AE’s for other vaccines for these age groups is much shorter, so in a case where AEs have been reported for the mRNA COVID vaccines but not for other vaccines, it will not be counted as a safety signal by definition. COMPARISONS TO MYOCARDITIS and PERICARDITIS
We are told that the existence of a safety signal doesn’t necessarily mean the AE is caused by the vaccine, and I accept that premise. But the current practice seems to be to ignore safety signals, dismiss them as noise without any evidence, and stall any investigation into them as long as possible. The precautionary principle, however, dictates we should presume that a safety signal indicates causality, until proven otherwise. Since, it has been acknowledged that the mRNA COVID vaccines can cause myocarditis and pericarditis (often referred to as myo-pericarditis), we can take those AEs as a kind of benchmark, and propose that, at minimum, any AE with a signal of equal or greater size should be considered potentially causal and investigated more thoroughly.4
After dropping the new COVID-era AEs, there are 503 AEs with PRRs larger than myocarditis (PRR=3.09) and 552 with PRRs larger than pericarditis (PRR=2.82).5 This means that 66.4% of the AEs had a bigger safety signal than myocarditis and 77.3% were larger than pericarditis. You can see what those were by use this Excel file provided by the CDC and sorting the 18+ tab by the 12/14-07/29 PRR column (Column E). Then just look at which AEs have PRRs larger than the ones for pericarditis and myocarditis.
For 12-17 year-olds, there is 1 safety signal larger than myocarditis (it’s ‘troponin increased’) and 14 safety signals larger than pericarditis (excluding myocarditis), which include: mitral valve incompetence, bell’s palsy, heavy menstrual bleeding, genital ulceration, vaccine breakthrough infection, and a range of indicators of cardiac abnormalities.
For 5-11 year-olds, the comparison to myo/pericarditis is less germane, as they seem to suffer less from this side effect. But we can still make the comparison: there are 7 safety signals larger than pericarditis, including bell’s palsy, left ventricular dysfunction, mitral valve incompetence, and ‘drug ineffective’ (presumably meaning they still got COVID). There are 16 safety signals larger than myocarditis (excluding pericarditis), which in addition to those listed above also include: pericardial effusion, diastolic blood pressure increase, tricuspid valve incompetence, and vitiligo. Sinus tachycardia (high heart rate), appendicitis, and menstrual disorder come in just below myocarditis.
Now if we think of a safety signal as having both strength and clarity, then the PRR can be thought of as an indicator of how strong the signal is, while the Chi-square is a measure of how clear or unambiguous the signal is, because it gives us a sense of how likely the signal is due to chance alone: the larger the Chi-square value, the less likely the signal is due to chance. A Chi-square of 4 means there is only a 5% chance the observed signal is due to chance. A Chi-square of 8 means there is only a 0.5% chance of it being due to chance.6
For the 18+ group, there are 57 AEs with a Chi-square larger than myocarditis (Chi-square=303.8) and 68 with a Chi-square larger than pericarditis (Chi-square=229.5). Again, you can see what these are by going the Excel file linked above and sorting on Column D.
For the 12-17 group, there are 4 AEs with a larger Chi-square than myocarditis (Chi-square=681.5) and 6 larger than pericarditis (Chi-square=175.4).
For the 5-11 group, there are 22 AEs with a Chi-square larger than myocarditis (Chi-square=30.42) and 34 AEs with a Chi-square larger than pericarditis (Chi-square=18.86). RESPONDING TO OBJECTIONS
Let’s dispense with some of the criticisms used to dismiss VAERS data, which will undoubtedly be raised if you try to bring the CDC’s analysis to people’s attention.
Objection: Anybody can report to VAERS. The reports are unreliable. Anti-vaxxers made lots of fraudulent reports. Nobody was aware of VAERS in the past, but now they are. So many people were afraid of the vaccine so they blamed all their health problems on it. Health workers were required by law to report certain adverse events, like deaths and anaphylaxis. Etc. Etc.

All of these objections ultimately rely on the notion that VAERS reports for COVID-19 vaccines have been artificially inflated over previous years for one reason or another. The thing of it is, though, that the CDC has a method for distinguishing between artificial inflation and real signal. The idea is simple: if adverse events are artificially inflated, they should be artificially inflated to the same degree. Meaning, the PRRs for all of these safety signals should be about the same. But even a casual glance at the PRRs in the Excel file show they vary widely, from as low at 2 to as high as 105 for vaccine breakthrough infection or 74 for cerebral thrombosis. This method does not on the number of reports, but the rate of reporting for certain events out of all events reported. If anything, this method would tend to hide safety signals in a situation where a new vaccine generates a very large number of reports.

The CDC has even done us the favor of calculating upper and lower confidence intervals, meaning that we can be at least 95% confident that two PRRs are truly different if their confidence intervals don’t overlap. So for example the lower confidence interval for pulmonary thrombosis is 19.7, which is higher than the upper confidence interval for 543 other signals. Artificially inflated reporting cannot explain why so many different adverse events have large PRRs that are statistically distinct from one another.

Objection: The safety signals are due to the huge number of COVID vaccines given out. Never before have we given out so many vaccine doses. By the end of July, the US had administered something like 600 million vaccine doses to people aged 18+. But the CDC analysis compares VAERS reports for these doses to all doses for all other vaccines for this age group since Jan. 1, 2009. But from 2015-2020 there were over 100 million flu doses administered annually to this age group alone. In previous work, I estimated 538 million doses of flu given to people 18+ from July 2015-June 2020. The number of flu and other non-COVID vaccines for this age group administered from Jan 1., 2009 through July 29, 2022 must be well over double this number, meaning VAERS reports for COVID vaccines are being compared to reports for at least double the number of doses for other vaccines. In addition to this, as already noted, the PRR methodology does not depend, strictly speaking, on the number of doses, but rather the rate of reporting of a specific AE out of all AEs for that vaccine.

Objection: the vaccines are mainly being given to older people who tend to have health problems, whereas other vaccines are given to younger people. This objection is dealt with, since the analyses are stratified by age groups. It might be still be somewhat valid for the 18+ group, except that in the safety signal analysis I did in the fall of 2021, I stratified by smaller age bands and still found safety signals. In any case, this objection is not enough to dismiss the safety signal analysis out of hand, but rather calls for better and more refined research.

Objection: The VAERS data is not verified and cannot be trusted. I’ll be the first person to agree that VAERS is not high quality data, but if it is completely untrustworthy, then how is it that the CDC uses these data to publish in the best medical journals such as JAMA and The Lancet? If the data were worthless, then these journals shouldn’t accept these papers. In that JAMA paper, they reported that 80% of the myocarditis reports met their definition of myocarditis and were included in the analysis. Many other reports simply needed more details for validation. Furthermore, the CDC has the ability and budget to follow-up on every report VAERS receives to get more details and even medical records to verify the report.

So if myocarditis shows a clear signal in the CDC’s analysis, and 80% of those reports were apparently high quality enough to be included in a paper published in one of the world’s top medical journals, how is it possible that all the rest of the reports are junk? That all of the other safety signals are meaningless? Answer: it isn’t.

And since we’re on the topic of safety signals that turned out to be real, it’s instructive to find appendicitis turn up as a safety signal in all 3 age groups, since a study published in NEJM based on medical records of over a million adult Israelis found an increased risk of appendicitis in the 42 days following Pfizer vaccination (but not following a positive SARS-CoV-2 PCR test). That study also found an increase in lymphadenopathy (swollen lymph nodes) after vaccination, but not after positive COVID test. Lymphadenopathy was another safety signal.

And that brings us to our last objection to be dispensed with: all of these AEs were due to COVID. There was an epidemic and so people were falling ill due to COVID and having all of these problems that were then blamed on the vaccine. Well to begin with, as we just saw, at least two of them (appendicitis and lymphadenopathy) do not appear to have increased risk ratios following a positive SARS-CoV-2 test, and we know that the mRNA vaccines increase risk of myo/pericarditis independent of infections. So how can we assume the rest of these are and dismiss them with the wave of a hand? We can’t. At minimum, they need further investigation. Furthermore, in the safety signal analysis I did in 2021, I dropped all VAERS reports where any sign of a SARS-CoV-2 exposure or infection was indicated on the report, and I still found large, significant safety signals.
PUTTING IT ALL INTO PERSPECTIVE
The Epoch Times article quotes my esteemed colleague and friend, Norman Fenton, Professor of Risk Management and an world renowned expert in Bayesian statistical analysis: “from a Bayesian perspective, the probability that the true rate of the AE of the COVID-19 vaccines is not higher than that of the non-COVID-19 vaccines is essentially zero…. The onus is on the regulators to come up with some other causal explanation for this difference if they wish to claim that the probability a COVID vaccine AE results in death is not significantly higher than that of other vaccines.” (See his post on the CDC analysis here.) The same is true for all the safety signals they found.
The CDC’s VAERS SOP analysis document lists 18 Adverse Events of Special Interest says they are going to pay close attention to. In their 2021 JAMA paper (and similar presentations to ACIP), the researchers responsible for analyzing the millions of medical records in the CDC’s Vaccine Safety Datalink (VSD) using the ‘Rapid Cycle Analysis’ only studied 23 outcomes. A Similar analysis in NEJM from Israeli researchers focused on only 25 outcomes. Compare this to over 700 safety signals found by the CDC when they finally decided to look—and that’s not even counting all the adverse events that have never been reported for other vaccines so cannot ever show a safety signal by definition. How can the CDC say that these safety signals are meaningless if almost none of them have been studied any further? And yet we are assured that these vaccines have undergone the most intensive safety monitoring effort in history. It’s complete and utter hogwash!
* *
Josh Guetzkow is a senior lecturer at The Hebrew University of Jerusalem. Subscribe to his Substack here.
1) To be precise, the ‘adverse events’ are for ‘preferred terms’ (PTs) which is a type/level of classification used in the Medical Dictionary for Regulatory Activities (MedDRA), which is the classification system used by VAERS and in other pharmacovigilance systems and clinical research for coding reported adverse events. Not all preferred terms are a symptom or adverse event per se. Some refer to a specific diagnostic test that was done or a treatment that was given.
2) It’s not entirely clear how they divided these up, since there are clearly AEs that should be considered serious that don’t show up in the serious Excel table — though maybe they don’t come up simply because they are looking within serious reports. I believe that they just filtered the reports to include only serious reports or non-serious reports, then did the safety signal analysis on all the AE’s coded in those reports. The reason I think this is that I used the MedAlerts Wayback Machine, selected just the serious COVID-19 vaccine reports, and the numbers of total reports was very close to the one in the table provided by the CDC (MedAlerts actually had a bit less). The files obtained by the Epoch Times do not include much in the way of a description as to how the analyses were done, so I had to infer some details, which might be incorrect. I will try to note when I am drawing an inference about how the analysis was done.
3) Generally speaking, these figures show the top ten AEs in each category. In some cases I combined AEs that indicated the same thing, such as combining ‘heart rate irregular’ with ‘arrythmia.’ [UPDATE: Note that the charts of all categories, cardiac and thrombo-embolic events were updated on Jan 7, 2023. The reason is that I had previously categorized acute myocardial infarction as a cardiac issue and myocardial infarction as thrombo-embolic. To be consistent, I have now combined myocardial infarction and acute myocardial infarction into one AE category in the thrombo-embolic events (which made the total AEs reported for that category larger than for pulmonary ones) and then added a different cardiac AE to the cardiovascular AE category, ventricular extrasystoles, AKA premature ventricular contraction (PVC), which dependent on frequency and the presence of other cardiomyopathies is associated with sudden cardiac arrest.]
4) Note that using the myo-pericarditis signal as a yardstick doesn’t mean that these are the only signals that matter. To give one example, anaphylactic reactions don’t even show up in the list of safety signals, even though that was one of the very first risk of the vaccine that became apparent from day one of the vaccine rollout.
One potential objection to this benchmark is that it is too low of a bar, since myo-pericarditis appears to disproportionately affect younger men and so a proper safety signal should be stratified by age and gender then compared with myocarditis similarly stratified. I agree, and it is the CDC’s job to do that. But the fact is that any adverse reaction might disproportionately affect some subgroup of people, in which case the safety signal for that group would be similarly faint or diluted when we look at everyone together. So objection overruled.
5) In their Standard Operation Procedures document, the CDC said they would combine these and related codes together to assess a safety signal, but never mind – at least they finally got around to doing something.
6) In this context, the Chi-square is largely driven by the sheer number of adverse events: the more adverse events reported, including for the comparator vaccine, the larger the Chi-square. For example, the PRR for pericarditis and subdural haematoma is the same (2.82), but there were 1,701 incidents of pericarditis reported for mRNA COVID vaccines versus 221for the comparator vaccines, with Chi-square of 229.5. For subdural haematoma, these numbers are 162 verus 21, for a Chi-square of 21.2.
CDC and FDA Findings. Alarming new information from the CDC + FDA that everyone else has known for almost two years
CDC & FDA Identify Preliminary COVID-19 Vaccine Safety Signal for Persons Aged 65 Years and Older Updated Jan. 13, 2023 Español | Other Languages Print
Transparency and vaccine safety are top priorities for the Centers for Disease Control and Prevention (CDC) and the Food and Drug Administration (FDA). U.S. government agencies use multiple, complementary safety monitoring systems to help detect possible safety signals for vaccines and other medical countermeasures as early as possible and to facilitate further investigation, as appropriate. Often these safety systems detect signals that could be due to factors other than the vaccine itself.
All signals require further investigation and confirmation from formal epidemiologic studies. When one system detects a signal, the other safety monitoring systems are checked to validate whether the signal represents an actual concern with the vaccine or if it can be determined to be of no clinical relevance.
Following the availability and use of the updated (bivalent) COVID-19 vaccines, CDC’s Vaccine Safety Datalink (VSD), a near real-time surveillance system, met the statistical criteria to prompt additional investigation into whether there was a safety concern for ischemic stroke in people ages 65 and older who received the Pfizer-BioNTech COVID-19 Vaccine, Bivalent. Rapid-response investigation of the signal in the VSD raised a question of whether people 65 and older who have received the Pfizer-BioNTech COVID-19 Vaccine, Bivalent were more likely to have an ischemic stroke in the 21 days following vaccination compared with days 22-42 following vaccination.
This preliminary signal has not been identified with the Moderna COVID-19 Vaccine, Bivalent. There also may be other confounding factors contributing to the signal identified in the VSD that merit further investigation. Furthermore, it is important to note that, to date, no other safety systems have shown a similar signal and multiple subsequent analyses have not validated this signal:
A large study of updated (bivalent) vaccines (from Pfizer-BioNTech and Moderna) using the Centers for Medicare and Medicaid Services database revealed no increased risk of ischemic stroke
A preliminary study using the Veterans Affairs database did not indicate an increased risk of ischemic stroke following an updated (bivalent) vaccine
The Vaccine Adverse Event Reporting System (VAERS) managed by CDC and FDA has not seen an increase in reporting of ischemic strokes following the updated (bivalent) vaccine
Pfizer-BioNTech’s global safety database has not indicated a signal for ischemic stroke with the updated (bivalent) vaccine
Other countries have not observed an increased risk for ischemic stroke with updated (bivalent) vaccines
Although the totality of the data currently suggests that it is very unlikely that the signal in VSD represents a true clinical risk, we believe it is important to share this information with the public, as we have in the past, when one of our safety monitoring systems detects a signal. CDC and FDA will continue to evaluate additional data from these and other vaccine safety systems. These data and additional analyses will be discussed at the upcoming January 26 meeting of the FDA’s Vaccines and Related Biological Products Advisory Committee.
No change in vaccination practice is recommended. CDC continues to recommend that everyone ages 6 months of age and older stay up-to-date with COVID-19 vaccination; this includes individuals who are currently eligible to receive an updated (bivalent) vaccine. Staying up-to-date with vaccines is the most effective tool we have for reducing death, hospitalization, and severe disease from COVID-19, as has now been demonstrated in multiple studies conducted in the United States and other countries:
Data have shown an updated COVID-19 vaccine reduces the risk of hospitalization from COVID-19 by nearly 3-fold compared to those who were previously vaccinated but have not yet received the updated vaccine.
Data have shown that the updated COVID-19 vaccine also reduces the risk of death from COVID-19 by nearly 19-fold compared to those who are unvaccinated.
Other preliminary data from outside the U.S. have demonstrated more than 80% protection against severe disease and death from the bivalent vaccine compared to those who have not received the bivalent vaccine.
Overall safety data for the bivalent COVID-19 vaccines are available here.
Once again, no change is recommended in COVID-19 vaccination practice, which can be found here.
Its clear that a non approved administration is taking polace via proxy contamination of mothers breast mmilk if she is nursing on the breast. Does this harm the infaants natural immune system development? What is the effect on the childs developing immune system? Does it damamge mitochondrial immune support systems? What does it do to short chain fatty acids in the infants intestinal flora? Is this contamination contributing to the epidemic of respiratory cases ending up in hospitals post Pandemic?
Research Letter
September 26, 2022
Detection of Messenger RNA COVID-19 Vaccines in Human Breast Milk
Vaccination is a cornerstone in fighting the COVID-19 pandemic. However, the initial messenger RNA (mRNA) vaccine clinical trials excluded several vulnerable groups, including young children and lactating individuals.1 The US Food and Drug Administration deferred the decision to authorize COVID-19 mRNA vaccines for infants younger than 6 months until more data are available because of the potential priming of the children’s immune responses that may alter their immunity.2 The Centers for Disease Control and Prevention recommends offering the COVID-19 mRNA vaccines to breastfeeding individuals,3 although the possible passage of vaccine mRNAs in breast milk resulting in infants’ exposure at younger than 6 months was not investigated. This study investigated whether the COVID-19 vaccine mRNA can be detected in the expressed breast milk (EBM) of lactating individuals receiving the vaccination within 6 months after delivery.
Methods
This cohort study included 11 healthy lactating individuals who received either the Moderna mRNA-1273 vaccine (n = 5) or the Pfizer BNT162b2 vaccine (n = 6) within 6 months after delivery (Table 1). Participants were asked to collect and immediately freeze EBM samples at home until transported to the laboratory. Samples of EBM were collected before vaccination (control) and for 5 days postvaccination. A total of 131 EBM samples were collected 1 hour to 5 days after vaccine administration. Extracellular vesicles (EVs) were isolated in EBM using sequential centrifugation, and the EV concentrations were determined by ZetaView (Analytik) (eMethods in the Supplement). The presence of COVID-19 vaccine mRNA in different milk fractions (whole EBM, fat, cells, and supernatant EVs) was assayed using 2-step quantitative reverse transcriptase–polymerase chain reaction. The vaccine detection limit was 1 pg/mL of EBM (eMethods in the Supplement).
Results
Of 11 lactating individuals enrolled, trace amounts of BNT162b2 and mRNA-1273 COVID-19 mRNA vaccines were detected in 7 samples from 5 different participants at various times up to 45 hours postvaccination (Table 2). The mean (SD) yield of EVs isolated from EBM was 9.110 (5.010) particles/mL, and the mean (SD) particle size was 110.0 (3.0) nm. The vaccine mRNA appears in higher concentrations in the EVs than in whole milk (Table 2). No vaccine mRNA was detected in prevaccination or postvaccination EBM samples beyond 48 hours of collection. Also, no COVID-19 vaccine mRNA was detected in the EBM fat fraction or the EBM cell pellets.
Discussion
The sporadic presence and trace quantities of COVID-19 vaccine mRNA detected in EBM suggest that breastfeeding after COVID-19 mRNA vaccination is safe, particularly beyond 48 hours after vaccination. These data demonstrate for the first time to our knowledge the biodistribution of COVID-19 vaccine mRNA to mammary cells and the potential ability of tissue EVs to package the vaccine mRNA that can be transported to distant cells. Little has been reported on lipid nanoparticle biodistribution and localization in human tissues after COVID-19 mRNA vaccination. In rats, up to 3 days following intramuscular administration, low vaccine mRNA levels were detected in the heart, lung, testis, and brain tissues, indicating tissue biodistribution.4 We speculate that, following the vaccine administration, lipid nanoparticles containing the vaccine mRNA are carried to mammary glands via hematogenous and/or lymphatic routes.5,6 Furthermore, we speculate that vaccine mRNA released into mammary cell cytosol can be recruited into developing EVs that are later secreted in EBM.
The limitations of this study include the relatively small sample size and the lack of functional studies demonstrating whether detected vaccine mRNA is translationally active. Also, we did not test the possible cumulative vaccine mRNA exposure after frequent breastfeeding in infants. We believe it is safe to breastfeed after maternal COVID-19 vaccination. However, caution is warranted about breastfeeding children younger than 6 months in the first 48 hours after maternal vaccination until more safety studies are conducted. In addition, the potential interference of COVID-19 vaccine mRNA with the immune response to multiple routine vaccines given to infants during the first 6 months of age needs to be considered. It is critical that lactating individuals be included in future vaccination trials to better evaluate the effect of mRNA vaccines on lactation outcomes.
Correction: This article was corrected on September 30, 2022, to fix the year of the study period and other minor typographical errors in the eMethods in the Supplement.
Corresponding Author: Nazeeh Hanna, MD, Division of Neonatology, Department of Pediatrics, NYU Langone Hospital–Long Island, NYU Long Island School of Medicine, 259 First St, Mineola, NY 11501 (nazeehhanna@gmail.com).
Author Contributions: Dr Hanna had full access to all of the data in the study and takes responsibility for the integrity of the data and the accuracy of the data analysis.
University of California San Diego School of Medicine researchers have identified the molecular mechanism activated by the presence of tetrahydrocannabinol (THC) — the ingredient that causes people to feel the euphoria or “high” associated with cannabis — in the bloodstream that accelerates cancer growth in patients with human papillomavirus (HPV)-positive head and neck squamous cell carcinoma.
“HPV-related head and neck cancer is one of the fastest growing cancers in the United States. While at the same time, exposure to marijuana is accelerating. This is a huge public health problem,” said Joseph A. Califano III, MD, senior author and professor and vice chief of the Division of Otolaryngology in the Department of Surgery at UC San Diego School of Medicine.
Head and neck squamous cell carcinoma is the sixth most common cancer worldwide. These cancers begin in the cells that line the mucous membranes inside the mouth, nose and throat. Approximately 30 percent of cases of this disease are related to HPV infection, and it is these cases, in particular that are on the rise. Califano suggested increased marijuana use may be a driving factor.
Previous studies have linked daily marijuana exposure to an increased prevalence of HPV-related throat cancer. However, a mechanism linking cannabis exposure to increased growth of the cancer was unknown.
Reporting in the January 13, 2020 online edition of Clinical Cancer Research, a journal of the American Association for Cancer Research, researchers outline how the presence of THC in the bloodstream activates the p38 MAPK pathway, which controls programmed cell death called apoptosis. When activated, p38 MAPK prevents apoptosis from occurring, thus allowing cancer cells to grow uncontrollably.
Working with Chao Liu, MD, visiting scientist at UC San Diego and a physician at China’s Central South University, and other colleagues, Califano and team used animal and human cell lines to show that THC turns p38 MAPK on and were able to stop the growth of HPV-positive head and neck cancer by turning off the pathway.
The team then analyzed blood samples from patients with HPV-related throat cancer who had their genomes comprehensively mapped to define activated gene pathways. Similar to the cell lines, the blood samples showed p38 MAPK activation and loss of apoptosis in tumors from patients with THC in their blood.
In another study Hart S, Fischer et al. found that concentrations of THC comparable with those detected in the serum of patients after THC administration accelerate proliferation of cancer cells instead of apoptosis and thereby contribute to cancer progression in patients.
This has major ramifications for treatment of HPV cancers which are so prevalent at this time.
The smoke from marijuana must also be suspect in cancer based solely on our experience with cigarettes and cancer which has enormous documentation.
Bibliography
Yadira Galindo. How Marijuana Accelerates Growth of HPV-related Head and Neck Cancer Identified. January 13, 2020 |
Hart S, Fischer OM, Ullrich A. Cannabinoids induce cancer cell proliferation via tumor necrosis factor alpha-converting enzyme (TACE/ADAM17)-mediated transactivation of the epidermal growth factor receptor. Cancer Res. 2004 Mar 15;64(6):1943-50. doi: 10.1158/0008-5472.can-03-3720. PMID: 15026328.
December 22, 2021|Updated December 22, 2021 at 10:01 a.m. EST
Harvard University professor Charles Lieber departs federal court in Boston on Jan. 30, 2020. (Charles Krupa/AP)
A Harvard University chemistry professor was convicted in federal court on Tuesday of concealing his ties to China, securing a victory for the Justice Department’s controversial and faltering initiative to address accusations of “Chinese economic espionage” in the United States.
A jury in U.S. District Court in Boston found the professor, Charles Lieber, guilty on two counts of lying to federal authorities, two counts of falsifying tax returns and two counts of failing to report foreign finances.
Lieber, a former chair of Harvard’s chemistry department, had for three years worked as a “strategic scientist” at the Wuhan University of Technology in China as part of Beijing’s Thousand Talents recruitment program. As part of his contract from 2012 to 2015, according to an affidavit, the university in Wuhan paid Lieber a salary of as much as $50,000 per month, $150,000 in annual living expenses and grants of more than $1.5 million to create a research lab at the Chinese university.
Harvard University Professor Convicted of Making False Statements and Tax Offenses
Dr. Charles Lieber found guilty of concealing his affiliation with the Wuhan University of Technology and his participation in China’s Thousand Talents Program
BOSTON – The former Chair of Harvard University’s Chemistry and Chemical Biology Department was convicted by a federal jury today in connection with lying to federal authorities about his affiliation with People’s Republic of China’s Thousand Talents Program and the Wuhan University of Technology (WUT) in Wuhan, China, as well as failing to report income he received from WUT.
Dr. Charles Lieber, 62, was convicted following a six-day jury trial of two counts of making false statements to federal authorities, two counts of making and subscribing a false income tax return and two counts of failing to file reports of foreign bank and financial accounts (FBAR) with the Internal Revenue Service (IRS). U.S. Senior District Court Judge Rya W. Zobel will sentence Lieber at a later date that has not yet been scheduled. Lieber was indicted in June 2020 and was subsequently charged in a superseding indictment in July 2020.
“There is now no question that Charles Lieber lied to federal investigators and to Harvard in an attempt to hide his participation in the Chinese Thousand Talents Program,” said Acting United States Attorney Nathaniel R. Mendell. “He lied to the IRS about the money he was paid, and he concealed his Chinese bank account from the United States. The jury followed the evidence and the law to a just verdict.”
“Today’s verdict reinforces our commitment to protect our country’s position as a global leader in research and innovation and to hold those accountable who exploit and undermine that position through dishonesty. By Charles Lieber’s own admission – after we arrested him – the evidence against him was formidable. He repeatedly lied to his employer, the federal government, and taxpayers to fraudulently maintain access to federal research funds,” Joseph R. Bonavolonta, Special Agent in Charge of the Federal Bureau of Investigation, Boston Division. “Mr. Lieber exploited the openness and transparency of our academic system. The FBI will not hesitate to work with our law enforcement partners to focus on those who put their financial and professional interests ahead of our country’s economic prosperity.”
“The Department of Defense (DoD) Office of Inspector General’s Defense Criminal Investigative Service (DCIS) investigates foreign conflicts of interest in DoD grant programs,” said Patrick J. Hegarty Patrick J. Hegarty, Special Agent in Charge of the Defense Criminal Investigative Service, Northeast Field Office. “Mr. Lieber lied to DCIS Special Agents about his ties to the Chinese government while conducting research for the DoD, and he eroded the trust the DoD has in its researchers to prioritize the United States and its service members over foreign governments, and over personal financial gain.”
“NCIS continues to aggressively protect the Department of the Navy’s technologies and strategic advantages provided as a result of years of investment in cutting edge research and technology development” said Michael Wiest, Special Agent in Charge of the Naval Criminal Investigative Service (NCIS), Northeast Field Office. “By failing to disclose his connections and foreign support, Mr. Lieber broke a trust and undermined the integrity of research that the federal government paid for. The guilty verdicts in this case are the results of exceptional teamwork with the U.S. Attorney’s Office and our federal partners at the FBI, DCIS, IRS and NIH.”
“We expect professors like Dr. Lieber who are privileged to be part of taxpayer-funded research to be honest in their actions,” said Philip M. Coyne, Special Agent in Charge of the U.S. Department of Health and Human Services, Office of Inspector General. “Today’s conviction demonstrates OIG’s commitment to ensuring that taxpayer dollars are not wasted, and that those handling these funds are truthful in their dealings with federal agencies.”
“Today’s Guilty verdict is a shining example of IRS-CI’s commitment to investigating international tax crimes” said Joleen D. Simpson, Special Agent in Charge of the Internal Revenue Service-Criminal Investigation Division for the Boston Field Office. “Despite Mr. Lieber’s lengthy effort to conceal assets and underreport his income, the verdict is proof that Mr. Lieber’s actions were intentional, deliberate, and criminal. IRS-CI will continue to work with the United States Attorney’s Office and our Federal law enforcement partners to investigate complex financial fraud that extends beyond the borders of the United States.”
Lieber served as the Principal Investigator of the Lieber Research Group at Harvard University, which received more than $15 million in federal research grants between 2008 and 2019. Unbeknownst to his employer, Harvard University, Lieber became a “Strategic Scientist” at WUT and, later, a contractual participant in China’s Thousand Talents Plan from at least 2012 through 2015. China’s Thousand Talents Plan is one of the most prominent Chinese talent recruitment plans designed to attract, recruit and cultivate high-level scientific talent in furtherance of China’s scientific development, economic prosperity and national security.
Under the terms of Lieber’s three-year Thousand Talents contract, WUT paid Lieber a salary of up to $50,000 per month, living expenses of up to $150,000 and awarded him more than $1.5 million to establish a research lab at WUT. In 2018 and 2019, Lieber lied to federal authorities about his involvement in the Thousand Talents Plan and his affiliation with WUT.
In tax years 2013 and 2014, Lieber earned income from WUT in the form of salary and other payments made to him pursuant to the Strategic Scientist and Thousand Talents Contracts, which he did not disclose to the IRS on his federal income tax returns. Lieber, together with WUT officials, opened a bank account at a Chinese bank during a trip to Wuhan in 2012. Thereafter, between at least 2013 and 2015, WUT periodically deposited portions of Lieber’s salary into that account. U.S. taxpayers are required to report the existence of any foreign bank account that holds more than $10,000 at any time during a given year by the filing an FBAR with the IRS. Lieber failed to file FBARs for the years 2014 and 2015.
The charge of making false statements provides for a sentence of up to five years in prison, three years of supervised release and a fine of $250,000. The charge of making and subscribing false income tax returns provides for a sentence of up to three years in prison, one year of supervised release and a $100,000 fine. The charge of failing to file an FBAR provides for a sentence of up to five years in prison, three years of supervised release and a fine of $250,000. Sentences are imposed by a federal district court judge based upon the U.S. Sentencing Guidelines and other statutory factors.
Acting United States Attorney Mendell; Matthew Olsen, Assistant Attorney General for National Security; FBI SAC Bonavolonta; DCIS SAC Hegarty; NCIS SAC Wiest; HHS OIG SAC Coyne; and IRS CI SAC Simpson made this announcement. Assistant U.S. Attorney Jason Casey of Mendell’s National Security Unit and Assistant U.S. Attorney James R. Drabick of Mendell’s Securities, Financial & Cyber Fraud Unit are prosecuting the case.
1Department of Clinical Sciences, Lund University, 20502 Malmö, Sweden. Infection Medicine, Department of Clinical Sciences, Lund University, 22362 Lund, Sweden
*Author to whom correspondence should be addressed. Academic Editor: Stephen Malnick
Preclinical studies of COVID-19 mRNA vaccine BNT162b2, developed by Pfizer and BioNTech, showed reversible hepatic effects in animals that received the BNT162b2 injection. Furthermore, a recent study showed that SARS-CoV-2 RNA can be reverse-transcribed and integrated into the genome of human cells. In this study, we investigated the effect of BNT162b2 on the human liver cell line Huh7 in vitro. Huh7 cells were exposed to BNT162b2, and quantitative PCR was performed on RNA extracted from the cells. We detected high levels of BNT162b2 in Huh7 cells and changes in gene expression of long interspersed nuclear element-1 (LINE-1), which is an endogenous reverse transcriptase. Immunohistochemistry using antibody binding to LINE-1 open reading frame-1 RNA-binding protein (ORFp1) on Huh7 cells treated with BNT162b2 indicated increased nucleus distribution of LINE-1. PCR on genomic DNA of Huh7 cells exposed to BNT162b2 amplified the DNA sequence unique to BNT162b2. Our results indicate a fast up-take of BNT162b2 into human liver cell line Huh7, leading to changes in LINE-1 expression and distribution. We also show that BNT162b2 mRNA is reverse transcribed intracellularly into DNA in as fast as 6 h upon BNT162b2 exposure.
Jorma Jyrkkanen, 2021-03-19, jjyrkkanen76@outlook.com ph: 1-250-859-5330
Background
After reviewing the work of Sameer Calghatgi et al 2013 it became clear to me that the antibiotic production of ROS and Lipid Peroxide were the byproducts of antibiotics on mitochondria with potential CARDIOLOGY outcomes. From only a preliminary cursory examination of a few of the thousands of genes involved in heart function that are potentially impacted by ROS and LP I found the following potential routes for their impacts on heart and coronary artery diseases which need detailed and close examination with each and every antibiotic in use. I based the cardiology impacts on predictions arising from this work. https://www.heighpubs.org/jccm/pdf/jccm-aid1104.pdf
1. Oxidative damage to DNA, membranes, lipids and proteins, alteration of gene expression
2. Lipid Peroxide
3. Rupture of mitochondria
4. Mutations in mitochondrial proteins and peptides
5. Mutation of heart function genes and probable epigenetic alteration of genes
6. Loss or damage to mitochondria integrity and reproduction essential for heart energy supply
7. Dysbiosis linked issues of pathogenic substances and signalling
8. Inflammation and athersclerosis
9. Damage associated molecular pattern molecules (DAMPs) that are released during condition of oxidative stress.
10. Redox stress leading to release of DAMPs triggering TLR4-mediated inflammation and organ injury.
11. Cardiovascular diseases associated with increases in IL-6, such as atherosclerosis and hypertension, are also associated with oxidative stress, particularly increases in vascular superoxide, suggesting a potential relationship between superoxide, IL-6 and arterial pressure.
12. Interleukin-6 (IL-6) has been emphasized by reports of elevated circulating as well as intracardiac IL-6 levels in patients with congestive heart failure (CHF). IL-6 may contribute to the progression of myocardial damage and dysfunction in chronic heart failure syndrome resulting from different causes
13. ROS at low concentrations have important functions in regulating pathways such as TNFR1 signaling, but high ROS concentrations ultimately lead to DNA damage and cell death. TNF modulates both cardiac contractility and peripheral resistance, the two most important haemodynamic determinants of cardiac function
14. DNA Damage Response/TP53 Pathway Is Activated and Contributes to the Pathogenesis of Dilated Cardiomyopathy Associated With LMNA (Lamin A/C) Mutations
15. Increased ROS generation and reduction in ATP level, contributing to ATP-producing disorders and oxidative stress, which may further accelerate development or vulnerability of atherosclerosis and myocardial ischemic injury
16. Dysregulated ROS production and oxidative stress have been implicated in a host of cardiac diseases, including cardiac hypertrophy, heart failure (HF), cardiac ischemia–reperfusion injury (IRI), and diabetic cardiomyopathy
17. HNE a breakdown product of LP can trigger cardiovascular pathology by inflammation. LP linked to atherogenesis.
18. Dysbiosis triggers immune depression opening door to pathogenic viruses, bacteria, microbial toxins which may also pose a risk to neurological intereference in vagal nerve signalling.
19. Depression of TP53 TSG function affects OP and ATP, antioxidant regulation and stability, programmed senescence
20. Epigenetic effects on cardiology important genes undetermined. Ex; Silencing, turning on when not supposed to, over expression
Reference
Bactericidal Antibiotics Induce Mitochondrial Dysfunction and Oxidative Damage in Mammalian Cells
By Sameer Kalghatgi, Catherine S. Spina, James C. Costello, Marc Liesa, J. Ruben Morones-Ramirez, Shimyn Slomovic, Anthony Molina, Orian S. Shirihai, James J. Collins. Science Translational Medicine03 Jul 2013 : 192ra85. Mitochondrial dysfunction and oxidative damage induced by bactericidal antibiotics in mammalian cells may be alleviated by an antioxidant or prevented by preferential use of bacteriostatic antibiotics.


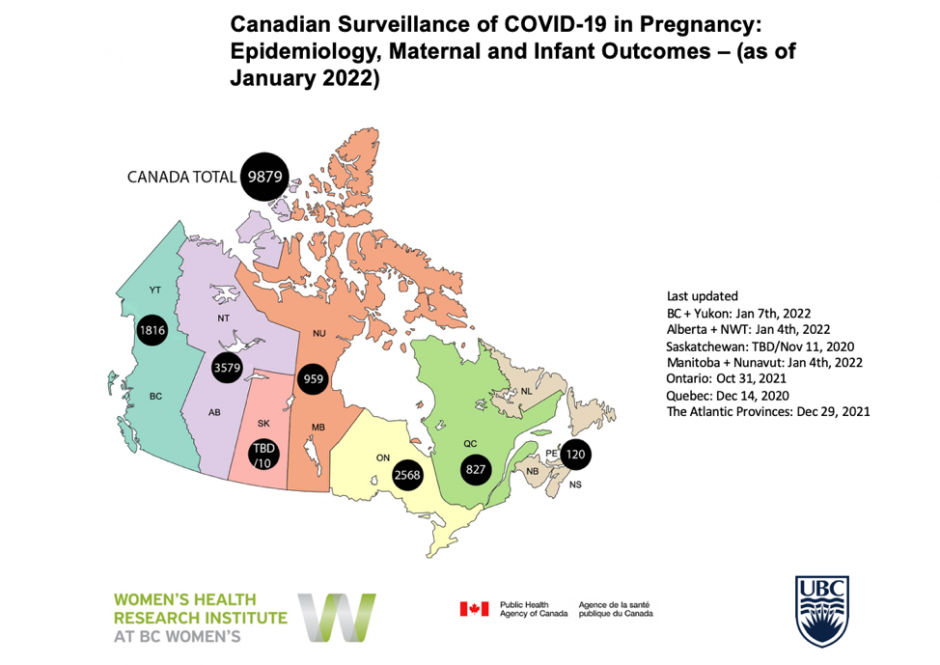


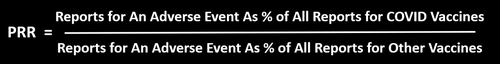


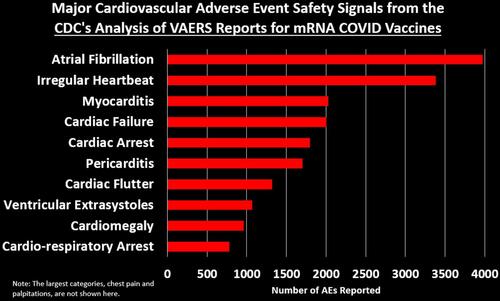
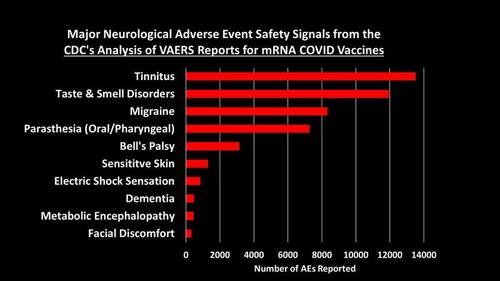
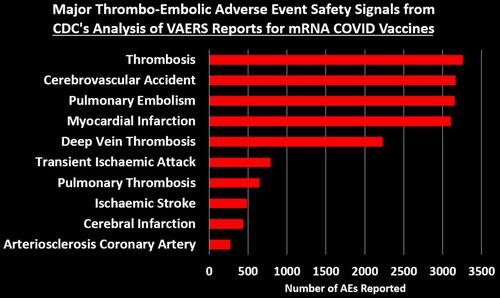

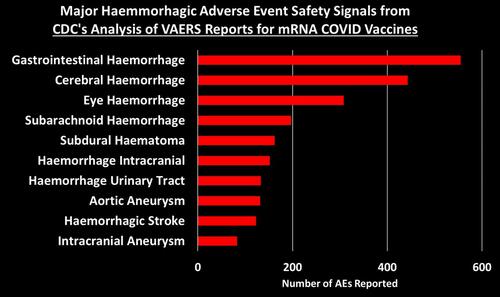
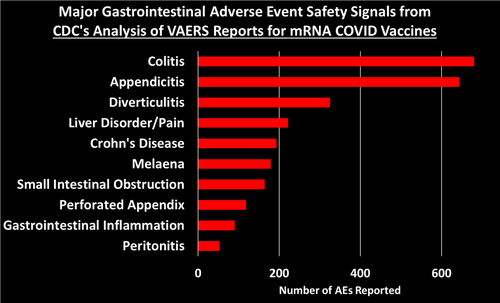

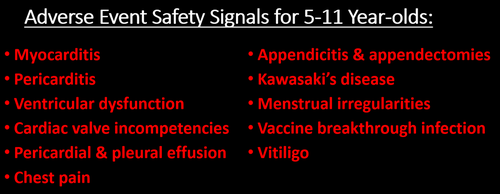


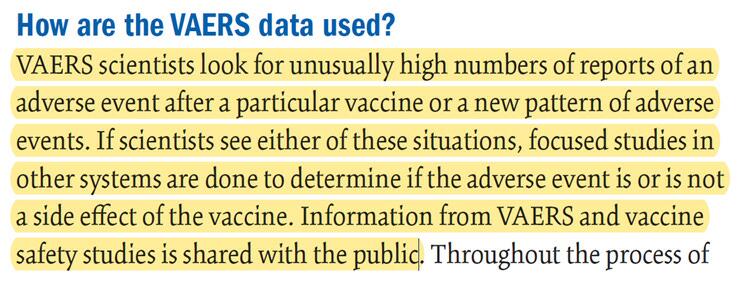
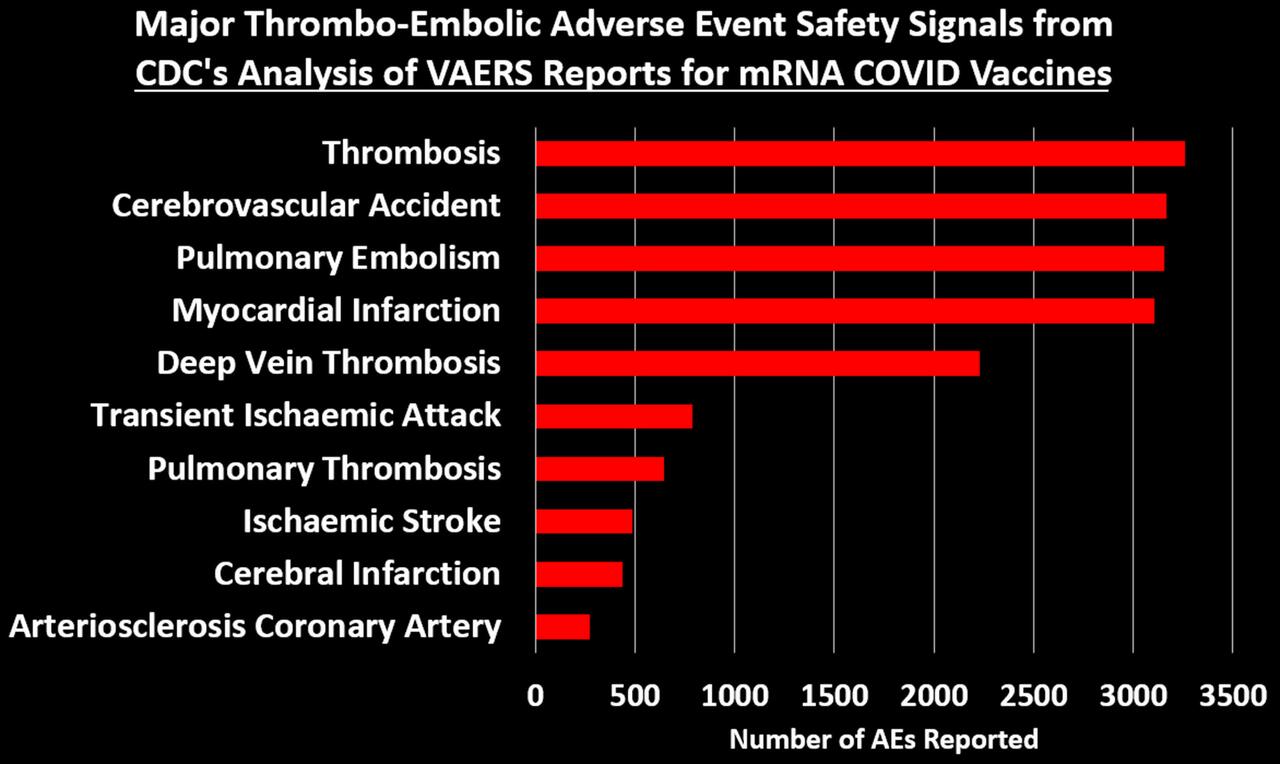
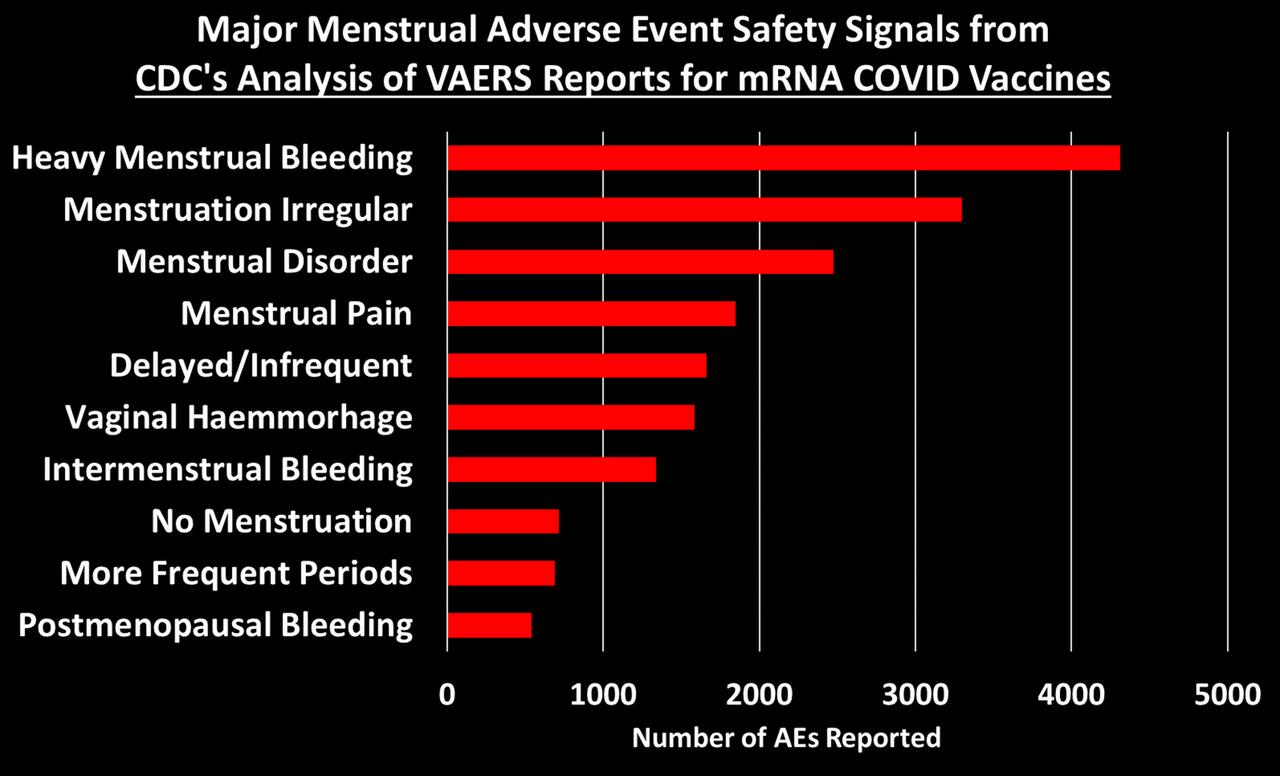
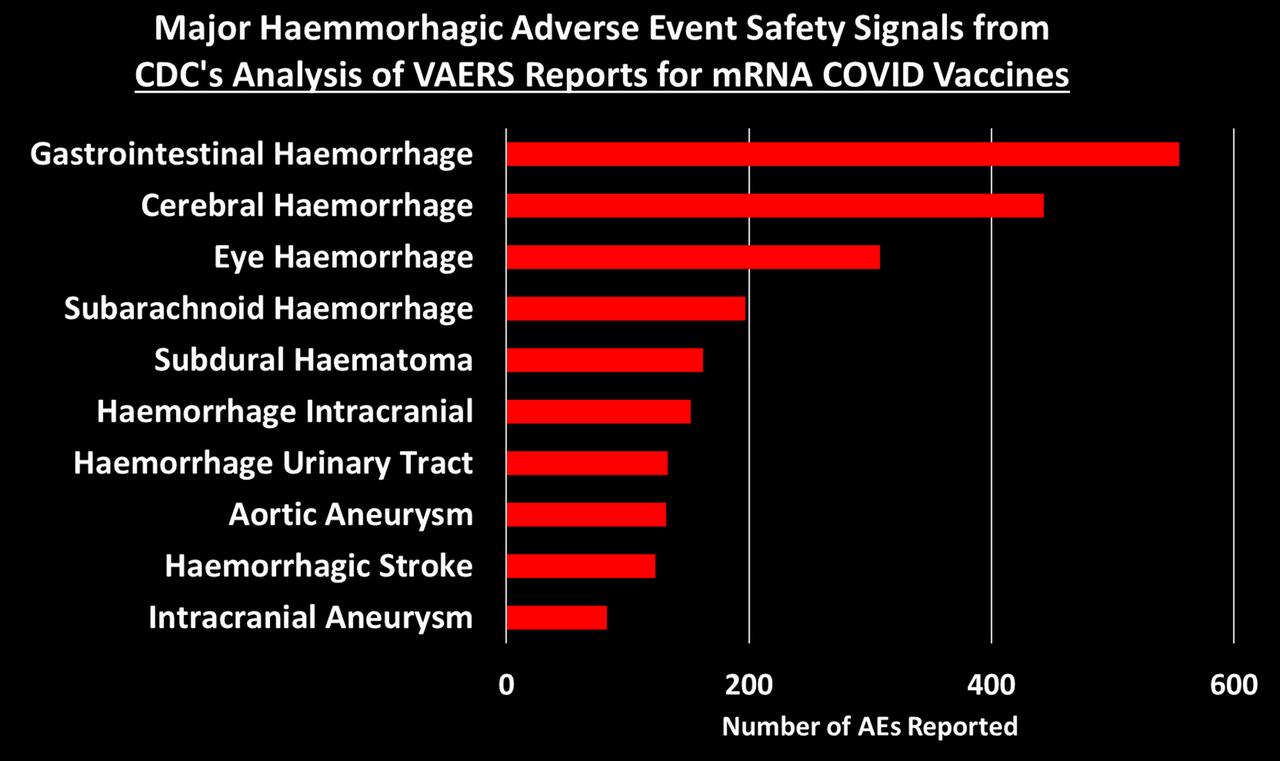
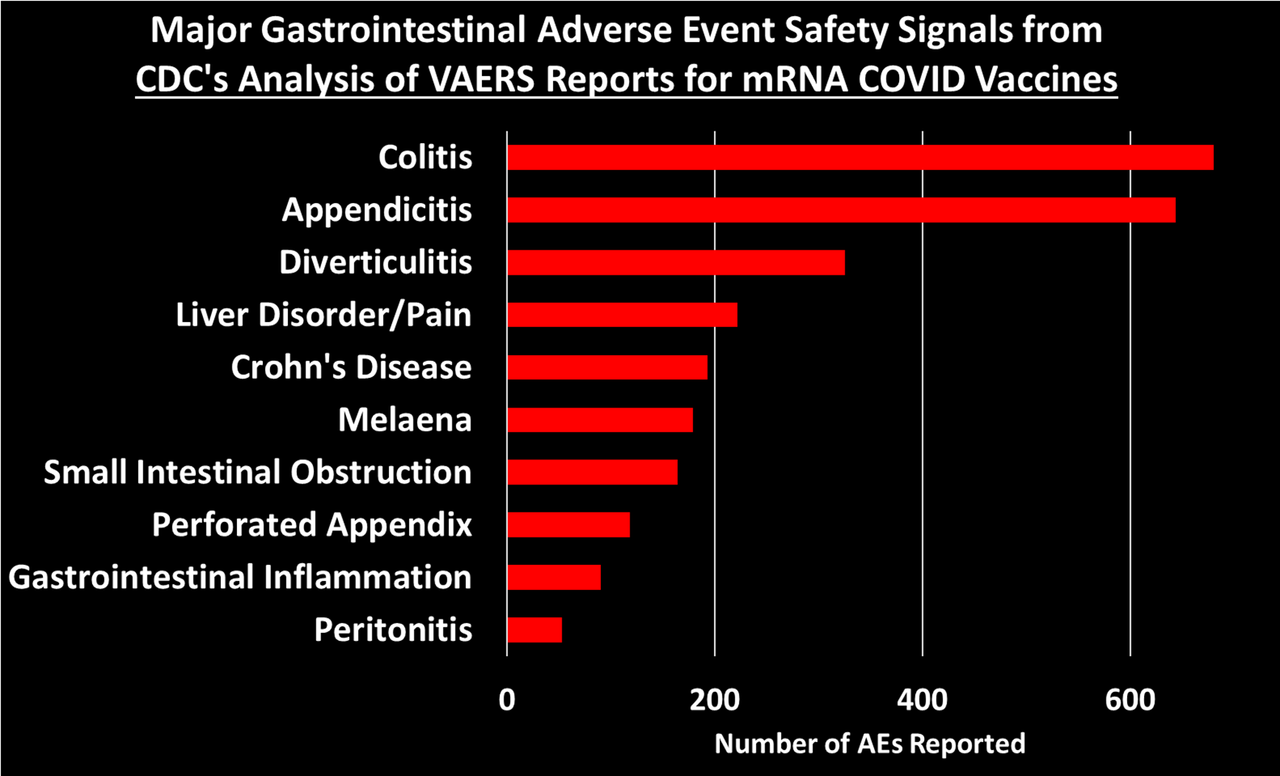
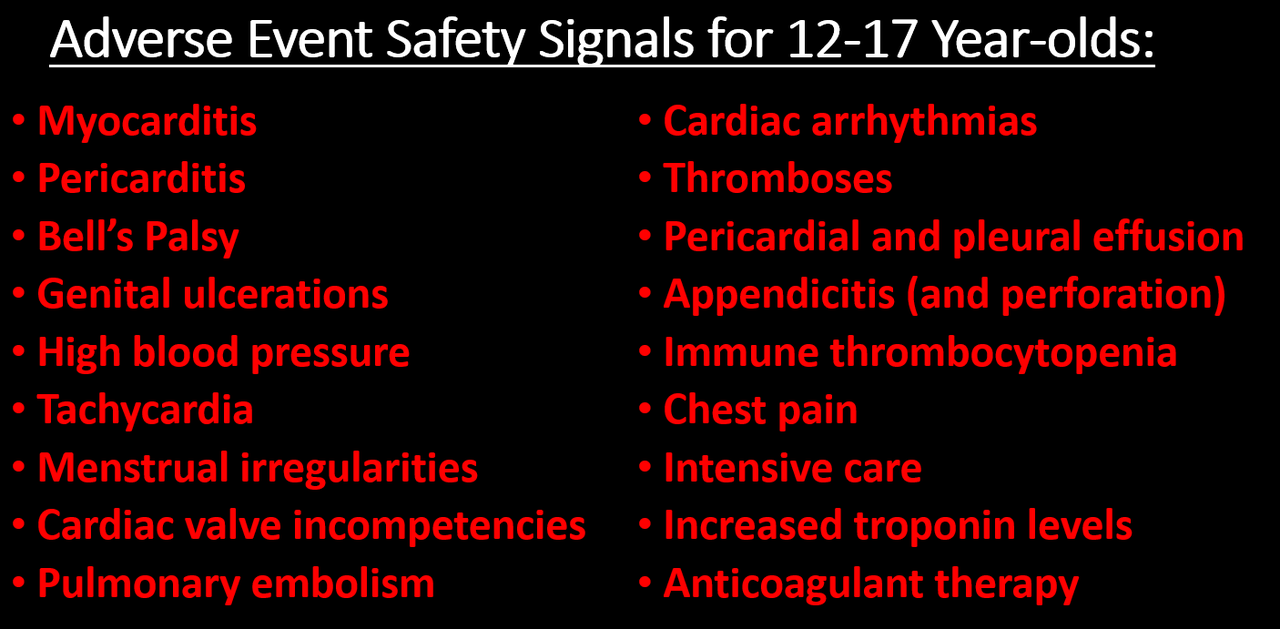
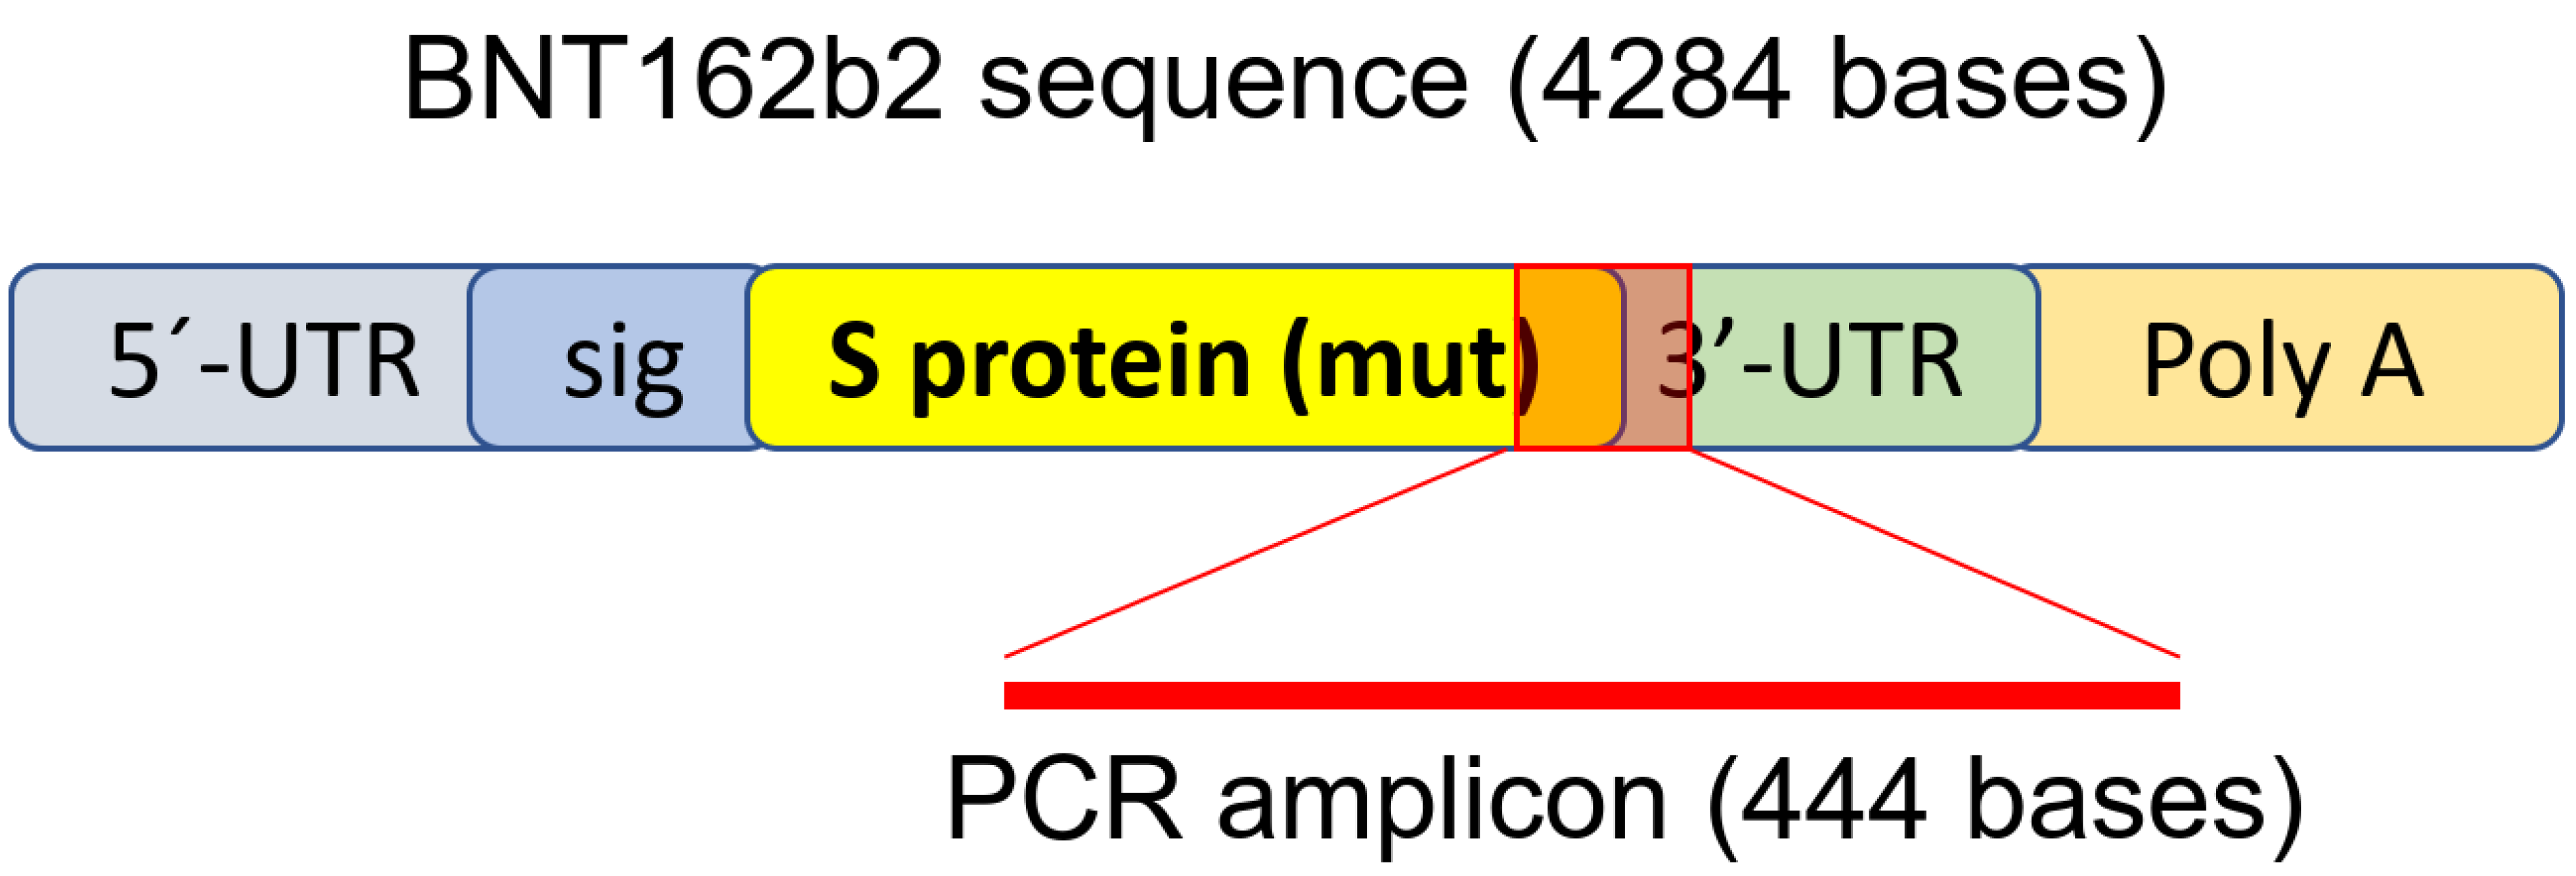
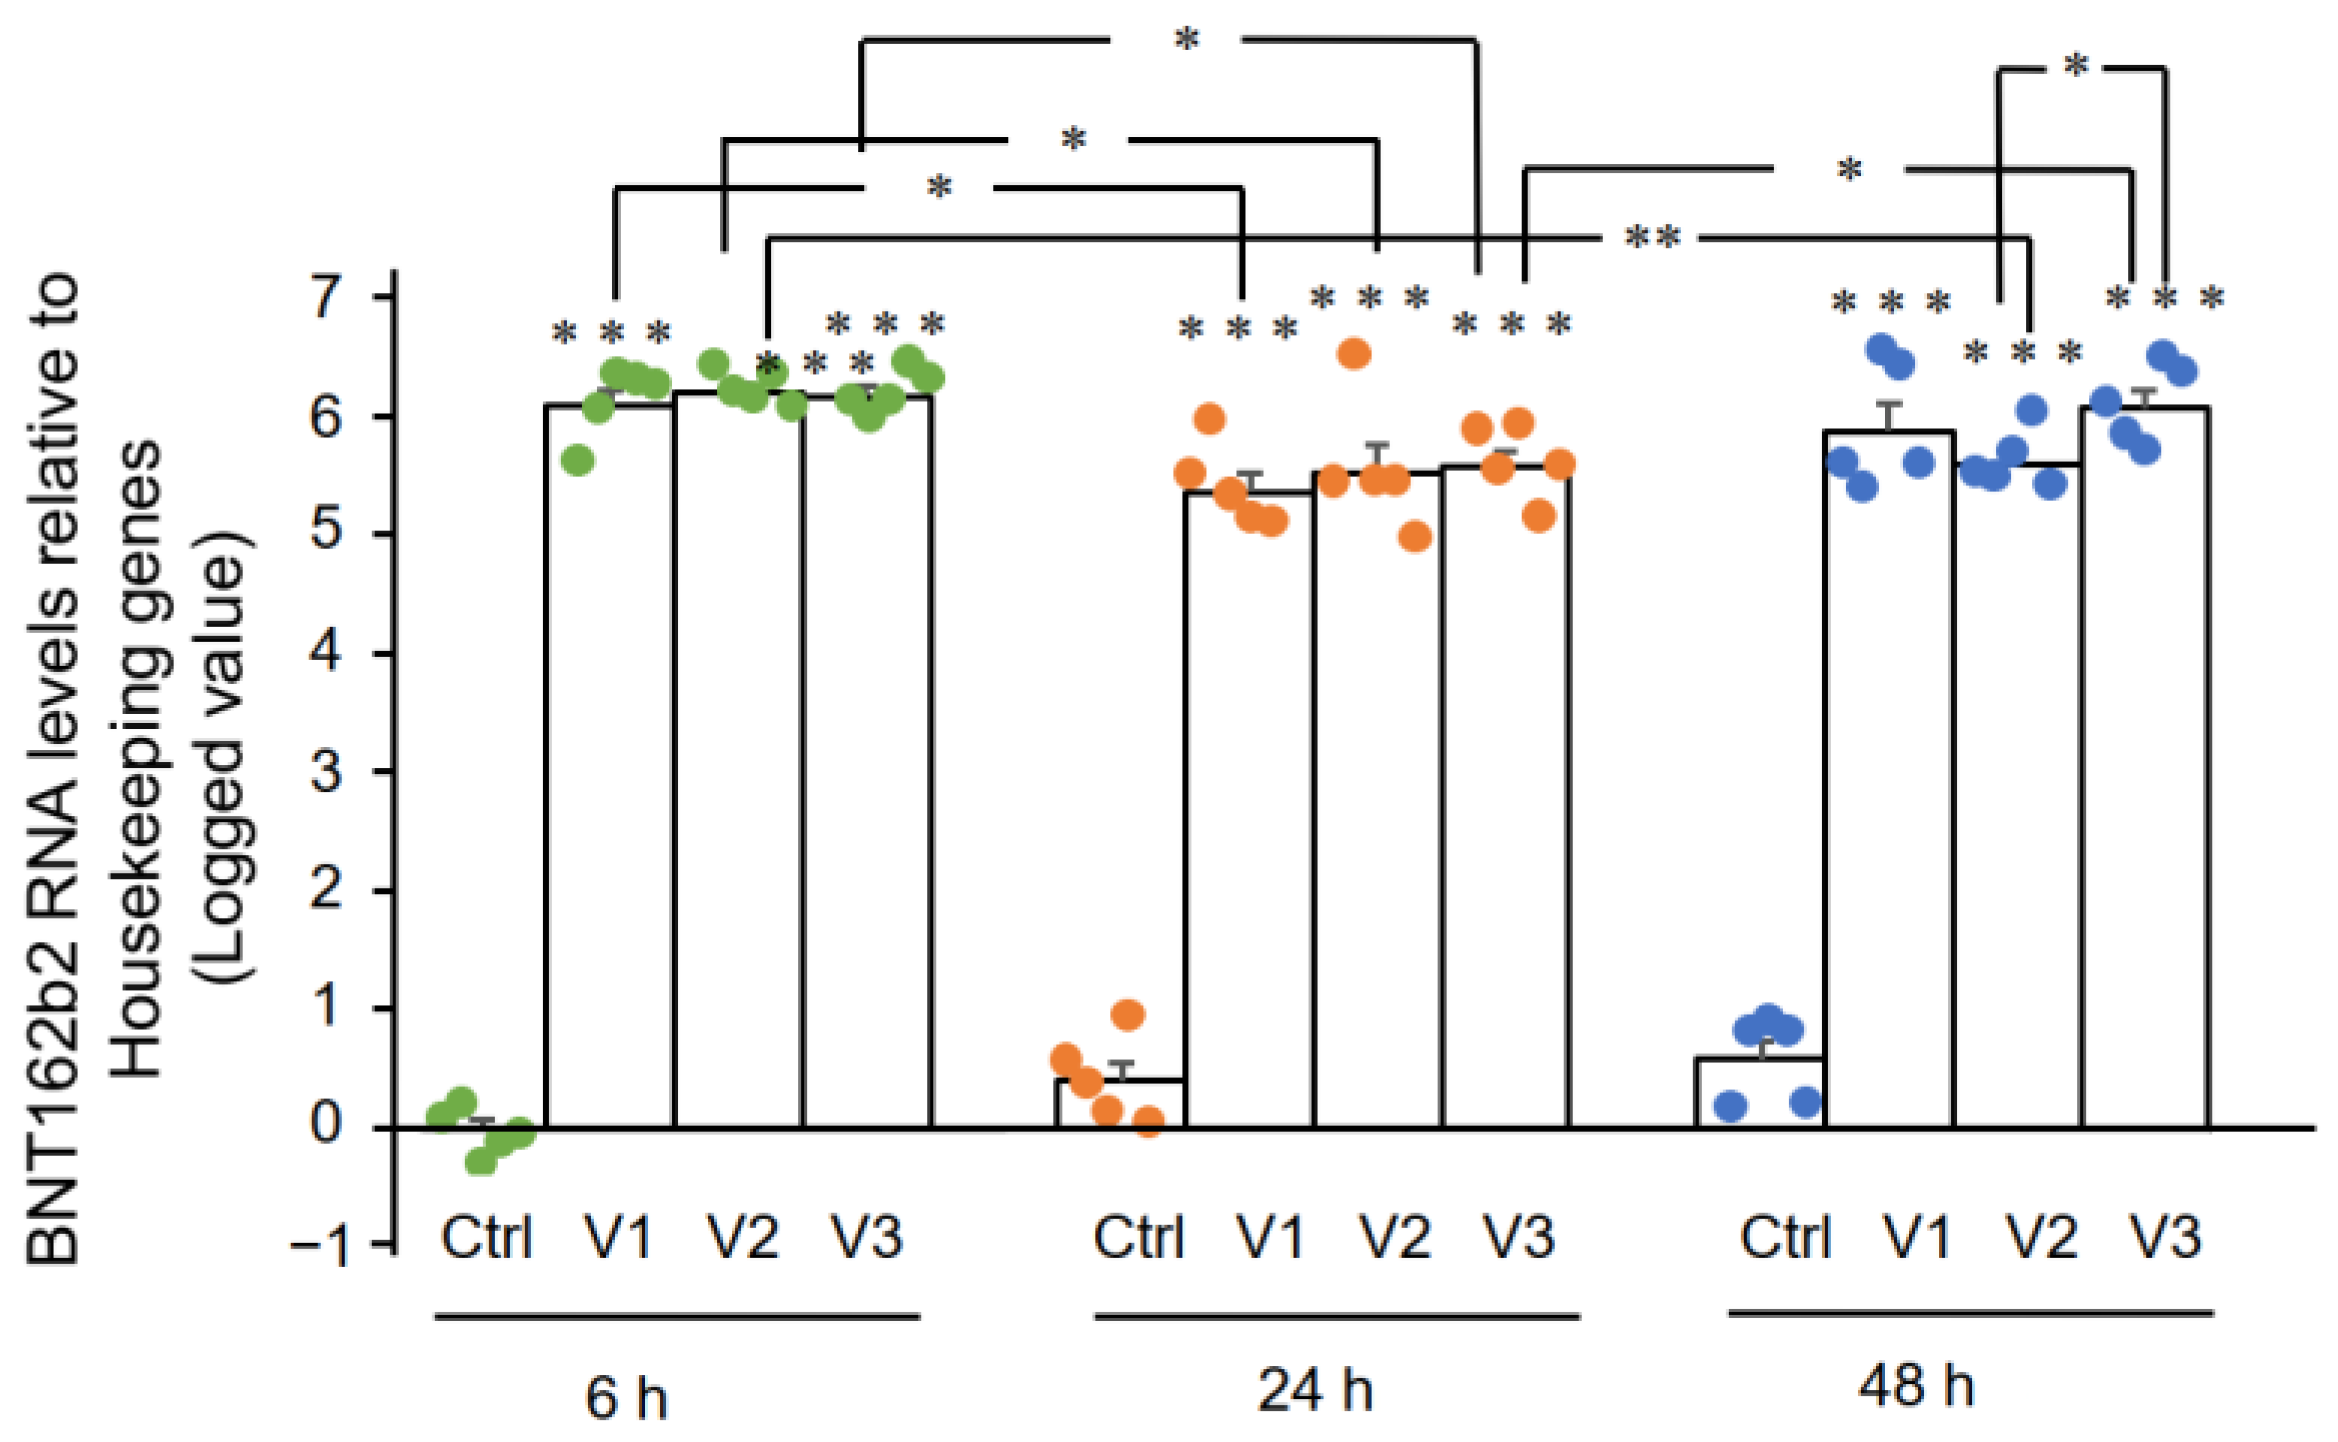
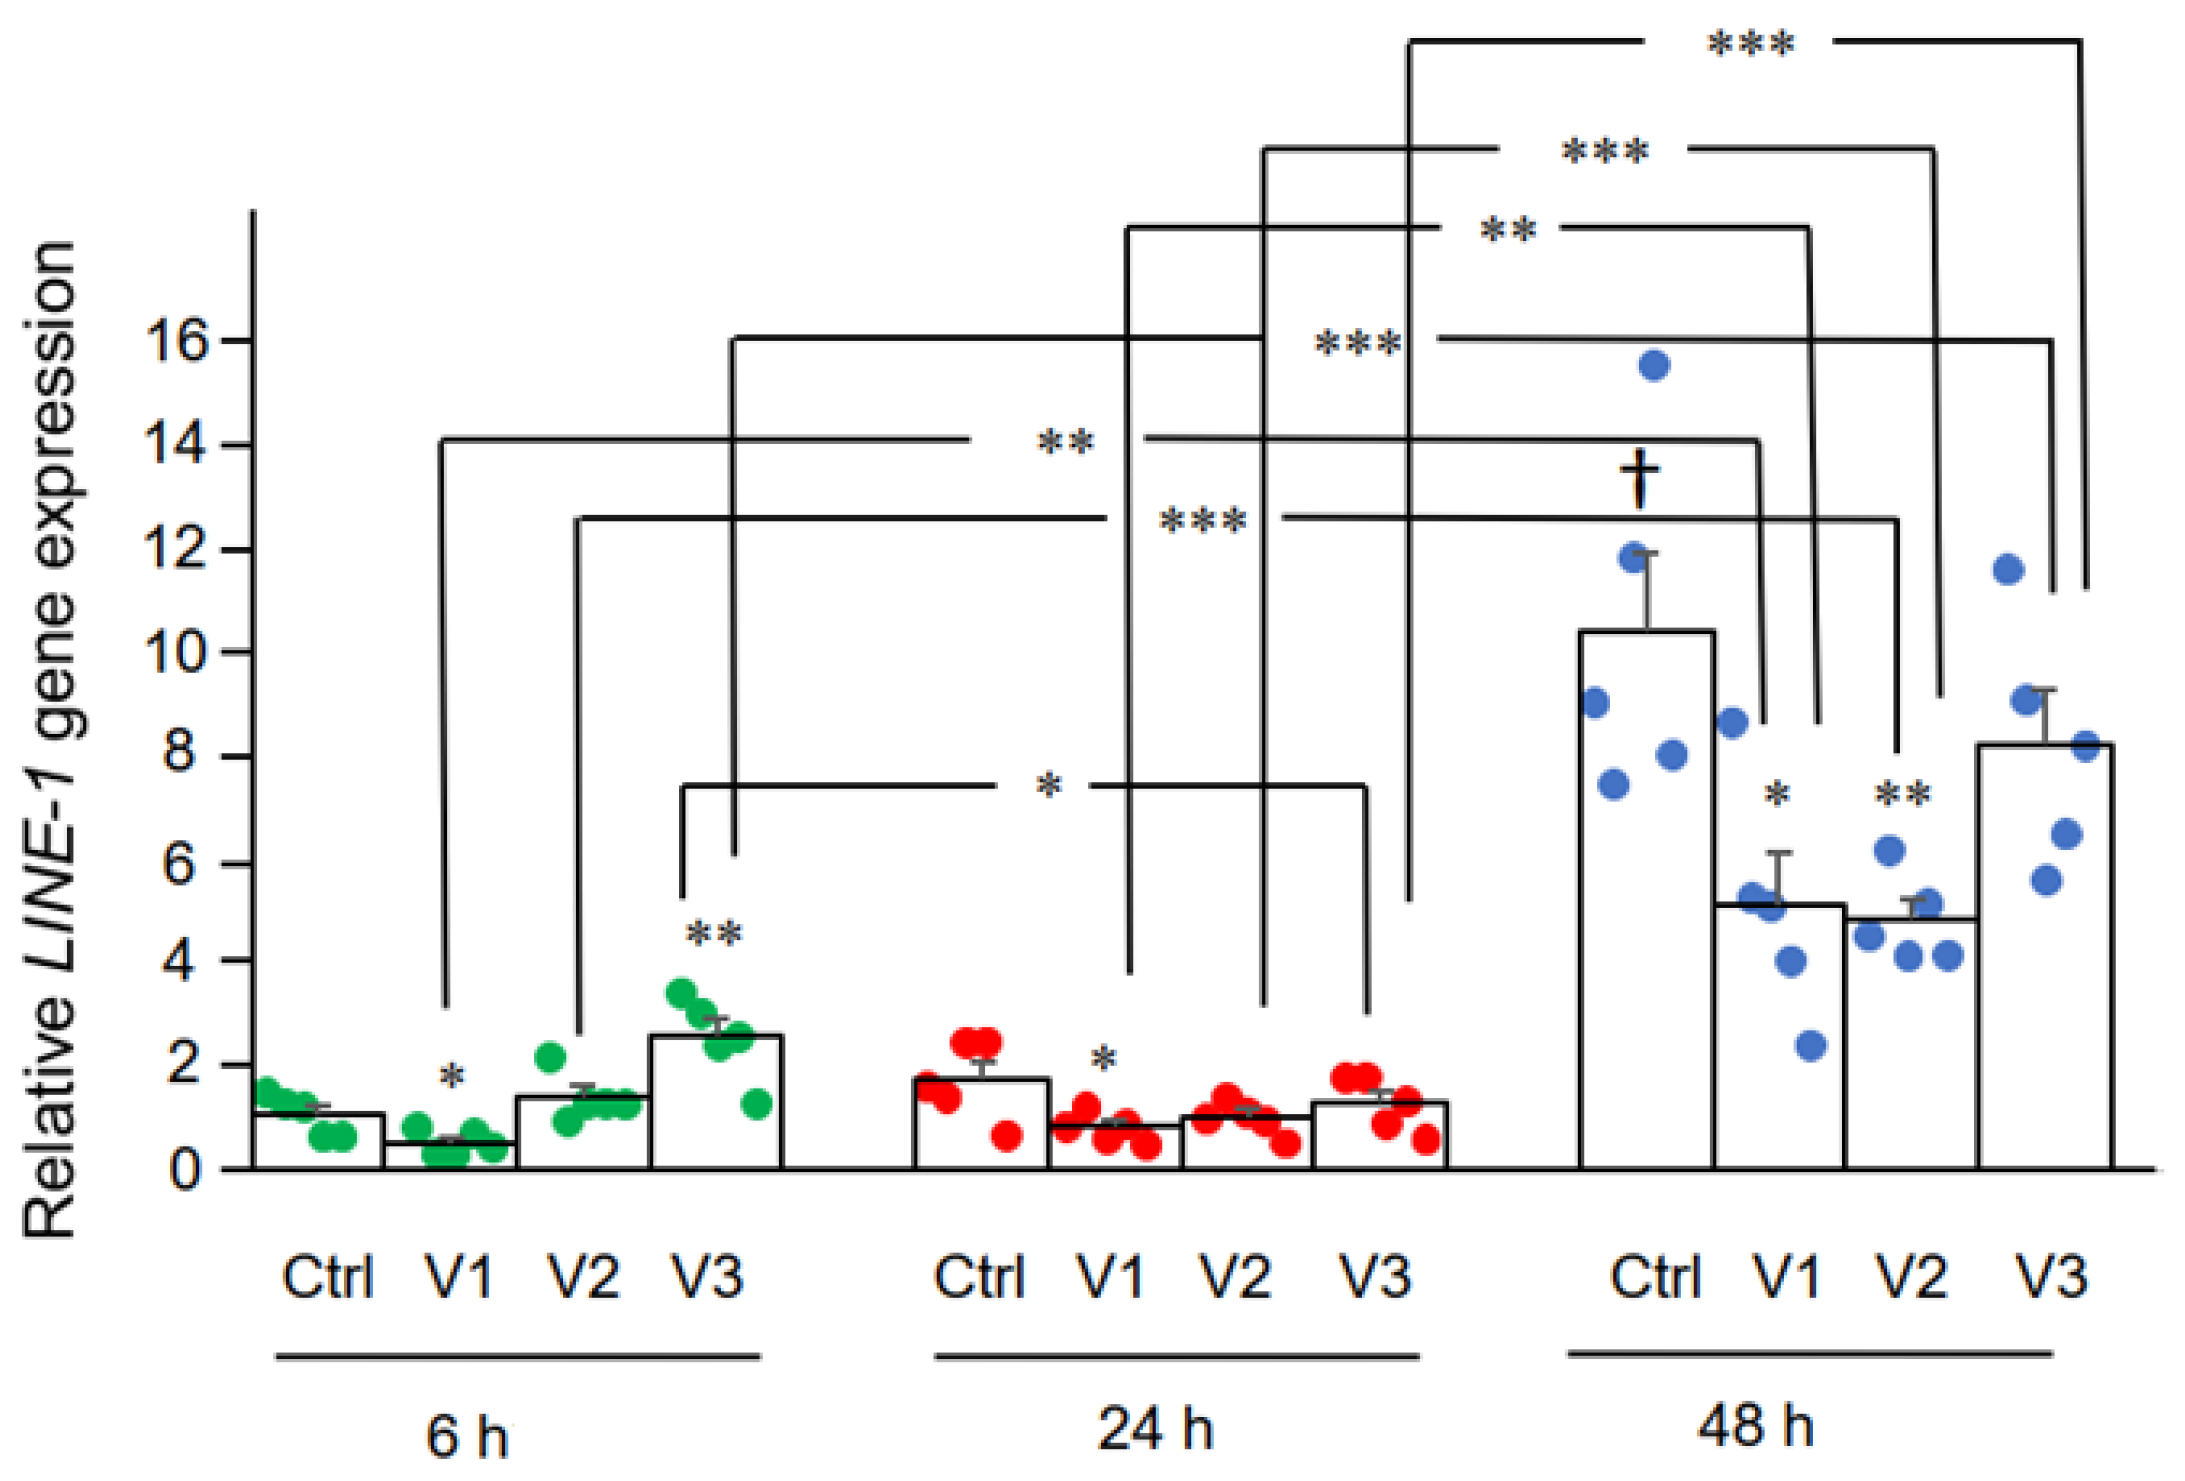
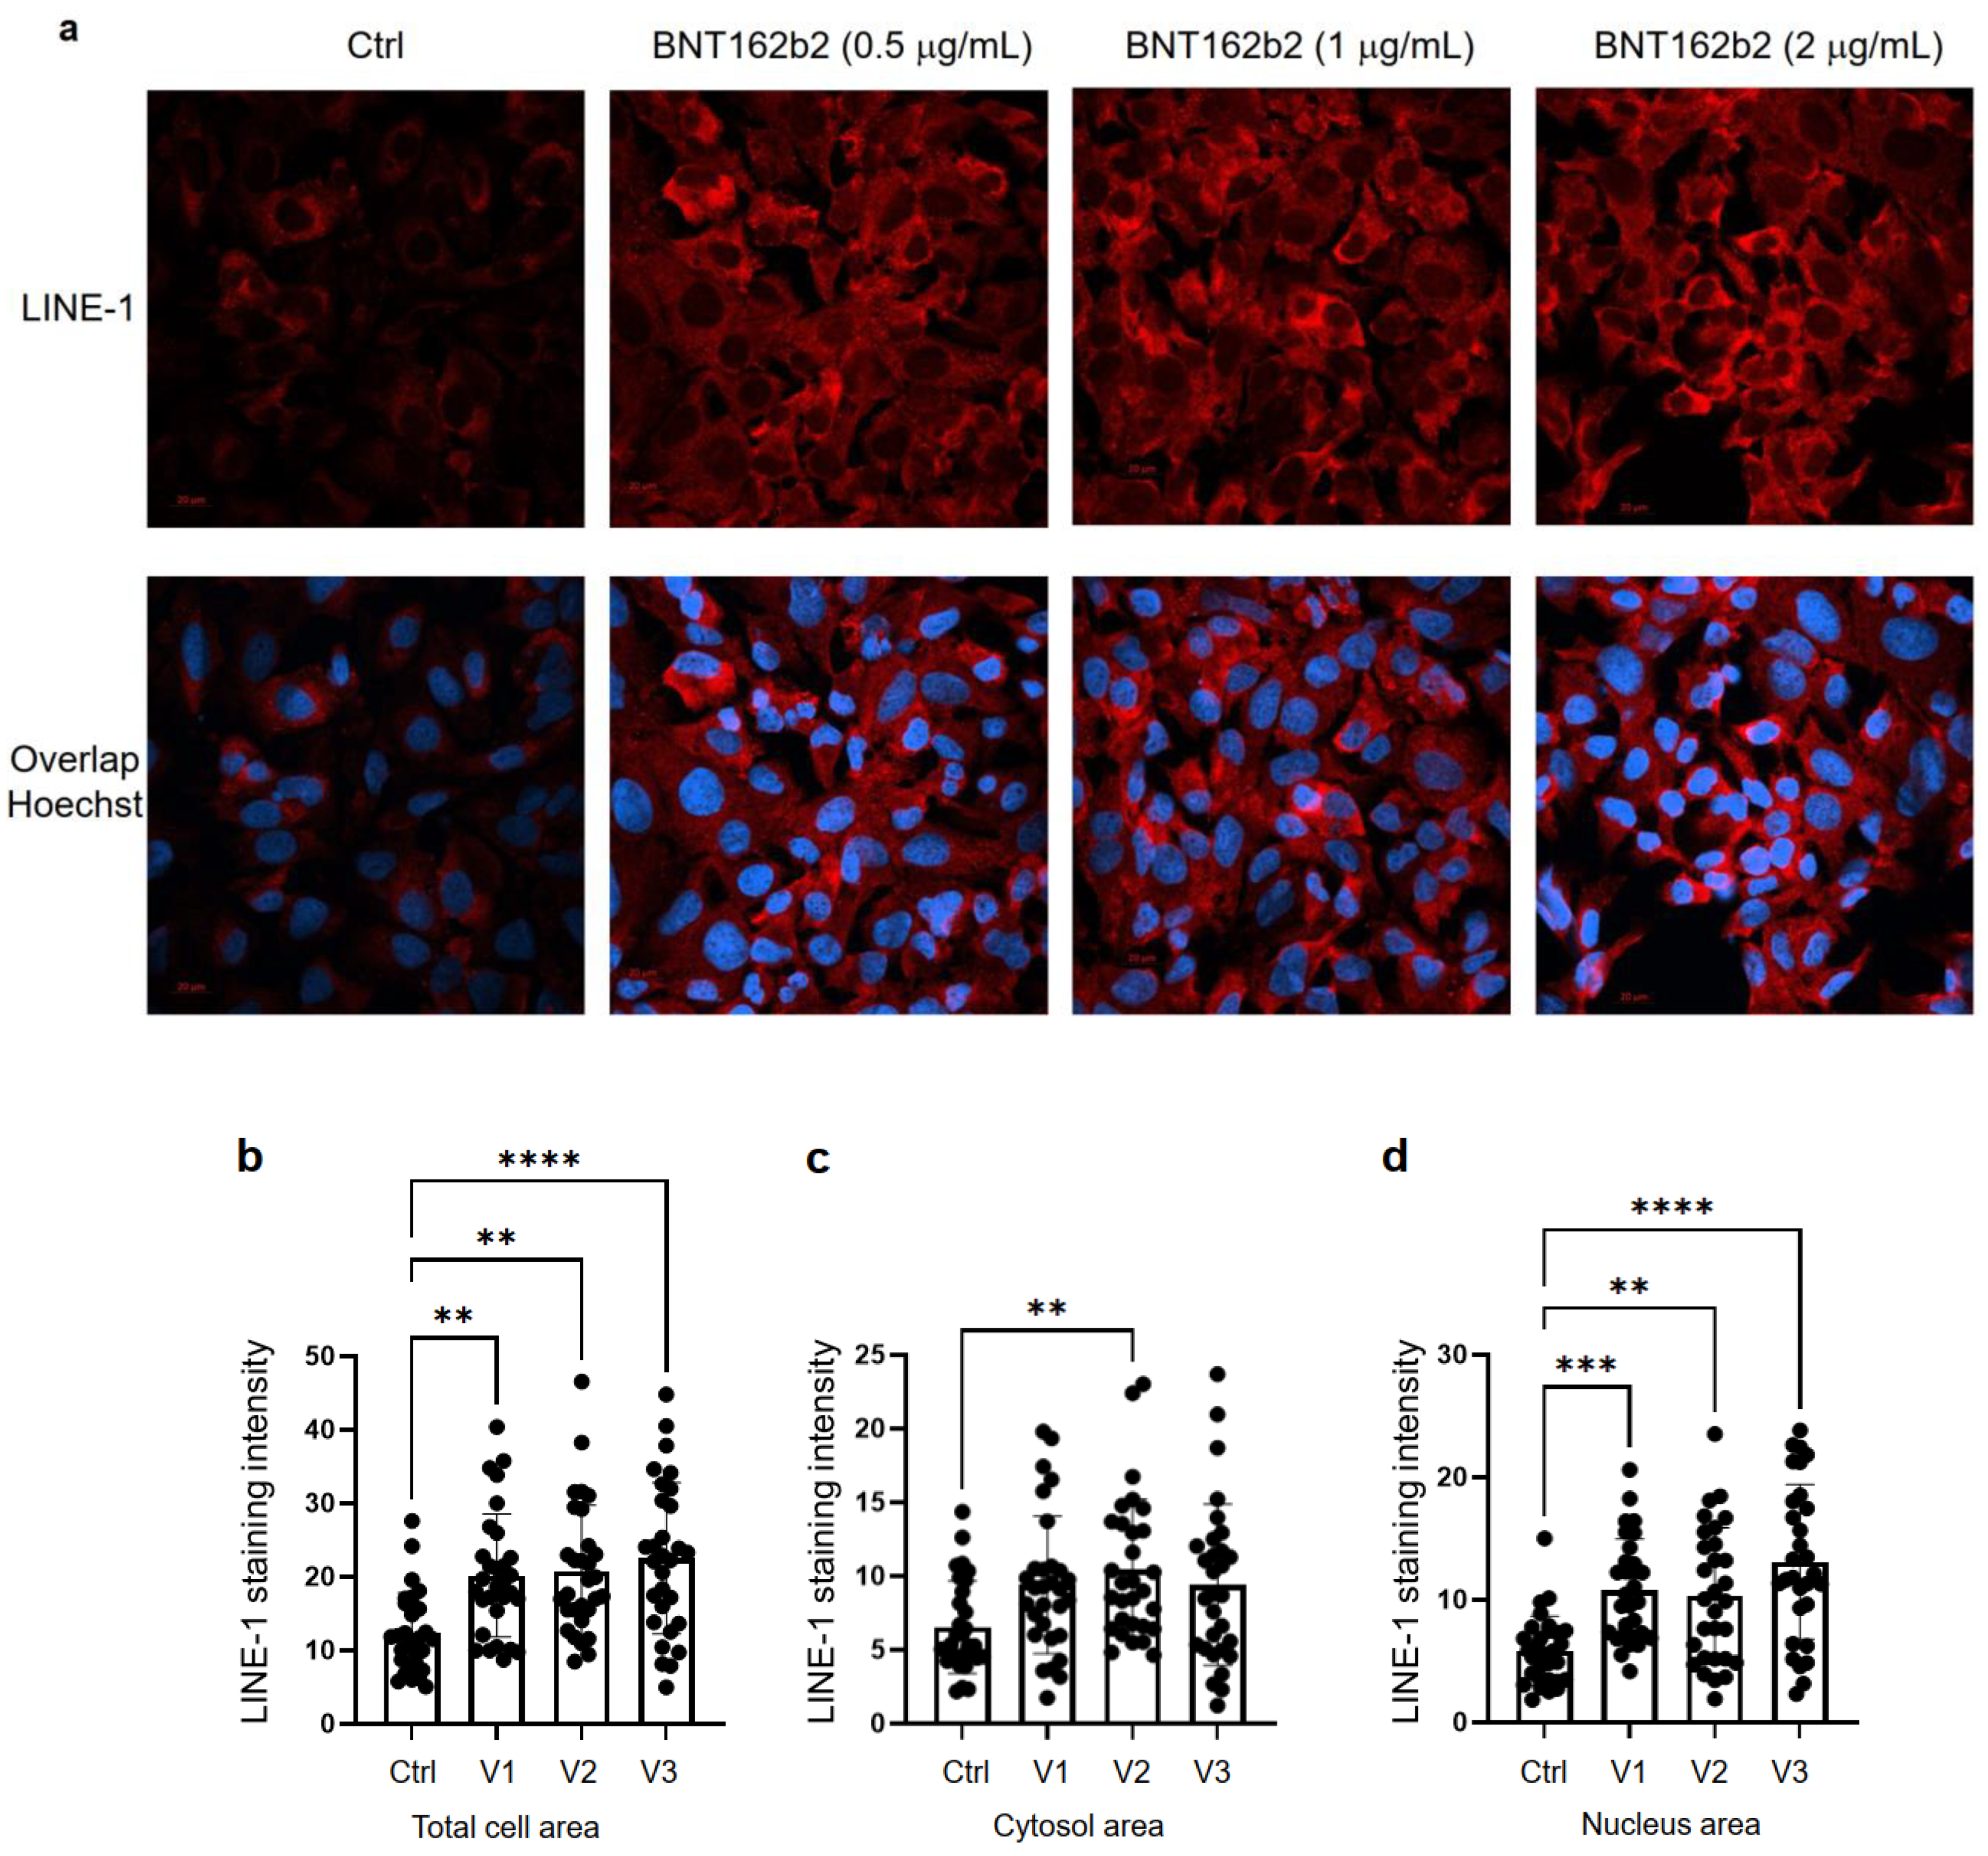
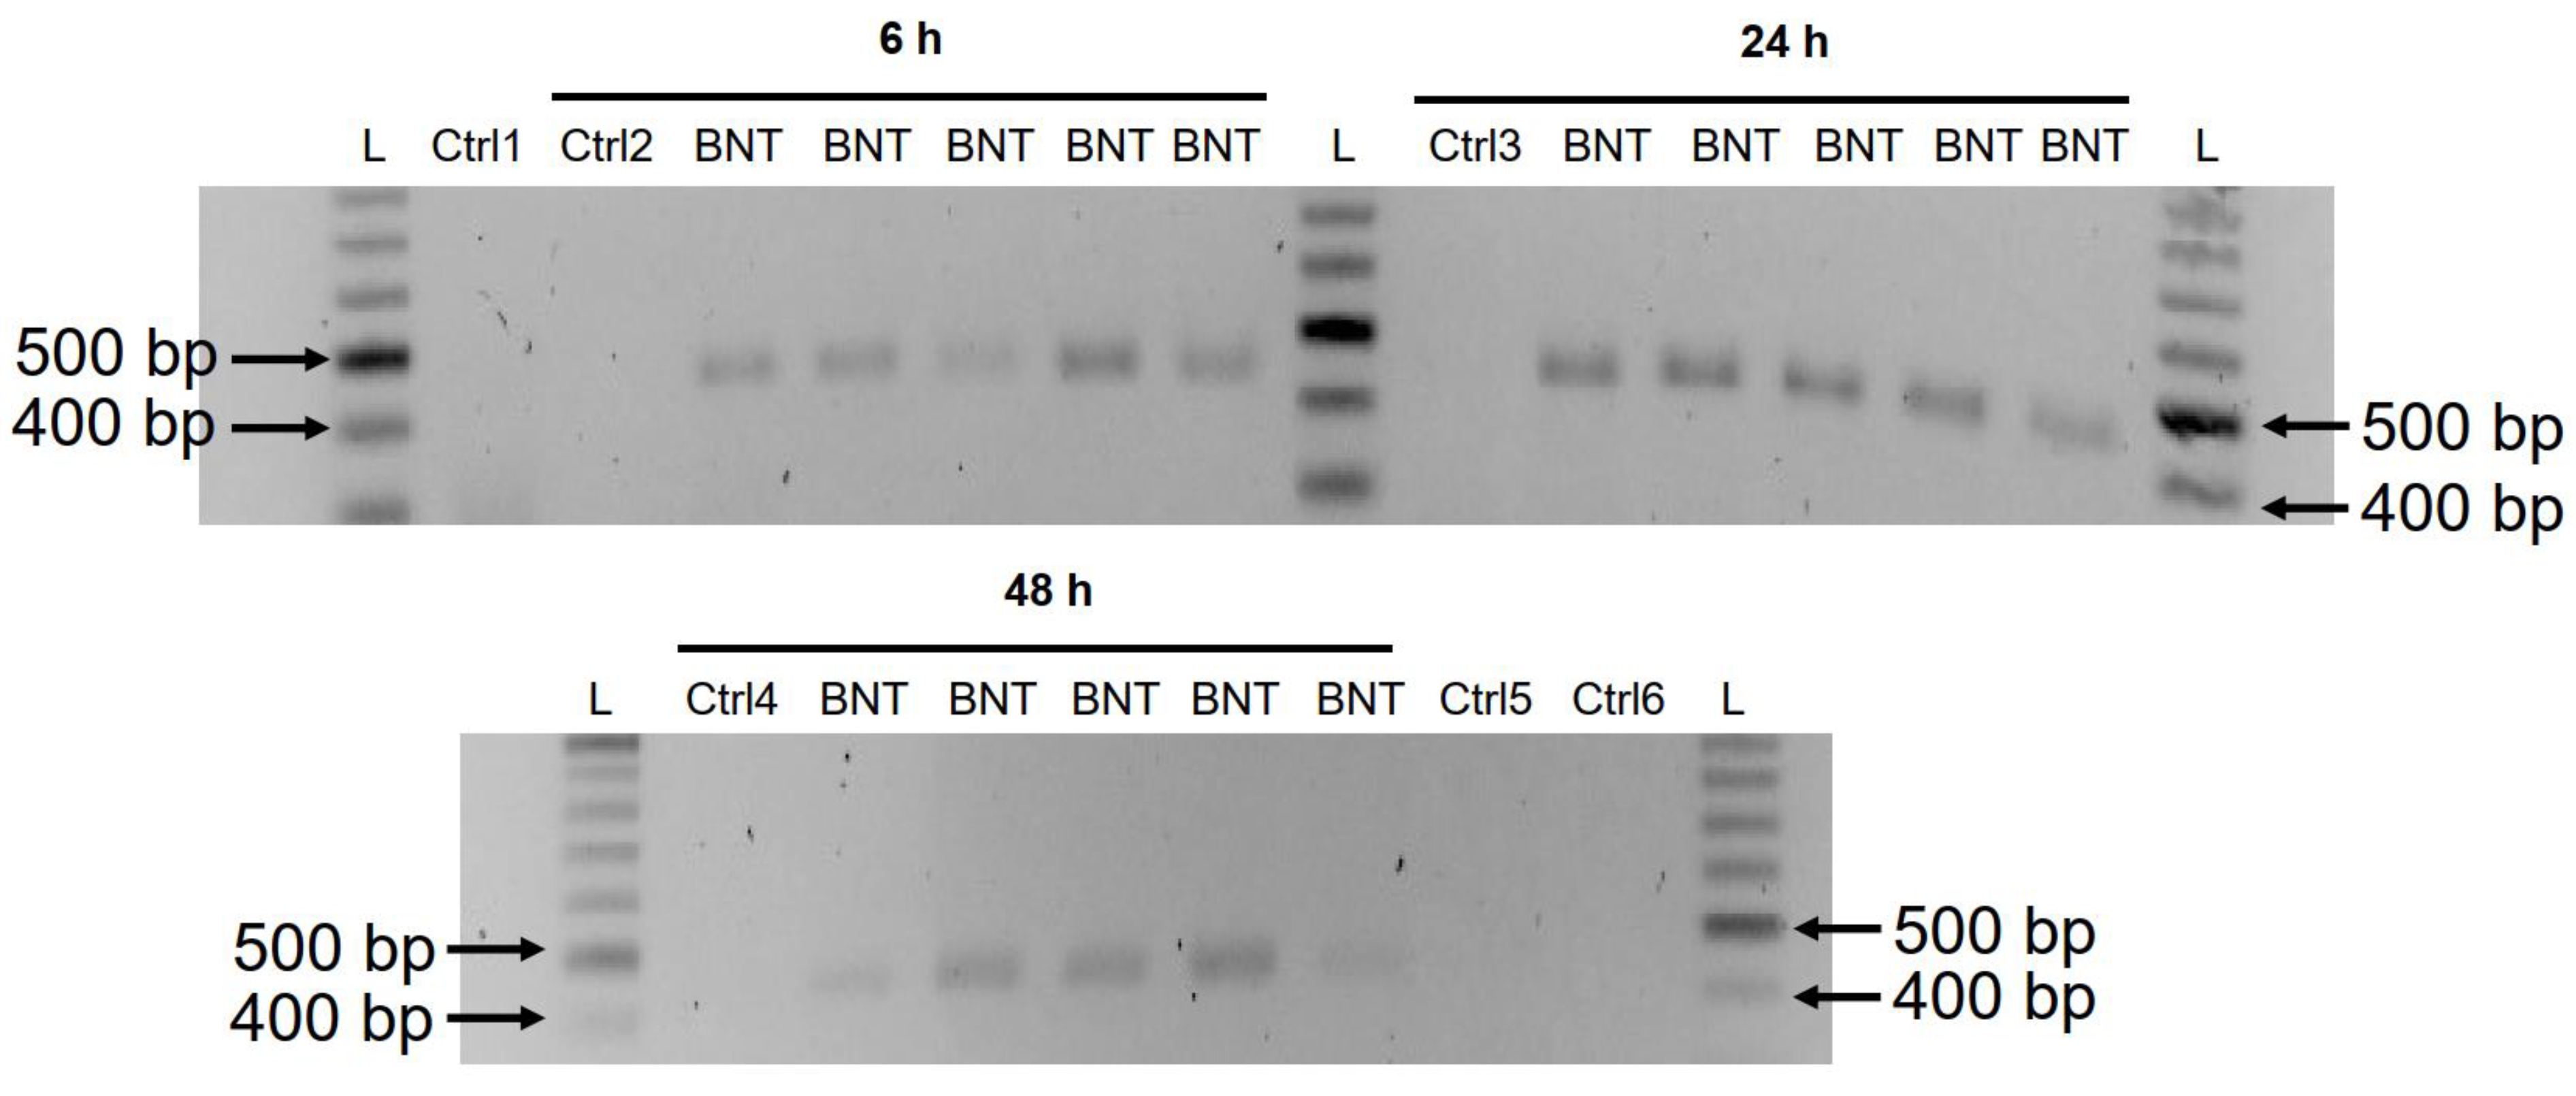