Business
Visualizing the World’s Top Social Media and Messaging Apps
View the high-resolution version of this infographic.


The Social Media Universe in 2022
For a time, life in the social media universe was mostly uneventful. Consider these spicy (at the time) headlines:
- Even President Obama Thinks That Facebook Isn’t Cool Anymore (Techcrunch, 2014)
- Jack Dorsey Returns to Twitter as Chief, to Shrugs and Quips (New York Times, 2015)
- Instagram’s new stories are a near-perfect copy of Snapchat (Mashable, 2016)
In hindsight, the years leading up to 2016 were downright sleepy in comparison with what would follow. Donald Trump’s meteoric, tweet-powered rise to the presidency. The Cambridge Analytica scandal. Congressional hearings on privacy and bias. TikTok at the center of souring U.S.–China relations. Each new day brought a fresh wave of controversy the shores of once infallible social media platforms.
Today, the honeymoon phase is long over and the messiness of running a global social platform is now on full display. Nowhere is this more evident than Twitter during the current Elon Musk transitional period—but more details on that later.
For now, let’s explore the social media universe in 2022.
Mapping the Social Media and Messaging Universe
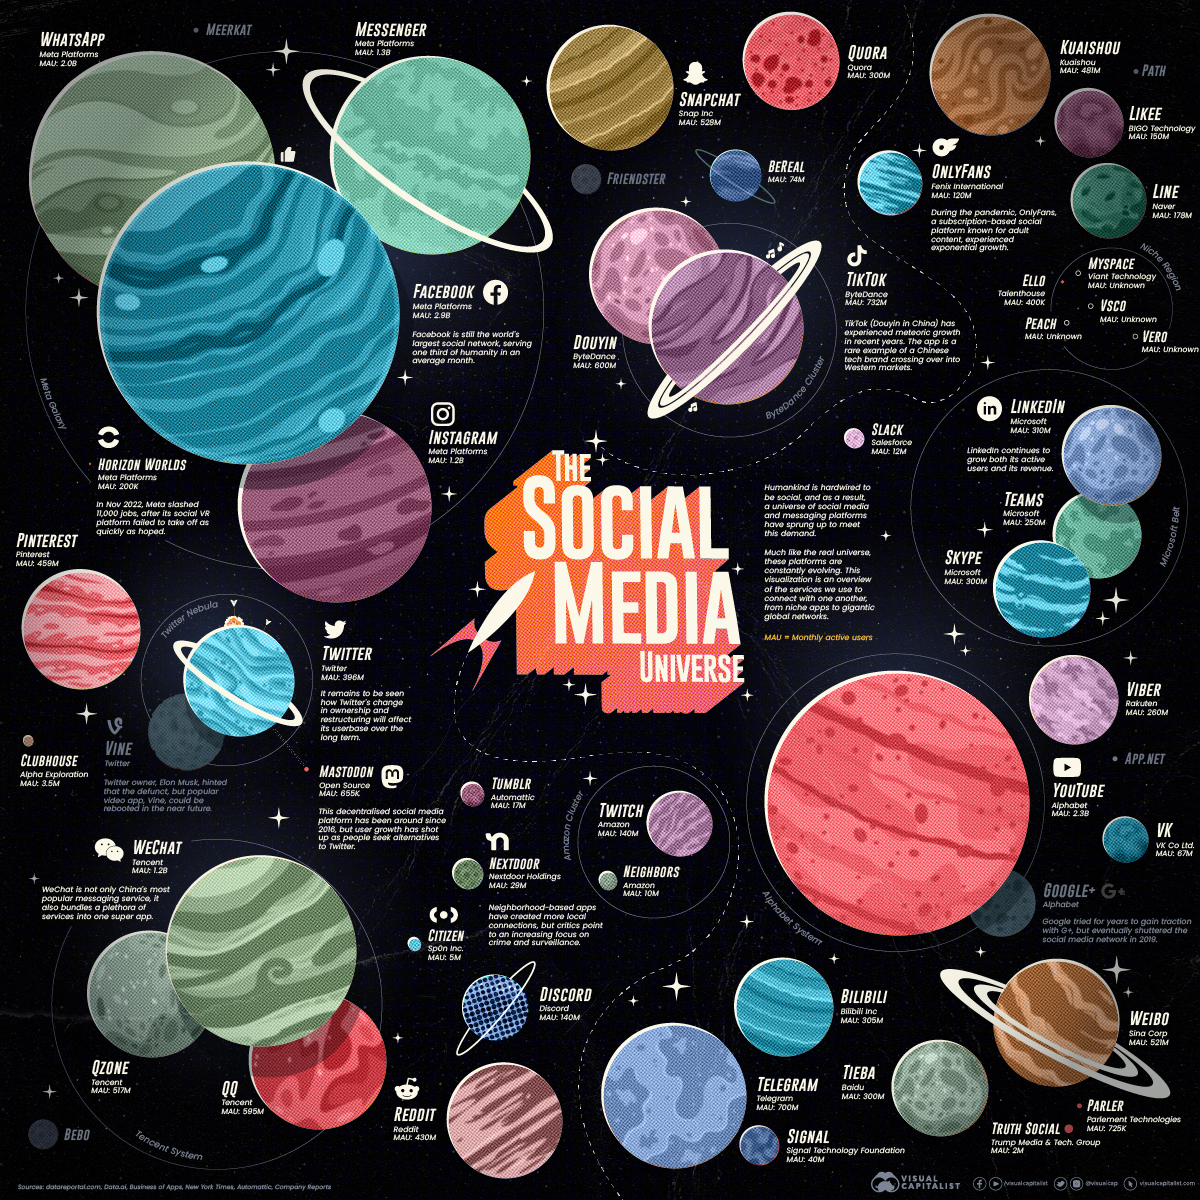
In 2022, the social universe is looking more crowded than in previous years.
The scale of Meta’s platforms still dominate thanks to their global reach, but there are a number of smaller networks fighting for market share. Here’s a look at popular platforms, organized from largest to smallest active userbase:

Meanwhile, here are the top 10 social media and messaging platforms by publicly-available monthly active users:
| Rank | Platform Name | Parent Company | Primary Function | Monthly Active Users |
|---|---|---|---|---|
| #1 | Meta Platforms | Social network | 2.9 billion | |
| #2 | YouTube | Alphabet | Video content | 2.3 billion |
| #3 | Meta Platforms | Messaging | 2.0 billion | |
| #4 | Messenger | Meta Platforms | Messaging | 1.3 billion |
| #5 | Meta Platforms | Video content | 1.2 billion | |
| #6 | Tencent | Messaging | 1.2 billion | |
| #7 | TikTok | ByteDance | Video content | 732 million |
| #8 | Telegram | n/a | Messaging | 700 million |
| #9 | Douyin | ByteDance | Video content | 600 million |
| #10 | Tencent | Messaging | 595 million |
YouTube is the only true competition for Meta’s scale and reach. Alphabet’s video content hub with social features boasts more than two billion monthly active users. YouTube’s embrace of the creator economy is nudging the platform further into pure social media territory with the introduction of “handles”.
As seen in the visualization above, China has its own ecosystem of large social and messaging platforms—the largest of these being WeChat.
The only platform in the top 20 that is not based in either the U.S. or China is the privacy-focused messaging app, Telegram. The Dubai-based company has a unique backstory. It was created after the founders of Russian social network VK left the country after resisting government pressure to release data on the social network’s users in Ukraine.
Today, there are also a number of smaller, special interest platforms. OnlyFans, for example, is focused on adult content creators. Parler and Truth Social appeal to users who want fewer constraints on the content they post and consume. BeReal aims to create more authentic moments by prompting users to post a photo at a random time each day.
Below, we dig into a few of these platforms into more depth.

Big Trouble in Little Metaverse
Having a figurehead CEO is a double-edged sword. When things are going well, the market rallies around the successful leader. Case in point, Mark Zuckerberg was named Time’s Person of the Year in 2010. Even as recently as 2016, Glassdoor named the Facebook founder the “most admired tech CEO”.
On the flip side, when the tide turns, it turns fast. After a series of controversies, Zuckerberg took a multi-billion-dollar gamble by renaming his entire company Meta and pivoting its focus to the burgeoning idea of a metaverse. Meta’s New Horizons platform is rumored to have plateaued at about 200,000 active users, which is underwhelming for a company that still reaches a sizable slice of humanity with its other services.
Part of Meta’s near-term success hinges on VR headsets being a hot gift this holiday season. Meta’s cheapest headset is $400, which could be a tough sell in today’s economic environment.
Of course, it’s too early to know whether Zuckerberg’s gamble will pay off. As always, all is forgiven once a business unit takes off and becomes profitable.

Microblogging with Macro Expectations
Twitter has a complicated history.
The company was launched in the shadow of Facebook’s massive growth, and was saddled with expectations that were tough to meet. Although Twitter has an engaged and influential audience, it hasn’t managed to monetize them at the level of Meta’s platforms (for better or worse). The introduction of Twitter Blue in 2021 did not resonate with users at the scale the company hoped, and “fleets” were essentially written off as a failed experiment.
In addition, Twitter is a magnet for criticism and debate around free speech, in part because of its central place in political discourse.
These issues are directly related to the company’s recent sale to Elon Musk. At the time of this article, Twitter finds itself in the midst of a painful, and very public, internal restructuring.
If reports of an exodus of talent and advertising dollars are to be believed, then the future of one of world’s most influential social media platforms could be at risk.

TikTok
Social media has always been dominated by Facebook and its related apps. When a new challenger came along, Facebook either acquired it (Instagram, WhatsApp), or “acquired” their features (Snapchat). TikTok is the first challenger to keep its momentum and growth, even as Instagram rolled out very similar features.
TikTok is also a rare case of a Chinese tech product crossing over into Western markets. The ascendancy of TikTok was not without controversy though. Suspicion over Chinese access to user data continues to be an issue both in the U.S., and in other large markets around the world. TikTok has been banned in India since 2020.
Despite these headwinds, TikTok remains wildly popular. The short-form video platform was the number one downloaded app on the planet, and it remains a favorite of the all-important Gen Z demographic.

We Shall Surveil
In recent years, neighborhood-based social networks have sprung up and gained traction. NextDoor used physical letters sent to adjacent addresses to supercharge its growth, while Neighbors piggybacked off the popularity of Ring’s doorbell cameras. Although members post about more benign topics such as lost cats and where to find a good plumber, crime is an increasingly common theme as well.
Apps like Neighbors and Citizen have a more overt focus on crime and safety. While the growth of these apps reflects an obvious interest preventing crime, critics point out that the ubiquity of personal surveillance equipment and forums built purely around public safety promote a culture of suspicion in communities.
This type of social network is still quite new, so it remains to be seen if they remain niche communities, or grow into something bigger.
Chaos and Opportunity
It was Sun Tzu who famously said, “In the midst of chaos, there is also opportunity”.
This is the risk and opportunity in the social media universe today. With their massive networks and high switching costs (e.g. personalization, library of existing posts), the largest platforms have created moats that make life hard for upstart brands looking to replace established platforms. On the other hand, controversy on platforms like Twitter and Facebook may cause some users to consider new options.
The multi-billion-dollar question—is dissatisfaction with major platforms temporary, or will emerging networks like Mastodon or BeReal hit critical mass and become new staples for people connecting online. Time will tell.


Real Estate
Charted: U.S. Median House Prices vs. Income
We chart the ever-widening gap between median incomes and the median price of houses in America, using data from the Federal Reserve from 1984 to 2022.
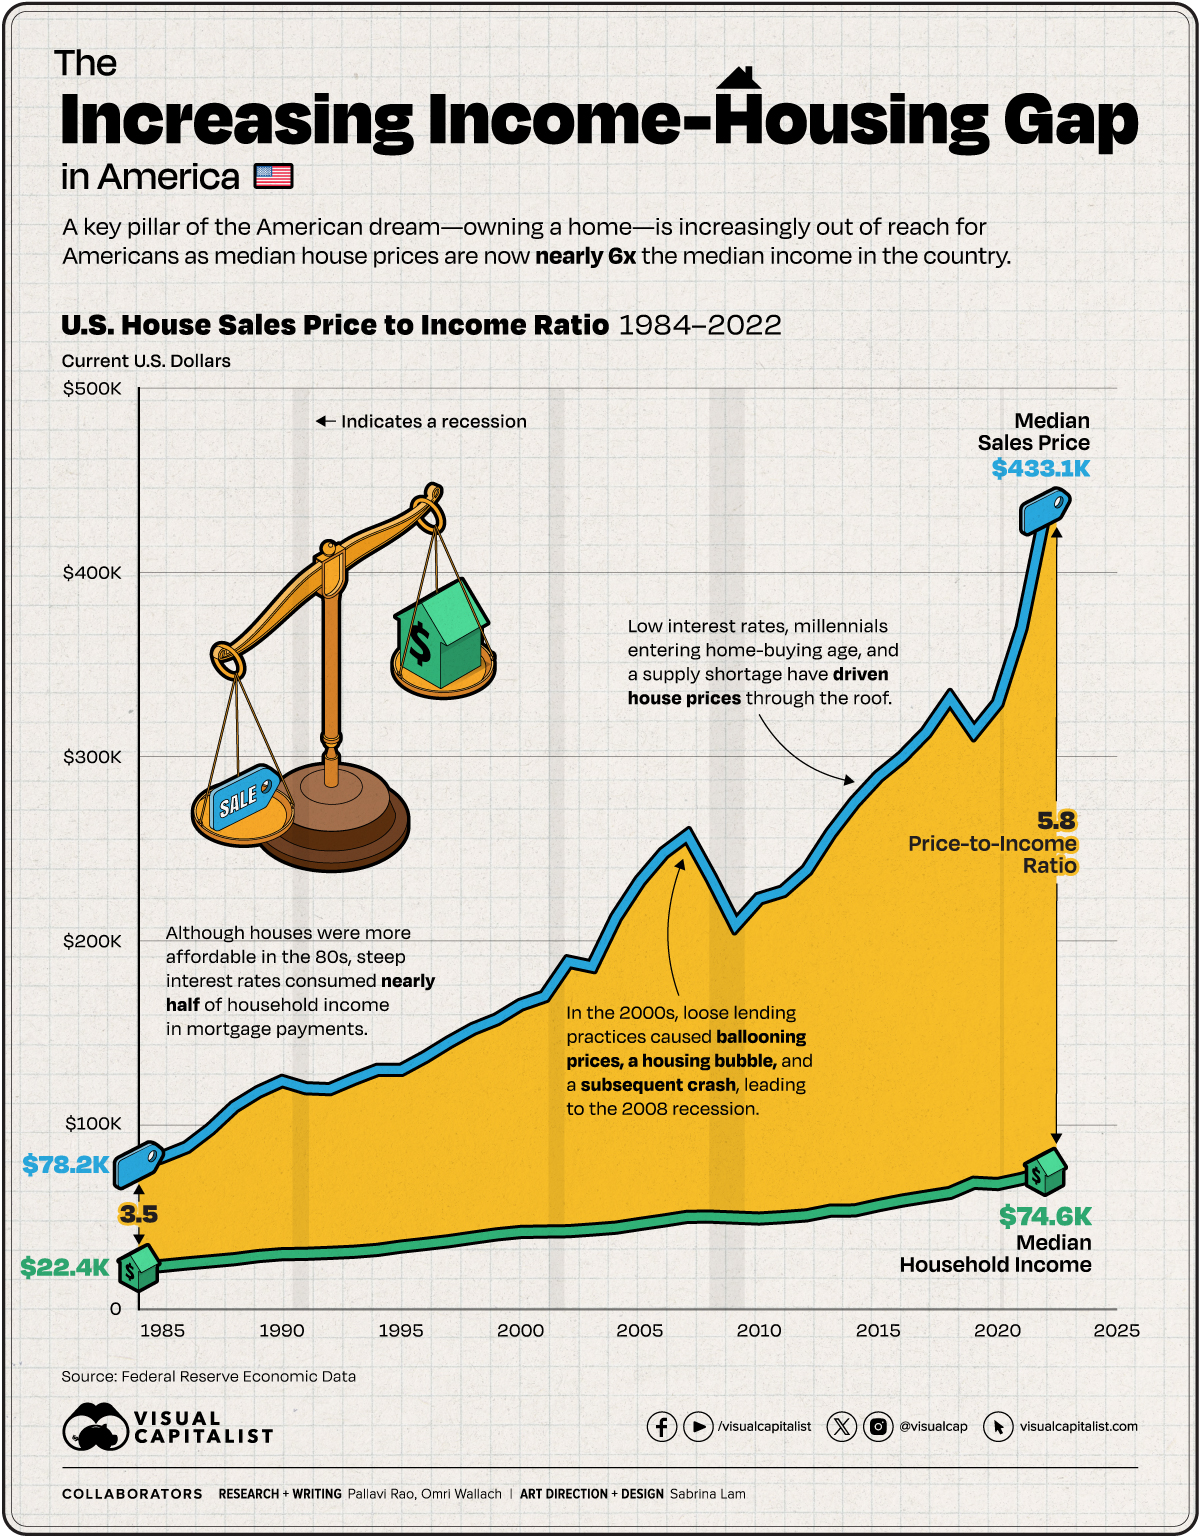

Houses in America Now Cost Six Times the Median Income
This was originally posted on our Voronoi app. Download the app for free on iOS or Android and discover incredible data-driven charts from a variety of trusted sources.
As of 2023, an American household hoping to buy a median-priced home, needs to make at least $100,000 a year. In some cities, they need to make nearly 3–4x that amount.
The median household income in the country is currently well below that $100,000 threshold. To look at the trends between median incomes and median house prices through the years, we charted their movement using the following datasets data from the Federal Reserve:
- Median household income (1984–2022).
- Median Sales Price of Houses Sold (1963–2023).
Importantly this graphic does not make allowances for actual household disposable income, nor how monthly mortgage payments change depending on the interest rates at the time. Finally, both datasets are in current U.S. dollars, meaning they are not adjusted for inflation.
Timeline: Median House Prices vs. Income in America
In 1984, the median annual income for an American household stood at $22,420, and the median house sales price for the first quarter of the year came in at $78,200. The house sales price-to-income ratio stood at 3.49.
By pure arithmetic, this is the most affordable houses have been in the U.S. since the Federal Reserve began tracking this data, as seen in the table below.
A hidden caveat of course, was inflation: running rampant towards the end of the 70s and the start of the 80s. While it fell significantly in the next five years, in 1984 the 30-year fixed rate was close to 14%, meaning a significant chunk of household income went to interest payments.
| Date | Median House Sales Price | Median Household Income | Price-to-Income Ratio |
|---|---|---|---|
| 1984-01-01 | $78,200 | $22,420 | 3.49 |
| 1985-01-01 | $82,800 | $23,620 | 3.51 |
| 1986-01-01 | $88,000 | $24,900 | 3.53 |
| 1987-01-01 | $97,900 | $26,060 | 3.76 |
| 1988-01-01 | $110,000 | $27,230 | 4.04 |
| 1989-01-01 | $118,000 | $28,910 | 4.08 |
| 1990-01-01 | $123,900 | $29,940 | 4.14 |
| 1991-01-01 | $120,000 | $30,130 | 3.98 |
| 1992-01-01 | $119,500 | $30,640 | 3.90 |
| 1993-01-01 | $125,000 | $31,240 | 4.00 |
| 1994-01-01 | $130,000 | $32,260 | 4.03 |
| 1995-01-01 | $130,000 | $34,080 | 3.81 |
| 1996-01-01 | $137,000 | $35,490 | 3.86 |
| 1997-01-01 | $145,000 | $37,010 | 3.92 |
| 1998-01-01 | $152,200 | $38,890 | 3.91 |
| 1999-01-01 | $157,400 | $40,700 | 3.87 |
| 2000-01-01 | $165,300 | $41,990 | 3.94 |
| 2001-01-01 | $169,800 | $42,230 | 4.02 |
| 2002-01-01 | $188,700 | $42,410 | 4.45 |
| 2003-01-01 | $186,000 | $43,320 | 4.29 |
| 2004-01-01 | $212,700 | $44,330 | 4.80 |
| 2005-01-01 | $232,500 | $46,330 | 5.02 |
| 2006-01-01 | $247,700 | $48,200 | 5.14 |
| 2007-01-01 | $257,400 | $50,230 | 5.12 |
| 2008-01-01 | $233,900 | $50,300 | 4.65 |
| 2009-01-01 | $208,400 | $49,780 | 4.19 |
| 2010-01-01 | $222,900 | $49,280 | 4.52 |
| 2011-01-01 | $226,900 | $50,050 | 4.53 |
| 2012-01-01 | $238,400 | $51,020 | 4.67 |
| 2013-01-01 | $258,400 | $53,590 | 4.82 |
| 2014-01-01 | $275,200 | $53,660 | 5.13 |
| 2015-01-01 | $289,200 | $56,520 | 5.12 |
| 2016-01-01 | $299,800 | $59,040 | 5.08 |
| 2017-01-01 | $313,100 | $61,140 | 5.12 |
| 2018-01-01 | $331,800 | $63,180 | 5.25 |
| 2019-01-01 | $313,000 | $68,700 | 4.56 |
| 2020-01-01 | $329,000 | $68,010 | 4.84 |
| 2021-01-01 | $369,800 | $70,780 | 5.22 |
| 2022-01-01 | $433,100 | $74,580 | 5.81 |
Note: The median house sale price listed in this table and in the chart is from the first quarter of each year. As a result the ratio can vary between quarters of each year.
The mid-2000s witnessed an explosive surge in home prices, eventually culminating in a housing bubble and subsequent crash—an influential factor in the 2008 recession. Subprime mortgages played a pivotal role in this scenario, as they were issued to buyers with poor credit and then bundled into seemingly more attractive securities for financial institutions. However, these loans eventually faltered as economic circumstances changed.
In response to the recession and to stimulate economic demand, the Federal Reserve reduced interest rates, consequently lowering mortgage rates.
While this measure aimed to make homeownership more accessible, it also contributed to a significant increase in housing prices in the following years. Additionally, a new generation entering the home-buying market heightened demand. Simultaneously, a scarcity of new construction and a surge in investors and corporations converting housing units into rental properties led to a shortage in supply, exerting upward pressure on prices.
As a result, median house prices are now nearly 6x the median household income in America.
How Does Unaffordable Housing Affect the U.S. Economy?
When housing costs exceed a significant portion of household income, families are forced to cut back on other essential expenditures, dampening consumer spending. Given how expanding housing supply helped drive U.S. economic growth in the 20th century, the current constraints in the country are especially ironic.
Unaffordable housing also stifles mobility, as individuals may be reluctant to relocate for better job opportunities due to housing constraints. On the flip side, many cities are seeing severe labor shortages as many lower-wage workers simply cannot afford to live in the city. Both phenomena affect market efficiency and productivity growth.

-

 Markets7 days ago
The Best Performing Japanese Stocks (1-Year Returns)
-

 Money2 weeks ago
Mapped: Where Do the Wealthiest People in the World Live?
-

 Travel2 weeks ago
Ranked: Global Airlines with the Most Plane Crashes
-

 Technology1 week ago
Visualizing iPhone 15 Production by Manufacturer in 2023
-

 Automotive1 week ago
Visualizing Global Electric Vehicle Sales in 2023, by Market Share
-

 Demographics1 week ago
Mapped: Population Growth by Region (1900-2050F)
-
 Banks1 week ago
Visualizing Major U.S. Banks by Commercial Real Estate Exposure
-

 Technology1 week ago
Ranked: The Largest Bitcoin ETFs in the U.S.