


For some, dying means turning into worm food. For others, it’s a transition into the afterlife. Either way, death–especially mass death–can captivate national attention, shape histories, and generate new mythologies for the living.
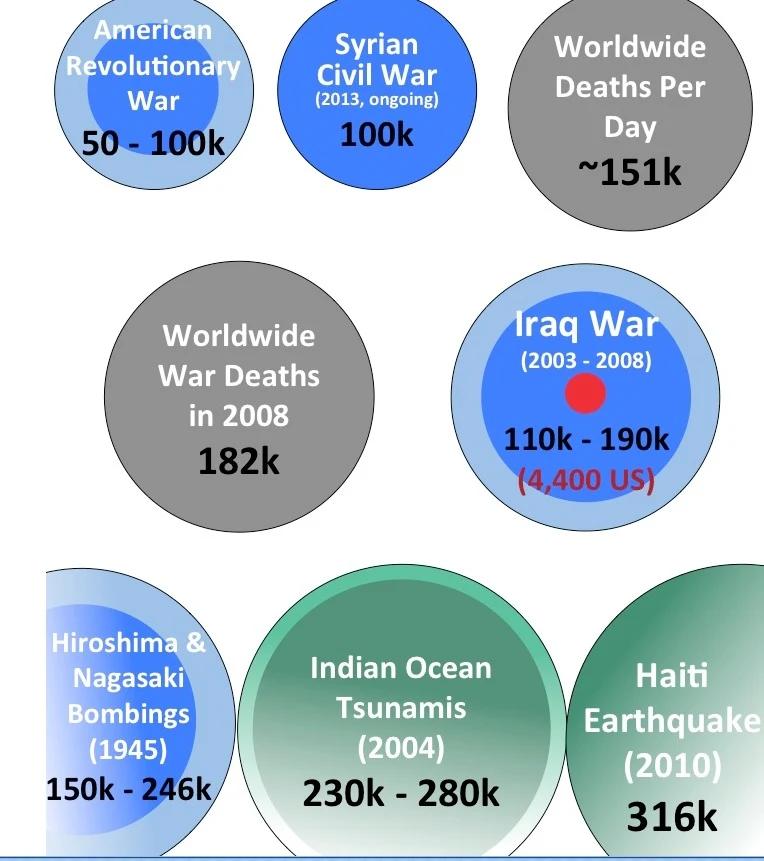
But how often do we look at the numbers outside the narratives? At what point does the size of the collective emotional impact match up or separate from the size of the death toll? Would it surprise you to learn that the 2010 Haitian earthquake killed 316,000 people, while the 2011 tsunami in Japan took 20,000 lives? What about the fact that there are some 31,000 annual gun deaths in the United States–more than 10 times the number of people who died in the 9/11 terrorist attacks?
This infographic from Wait But Why (where the graphic is most easily read in its original form) lays out the death tolls of major disasters, plagues, shootings, and wars in a strikingly simple format. Circles represent the amount of people killed, and where historians disagree, there are concentric versions of multiple estimates. Some academics, for example, put the total number of Aztec sacrifices between the 14th and 16th centuries at 300,000, while others estimate 1.5 million. You can see examples of these differences here:

Death tolls presented in this format could create seismic arguments over which tragedies we should remember most as time wears on. (If the human brain is only capable of maintaining 150 stable relationships, as anthropologist Robin Dunbar discovered in 1992, there’s probably a limit to how much death we can consider, too.) But leaving prescriptions aside and looking at the raw numbers for different events, especially as they scale up to the thousands, then hundreds of thousands, then millions, is a shock in itself.
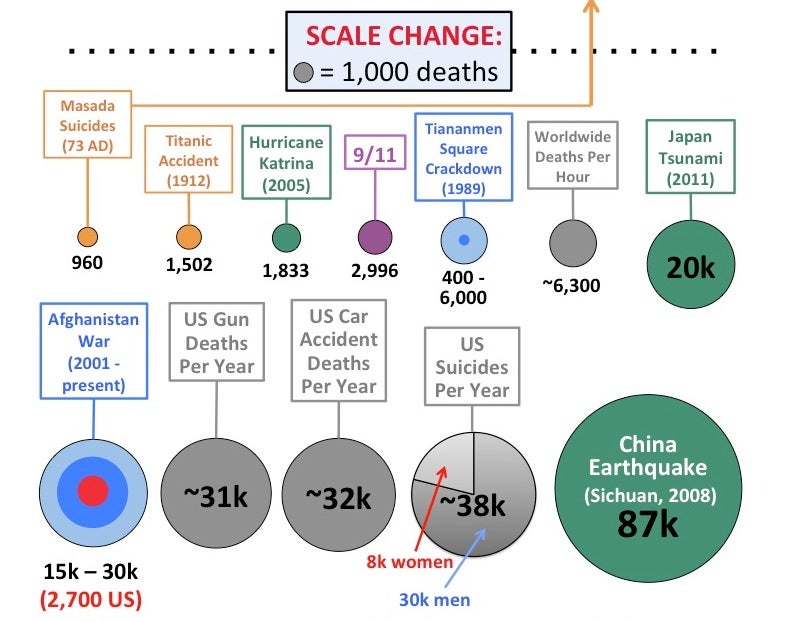
The number of people killed in the ongoing violence in Syria surpasses the number of soldiers and civilians killed in the war in Afghanistan by more than a factor of three. Meanwhile, 38,000 people commit suicide in the U.S. every year–more than 20 times the number of people who died in Hurricane Katrina. It’s also surprising to line up the impact of environmental disasters next to wars and atomic bombs: Both the Haitian earthquake and 2004 Indian Ocean tsunami death tolls were larger than the impact of Hiroshima and Nagasaki (together), and each had two to three times the body count of the American Revolutionary War.
“I’ve always been interested in the fact that some people don’t know which tragedies were 100 times more tragic,” the site’s creator (who wished to remain anonymous) tells Co.Exist. “Some people have no conception, or have any idea that the Haiti earthquake killed 100 times more people than 9/11.”

The top three largest death tolls come down to the Black Plague (75 million to 200 million), the Mao Era in China (49 million to 78 million), and World War II (40 million to 72 million).
Kudos to Wait But Why for this data scraping feat. Still, I wonder what other death tolls could be added to the chart. How many women die in childbirth a year? How many people die in U.S prisons? How many U.S veterans commit suicide each day? To be continued, perhaps.
Recognize your brand’s excellence by applying to this year’s Brands That Matter Awards before the early-rate deadline, May 3.
