List of cities in Australia by population
Last updated
9. Sunshine Coast (397k)
10. Central Coast (345k)
11. Wollongong (303k)
17. Toowoomba (147k)
18. Ballarat (114k)
19. Bendigo (104k)
20. Albury–Wodonga (99k)
These lists of Australian cities by population provide rankings of Australian cities and towns according to various systems defined by the Australian Bureau of Statistics.
Contents
- Greater capital city statistical areas by population
- Significant urban areas by population
- 50 largest urban centres by population
- List of local government areas by population
- Definitions
- See also
- References
- External links
The eight Greater Capital City Statistical Areas are listed for the state and territory capital cities. All Significant Urban Areas (SUA), representing urban agglomerations of over 10,000 population, are listed next. The fifty largest Urban Centres (built-up area) are then ranked and, lastly, the fifty largest Local Government Areas (the units of local government below the states and territories) are also ranked.
Greater capital city statistical areas by population
Each capital city forms its own Greater Capital City Statistical Area (GCCSA), which according to the Australian Bureau of Statistics (ABS) represents a broad functional definition of each of the eight state and territory capital cities. [1] In Australia, the population of the GCCSA is the most-often quoted figure for the population of capital cities. These units correspond broadly to the international concept of metropolitan areas.
| Rank | Greater Capital City Statistical Area | State/territory | Estimated resident population | Growth from 2011 to 2022 | Included SUAs | |
|---|---|---|---|---|---|---|
| June 2023 [2] | June 2011 [2] | |||||
| 1 | Greater Sydney | 5,450,496 | 4,608,949 | +18.26% | Sydney Central Coast | |
| 2 | Greater Melbourne | 5,207,145 | 4,169,366 | +24.89% | Melbourne Bacchus Marsh Gisborne | |
| 3 | Greater Brisbane | 2,706,966 | 2,147,436 | +26.06% | Brisbane | |
| 4 | Greater Perth | 2,309,338 | 1,833,567 | +25.95% | Perth | |
| 5 | Greater Adelaide | 1,446,380 | 1,264,091 | +14.42% | Adelaide | |
| 6 | Australian Capital Territory [lower-alpha 1] | 466,566 | 367,985 | +26.79% | Canberra–Queanbeyan (ACT part only) | |
| 7 | Greater Hobart | 253,654 | 216,273 | +17.28% | Hobart | |
| 8 | Greater Darwin | 150,736 | 129,106 | +16.75% | Darwin | |
- Notes
- ↑ The GCCSA for Canberra covers the entire ACT, and is formally titled as such.
Significant urban areas by population
The following table ranks the SUAs, including those of the capital cities (which are smaller than their respective GCCSAs, except for Canberra's, which includes adjacent Queanbeyan, in New South Wales). Capitals are in bold. Significant Urban Areas are defined to represent significant towns and cities, or agglomerations of smaller towns, that have at least 10,000 total population. Significant Urban Areas may contain more than one distinct Urban Centre.
70% of the Australian population live in the top eight most populous cities.


| Rank | Significant Urban Area | State/territory | Estimated resident population | Growth from 2011 to 2022 | |
|---|---|---|---|---|---|
| June 2022 [3] | June 2011 [3] | ||||
| 1 | Melbourne | 4,933,678 | 4,087,822 | +20.69% | |
| 2 | Sydney | 4,897,585 | 4,240,340 | +15.50% | |
| 3 | Brisbane | 2,543,197 | 2,076,608 | +22.47% | |
| 4 | Perth | 2,206,474 | 1,817,023 | +21.43% | |
| 5 | Adelaide | 1,398,863 | 1,245,896 | +12.28% | |
| 6 | Gold Coast–Tweed Heads | 715,653 | 581,036 | +23.17% | |
| 7 | Newcastle–Maitland | 518,427 | 453,265 | +14.38% | |
| 8 | Canberra –Queanbeyan | 493,587 | 405,032 | +21.86% | |
| 9 | Sunshine Coast | 396,969 | 303,824 | +30.66% | |
| 10 | Central Coast | 345,722 | 314,941 | +9.77% | |
| 11 | Wollongong | 309,598 | 281,700 | +9.90% | |
| 12 | Geelong | 295,434 | 227,957 | +29.60% | |
| 13 | Hobart | 231,481 | 198,534 | +16.60% | |
| 14 | Townsville | 183,898 | 167,561 | +9.75% | |
| 15 | Cairns | 157,889 | 139,212 | +13.42% | |
| 16 | Toowoomba | 146,786 | 126,426 | +16.10% | |
| 17 | Darwin | 135,536 | 116,995 | +15.85% | |
| 18 | Ballarat | 114,198 | 93,459 | +22.19% | |
| 19 | Bendigo | 103,818 | 87,340 | +18.87% | |
| 20 | Albury-Wodonga | 98,738 | 84,195 | +17.27% | |
| 21 | Launceston | 93,447 | 86,051 | +8.59% | |
| 22 | Mackay | 86,740 | 79,683 | +8.86% | |
| 23 | Rockhampton | 81,021 | 78,598 | +3.08% | |
| 24 | Bunbury | 80,109 | 67,860 | +18.05% | |
| 25 | Bundaberg | 75,796 | 69,095 | +9.70% | |
| 26 | Coffs Harbour | 75,130 | 66,689 | +12.66% | |
| 27 | Hervey Bay | 59,617 | 49,835 | +19.63% | |
| 28 | Wagga Wagga | 57,470 | 54,137 | +6.16% | |
| 29 | Shepparton-Mooroopna | 54,329 | 47,571 | +14.21% | |
| 30 | Mildura-Buronga | 54,013 | 48,505 | +11.36% | |
| 31 | Port Macquarie | 51,223 | 43,275 | +18.37% | |
| 32 | Ballina | 46,751 | 40,674 | +14.94% | |
| 33 | Gladstone | 46,302 | 43,166 | +7.26% | |
| 34 | Tamworth | 44,979 | 40,085 | +12.21% | |
| 35 | Warragul–Drouin | 44,306 | 30,287 | +46.29% | |
| 36 | Traralgon–Morwell | 43,497 | 40,609 | +7.11% | |
| 37 | Busselton | 42,794 | 31,475 | +35.96% | |
| 38 | Orange | 42,379 | 37,785 | +12.16% | |
| 39 | Bowral–Mittagong | 41,753 | 36,266 | +15.13% | |
| 40 | Dubbo | 41,299 | 35,281 | +17.06% | |
| 41 | Geraldton | 40,666 | 36,884 | +10.25% | |
| 42 | Nowra–Bomaderry | 39,418 | 34,604 | +13.91% | |
| 43 | Bathurst | 37,856 | 33,754 | +12.15% | |
| 44 | Albany | 36,577 | 31,791 | +15.05% | |
| 45 | Warrnambool | 35,847 | 33,020 | +8.56% | |
| 46 | Devonport | 32,757 | 30,425 | +7.66% | |
| 47 | Kalgoorlie–Boulder | 30,443 | 31,933 | −4.67% | |
| 48 | Mount Gambier | 30,441 | 28,279 | +7.65% | |
| 49 | Victor Harbor–Goolwa | 29,428 | 24,422 | +20.50% | |
| 50 | Alice Springs | 28,922 | 28,489 | +1.52% | |
| 51 | Burnie–Somerset | 28,648 | 28,019 | +2.24% | |
| 52 | Lismore | 28,633 | 29,294 | −2.26% | |
| 53 | Morisset–Cooranbong | 28,586 | 22,644 | +26.24% | |
| 54 | Nelson Bay | 28,515 | 26,116 | +9.19% | |
| 55 | Maryborough | 28,010 | 26,893 | +4.15% | |
| 56 | Taree | 26,666 | 26,307 | +1.36% | |
| 57 | Bacchus Marsh | 25,595 | 17,488 | +46.36% | |
| 58 | Goulburn | 24,829 | 22,202 | +11.83% | |
| 59 | Armidale | 24,155 | 23,471 | +2.91% | |
| 60 | Gympie | 23,162 | 19,971 | +15.98% | |
| 61 | Echuca–Moama | 22,730 | 19,659 | +15.62% | |
| 62 | Gisborne | 22,543 | 18,570 | +21.39% | |
| 63 | Moe–Newborough | 22,022 | 21,432 | +2.75% | |
| 64 | Whyalla | 21,799 | 22,471 | −2.99% | |
| 65 | Yeppoon | 21,193 | 16,815 | +26.04% | |
| 66 | Forster–Tuncurry | 20,976 | 20,273 | +3.47% | |
| 63 | Griffith | 20,510 | 18,683 | +9.78% | |
| 68 | St Georges Basin–Sanctuary Point | 20,292 | 16,967 | +19.60% | |
| 69 | Wangaratta | 19,942 | 17,980 | +10.91% | |
| 70 | Grafton | 19,431 | 19,051 | +1.99% | |
| 71 | Murray Bridge | 19,067 | 17,071 | +11.69% | |
| 72 | Mount Isa | 18,693 | 21,417 | −12.72% | |
| 73 | Camden Haven | 18,633 | 16,267 | +14.54% | |
| 74 | Karratha | 18,229 | 17,007 | +7.19% | |
| 75 | Batemans Bay | 17,588 | 16,352 | +7.56% | |
| 76 | Broken Hill | 17,567 | 19,151 | −8.27% | |
| 77 | Singleton | 17,415 | 16,730 | +4.09% | |
| 78 | Ulladulla | 17,196 | 14,758 | +16.52% | |
| 79 | Port Lincoln | 16,920 | 15,621 | +8.32% | |
| 80 | Horsham | 16,919 | 16,099 | +5.09% | |
| 81 | Port Hedland | 16,580 | 14,372 | +15.36% | |
| 82 | Kempsey | 16,013 | 14,796 | +8.23% | |
| 83 | Warwick | 15,901 | 14,950 | +6.36% | |
| 84 | Broome | 15,774 | 13,314 | +18.48% | |
| 85 | Bairnsdale | 15,761 | 13,458 | +17.11% | |
| 86 | Medowie | 15,532 | 12,686 | +22.43% | |
| 87 | Ulverstone | 15,503 | 14,739 | +5.18% | |
| 88 | Sale | 15,303 | 14,441 | +5.97% | |
| 89 | Airlie Beach-Cannonvale | 15,141 | 10,982 | +37.87% | |
| 90 | Emerald | 14,639 | 13,632 | +7.39% | |
| 91 | Port Pirie | 14,214 | 14,281 | −0.47% | |
| 92 | Port Augusta | 14,130 | 14,084 | +0.33% | |
| 93 | Colac | 12,615 | 11,981 | +5.29% | |
| 94 | Mudgee | 12,559 | 10,832 | +15.94% | |
| 95 | Esperance | 12,536 | 11,777 | +6.44% | |
| 96 | Muswellbrook | 12,405 | 12,222 | +1.50% | |
| 97 | Lithgow | 12,367 | 12,686 | −2.51% | |
| 98 | Castlemaine | 11,329 | 9,920 | +14.20% | |
| 99 | Portland | 11,157 | 10,894 | +2.41% | |
| 100 | Swan Hill | 11,020 | 10,610 | +3.86% | |
| 101 | Byron Bay | 10,869 | 9,237 | +17.67% | |
| 102 | Kingaroy | 10,779 | 10,074 | +7.00% | |
50 largest urban centres by population
Urban centres are defined by the Australian Bureau of Statistics as being a population cluster of 1,000 or more people. For statistical purposes, people living in urban centres are classified as urban. The figures below represent the populations of the contiguous built-up areas of each city; with state and territory capitals in bold. These figures are only updated every census, as the ABS does not render population projections for Urban Centres, and as such can only be as up-to-date as the most recent census year.
| Rank (2016) | Urban Centre | Estimated resident population | SUA (if part of a larger SUA) | Ranking in state or territory, 2016 | |||||||||||
|---|---|---|---|---|---|---|---|---|---|---|---|---|---|---|---|
| 2016 census [4] [5] | 2011 census | 2006 census | ACT | NSW | NT | Qld | SA | Tas | WA | Vic | |||||
| 1 | Sydney | 4,321,535 | 3,908,642 | [6] | 3,641,422 | [7] | 1 | ||||||||
| 2 | Melbourne | 4,196,198 | 3,707,530 | [8] | 3,371,888 | [9] | 1 | ||||||||
| 3 | Brisbane | 2,054,614 | 1,874,427 | [10] | 1,676,389 | [11] | 1 | ||||||||
| 4 | Perth | 1,874,578 | 1,627,576 | [12] | 1,256,035 | [13] | 1 | ||||||||
| 5 | Adelaide | 1,165,632 | 1,103,979 | [14] | 1,040,719 | [15] | 1 | ||||||||
| 6 | Gold Coast–Tweed Heads (Gold Coast part) | 540,559 | 478,107 | [16] | Gold Coast–Tweed Heads | 2 | |||||||||
| 7 | Canberra –Queanbeyan (Canberra part) | 395,790 | 355,596 | [17] | Canberra–Queanbeyan | 1 | |||||||||
| 8 | Newcastle | 322,278 | 308,308 | [18] | 288,732 | [19] | Newcastle–Maitland | 2 | |||||||
| 9 | Central Coast | 307,742 | 297,713 | [20] | 282,726 | [21] | 3 | ||||||||
| 10 | Wollongong | 261,896 | 245,942 | [22] | 234,482 | [23] | 4 | ||||||||
| 11 | Sunshine Coast | 243,377 | 209,263 | [24] | 184,662 | [25] | 3 | ||||||||
| 12 | Hobart | 178,009 | 170,975 | [26] | 128,557 | [27] | 1 | ||||||||
| 13 | Townsville | 168,729 | 157,748 | [28] | 128,808 | [29] | 4 | ||||||||
| 14 | Geelong | 157,104 | 143,291 | [30] | 137,220 | [31] | 2 | ||||||||
| 15 | Cairns | 144,730 | 133,893 | [32] | 98,349 | [33] | 5 | ||||||||
| 16 | Darwin | 118,456 | 103,016 | [34] | 89,905 | [35] [36] | 1 | ||||||||
| 17 | Toowoomba | 100,032 | 96,597 | [37] | 95,265 | [38] | 6 | ||||||||
| 18 | Ballarat | 93,759 | 85,935 | [39] | 78,221 | [40] | 3 | ||||||||
| 19 | Bendigo | 92,379 | 82,794 | [41] | 76,051 | [42] | 4 | ||||||||
| 20 | Maitland | 78,015 | 67,132 | [43] | 61,431 | [44] | Newcastle–Maitland | 5 | |||||||
| 21 | Mackay | 75,710 | 74,219 | [45] | 66,874 | [46] | 7 | ||||||||
| 22 | Launceston | 75,329 | 74,085 | [47] | 71,395 | [48] | 2 | ||||||||
| 23 | Bunbury | 71,090 | 64,385 | [49] | 54,482 | [50] | 2 | ||||||||
| 24 | Rockhampton | 61,214 | 61,724 | [51] | 60,827 | [52] | 8 | ||||||||
| 25 | Gold Coast–Tweed Heads (Tweed Heads part) | 59,776 | 55,553 | [53] | Gold Coast–Tweed Heads | 6 | |||||||||
| 26 | Melton | 54,456 | 45,624 | [54] | 35,490 | [55] | Melbourne | 5 | |||||||
| 27 | Hervey Bay | 52,073 | 48,680 | [56] | 41,225 | [57] | 9 | ||||||||
| 28 | Bundaberg | 50,148 | 49,750 | [58] | 46,961 | [59] | 10 | ||||||||
| 29 | Wagga Wagga | 48,263 | 46,913 | [60] | 46,735 | [61] | 7 | ||||||||
| 30 | Coffs Harbour | 48,225 | 45,580 | [62] | 26,353 | [63] | 8 | ||||||||
| 31 | Albury–Wodonga (Albury part) | 47,974 | 45,627 | [64] | Albury–Wodonga | 9 | |||||||||
| 32 | Shepparton–Mooroopna | 46,199 | 42,741 | [65] | 38,773 | [66] | 6 | ||||||||
| 33 | Port Macquarie | 44,814 | 41,491 | [67] | 39,219 | [68] | 10 | ||||||||
| 34 | Orange | 37,182 | 34,992 | [69] | 31,544 | [70] | 11 | ||||||||
| 35 | Canberra –Queanbeyan (Queanbeyan part) | 36,248 | 35,878 | [71] | Canberra–Queanbeyan | 12 | |||||||||
| 36 | Albury–Wodonga (Wodonga part) | 35,130 | 31,605 | [72] | Albury–Wodonga | 7 | |||||||||
| 37 | Sunbury | 34,425 | 33,062 | [73] | 29,566 | [74] | Melbourne | 8 | |||||||
| 38 | Dubbo | 34,339 | 32,327 | [75] | 30,574 | [76] | 13 | ||||||||
| 39 | Tamworth | 33,885 | 36,131 | [77] | 33,475 | [78] | 14 | ||||||||
| 40 | Bathurst | 33,587 | 31,294 | [79] | 28,992 | [80] | 15 | ||||||||
| 41 | Mildura–Buronga (Mildura part) | 33,444 | 31,361 | [81] | Mildura–Wentworth | 9 | |||||||||
| 42 | Gladstone | 33,418 | 32,073 | [82] | 28,808 | [83] | Gladstone–Tannum Sands | 11 | |||||||
| 43 | Geraldton | 31,982 | 31,349 | [84] | 27,420 | [85] | 3 | ||||||||
| 44 | Nowra–Bomaderry | 30,853 | 27,988 | [86] | 27,478 | [87] | 16 | ||||||||
| 45 | Warrnambool | 30,709 | 29,284 | [88] | 10 | ||||||||||
| 46 | Kalgoorlie–Boulder | 29,875 | 30,840 | [89] | 28,242 | [90] | 4 | ||||||||
| 47 | Albany | 29,373 | 26,643 | [91] | 25,196 | [92] | 5 | ||||||||
| 48 | Blue Mountains | 29,319 | 28,769 | [93] | Sydney | 17 | |||||||||
| 49 | Lismore | 27,569 | 27,474 | [94] | 27,069 | [95] | 18 | ||||||||
| 50 | Gawler | 26,472 | 23,957 | [96] | 20,006 | [97] | Adelaide | 2 | |||||||
List of local government areas by population
Local government areas (LGAs) are the main units of local government in Australia. They may be termed cities, councils, regions, shires, towns, or other names, and all function similarly. Local government areas cover around 90 per cent of the nation. Significant sections of South Australia and New South Wales are unincorporated, that is, have no defined local government, along with the ACT and smaller sections of Northern Territory and Victoria. Brisbane is the only state capital city with its respective LGA (City of Brisbane) covering a significant portion of its urban area. In other capital cities, the central LGA covers a much smaller proportion of the total urban area.
The populations of the central local government areas in other capitals are relatively small. As of June 2020, Darwin had a population of 82,030, Hobart 55,250, Perth 30,971, and Adelaide 26,177. [98] Most Australian capital cities have suburban local government areas significantly larger in population than the central local government area.
| Rank (2021) | Local government area | Estimated resident population [98] | Ranking in state, 2021 | ||||||
|---|---|---|---|---|---|---|---|---|---|
| 2021 | 2019 | Qld | NSW | WA | Vic | SA | |||
| 1 | City of Brisbane | 1,272,461 | 1,253,647 | 1 | |||||
| 2 | City of Gold Coast | 643,461 | 620,437 | 2 | |||||
| 3 | City of Moreton Bay | 486,645 | 469,442 | 3 | |||||
| 4 | City of Blacktown | 387,104 | 374,372 | 1 | |||||
| 5 | City of Canterbury-Bankstown | 378,425 | 377,836 | 2 | |||||
| 6 | City of Casey | 368,861 | 353,962 | 1 | |||||
| 7 | City of Logan | 348,020 | 334,353 | 4 | |||||
| 8 | Central Coast Council | 347,158 | 343,922 | 3 | |||||
| 9 | Sunshine Coast Region | 343,590 | 328,390 | 5 | |||||
| 10 | City of Wyndham | 289,571 | 270,607 | 2 | |||||
| 11 | Northern Beaches Council | 272,184 | 273,409 | 4 | |||||
| 12 | City of Greater Geelong | 269,508 | 258,938 | 3 | |||||
| 13 | City of Parramatta | 258,799 | 257,094 | 5 | |||||
| 14 | City of Hume | 243,738 | 233,545 | 4 | |||||
| 15 | City of Sydney | 242,237 | 245,942 | 6 | |||||
| 16 | Cumberland Council | 239,834 | 241,453 | 7 | |||||
| 17 | City of Whittlesea | 237,932 | 220,297 | 5 | |||||
| 18 | City of Ipswich | 236,708 | 222,311 | 6 | |||||
| 19 | City of Liverpool | 234,917 | 227,545 | 8 | |||||
| 20 | Sutherland Shire | 234,275 | 230,579 | 9 | |||||
| 21 | City of Stirling | 223,260 | 221,238 | 1 | |||||
| 22 | City of Wollongong | 220,659 | 218,076 | 10 | |||||
| 23 | City of Penrith | 219,173 | 212,944 | 11 | |||||
| 24 | City of Wanneroo | 215,878 | 208,360 | 2 | |||||
| 25 | City of Lake Macquarie | 210,031 | 205,875 | 12 | |||||
| 26 | City of Fairfield | 207,922 | 211,654 | 13 | |||||
| 27 | City of Brimbank | 201,680 | 209,568 | 6 | |||||
| 28 | Inner West Council | 199,759 | 200,720 | 14 | |||||
| 29 | City of Townsville | 197,992 | 195,022 | 7 | |||||
| 30 | City of Monash | 197,980 | 202,896 | 7 | |||||
| 31 | The Hills Shire | 188,557 | 177,927 | 15 | |||||
| 32 | City of Merri-bek | 184,707 | 185,811 | 8 | |||||
| 33 | Bayside Council | 182,369 | 178,351 | 16 | |||||
| 34 | City of Melton | 179,107 | 164,936 | 9 | |||||
| 35 | City of Boroondara | 176,632 | 183,197 | 10 | |||||
| 36 | City of Whitehorse | 175,970 | 178,779 | 11 | |||||
| 37 | City of Onkaparinga | 175,711 | 172,945 | 1 | |||||
| 38 | City of Campbelltown | 175,687 | 170,912 | 17 | |||||
| 39 | Toowoomba Region | 171,135 | 168,992 | 8 | |||||
| 40 | City of Melbourne | 169,860 | 178,994 | 12 | |||||
| 41 | City of Newcastle | 168,880 | 165,541 | 18 | |||||
| 42 | Shire of Mornington Peninsula | 168,865 | 167,619 | 13 | |||||
| 43 | Cairns Region | 168,853 | 166,849 | 9 | |||||
| 44 | City of Kingston | 164,680 | 165,804 | 14 | |||||
| 45 | City of Greater Dandenong | 163,266 | 168,261 | 15 | |||||
| 46 | City of Knox | 162,769 | 164,553 | 16 | |||||
| 47 | City of Darebin | 162,501 | 164,224 | 17 | |||||
| 48 | Redland City | 161,463 | 158,801 | 10 | |||||
| 49 | City of Joondalup | 160,579 | 159,898 | 3 | |||||
| 50 | Georges River Council | 159,266 | 159,431 | 19 | |||||
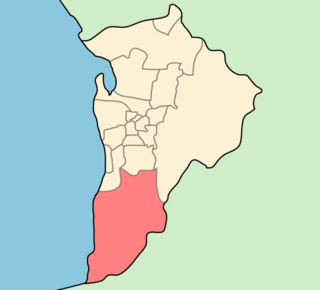
Definitions

Illustrated are the various statistical areas defined by the Australian Bureau of Statistics for Sydney and its surrounds. The extent of the Greater Sydney greater capital city statistical area is designated by thick grey line and black text. The greater capital city statistical areas are the eight unique statistical divisions delineating the broadest possible concept of each state or territory capital city, constructed from one or more whole labour market areas (designated SA4 in the Australian Statistical Geography Standard). The rest of NSW area includes the entire remainder of the state, as each state or territory has only one GCCSA.
The significant urban areas are designated by solid orange lines with stippled fill and red text. Significant urban areas are statistical divisions designed to represent significant towns and cities or associated collections of smaller towns, with total populations of 10,000 people or more. They consist of single, or clusters of, urban centres/localities (see below), and are constructed from one or more SA2 units, which are collations of suburbs and localities designed for consistent statistical output between censuses.
The Urban Centres/Localities are designated by dashed red lines with pink fill. Urban centres/localities are statistical divisions delineating the contiguous built up, or urban areas of cities, towns and most small settlements. They are constructed from the smallest statistical output areas (SA1).
Also represented are 31 outlined coloured areas. These are the 31 local government areas that are commonly understood as comprising Sydney, albeit unofficially.
See also
- Demography of Australia
- List of cities in Australia
- List of cities in Oceania by population
- List of largest cities in the world
- List of places in New South Wales by population
- List of places in Queensland by population
- List of places in South Australia by population
- List of places in Tasmania by population
- List of places in Victoria by population
- List of places in Western Australia by population
- List of towns and cities in Australia by year of settlement
Related Research Articles

The City of Lake Macquarie is a local government area in the Hunter Region in New South Wales, Australia. It was proclaimed a city from 7 September 1984. The city is situated adjacent to the city of Newcastle and is widely considered as a part of the Greater Newcastle area. The city is approximately 150 km (93 mi) north of Sydney. One of its major tourist attractions is its lake, also named Lake Macquarie.

The City of Melton is a local government area in Victoria, Australia, on Melbourne's western rural–urban fringe.

The City of Greater Bendigo is a local government area in Victoria, Australia, located in the central part of the state. It covers an area of 3,000 square kilometres (1,200 sq mi) and, in August 2021, had a population of 121,470. It includes the city of Bendigo and the towns of Axedale, Elmore, Heathcote, Marong, Raywood and Strathfieldsaye. It was formed in 1994 from the amalgamation of the former City of Bendigo with the Borough of Eaglehawk, Shire of Strathfieldsaye, Shire of Huntly and parts of the Rural City of Marong and Shire of McIvor. It is the state’s third largest economy base and is considered a service and infrastructure centre for north central Victoria. The city is surrounded by 40,000 hectares of regional, state and national parkland.

The City of Warrnambool is a local government area in the Barwon South West region of Victoria, Australia, located in the south-western part of the state. It covers an area of 121 square kilometres (47 sq mi) and in June 2018 had a population of 34,862. It is entirely surrounded by the Shire of Moyne and the Southern Ocean. It is one of only a few regional councils in Victoria to remain serving just one urban district after the amalgamation process of 1994, although through that process it did gained some portions of the former Shire of Warrnambool.

North Canberra, or the Inner North, is a subdivision of Canberra Central in the Australian Capital Territory in Australia. Comprising 14 suburbs. At the 2021 census, it had 26,699 dwellings housing 61,188 people of the 453,324 people in the Australian Capital Territory. Many of Canberra's oldest dwellings are located on it.

The Town of Cambridge is a local government area in the inner western suburbs of the Western Australian capital city of Perth, about 5 kilometres (3 mi) west of Perth's central business district and extending to the Indian Ocean at City Beach. The Town covers an area of 22.0 square kilometres (8.5 sq mi) and had a population of almost 29,000 as of the 2021 Census. It was originally part of the City of Perth before the restructuring by the Western Australian State Government in 1994.

The City of Wanneroo is a local government area with city status in the northern suburbs of Perth, Western Australia. It is centred approximately 25 kilometres (15.5 mi) north of Perth's central business district and forms part of the northern boundary of the Perth metropolitan area. Wanneroo encompasses the federal divisions of Cowan, Moore and Pearce.

Hobart City Council is a local government body in Tasmania, covering the central metropolitan area of the state capital, Hobart. The Hobart local government area has a population of 53,684 and includes the suburbs of West Hobart, Lenah Valley, Mount Stuart, South Hobart, New Town, Sandy Bay and most of Fern Tree, North Hobart and Mount Nelson.
South Canberra, or the Inner South, is a subdivision of Canberra Central in the Australian Capital Territory in Australia.
The City of Onkaparinga is a local government area (LGA) located on the southern fringe of Adelaide, South Australia. It is named after the Onkaparinga River, whose name comes from Ngangkiparinga, a Kaurna word meaning women's river. It is the largest LGA in South Australia, with a population of over 170,000 people in both urban and rural communities and is also geographically expansive, encompassing an area of 518.3 km². The council is headquartered in the Noarlunga Centre with area offices situated in Aberfoyle Park, Woodcroft and Willunga.

The eastern states of Australia are the states adjoining the east continental coastline of Australia. These are the mainland states of Victoria, New South Wales and Queensland, and the island state of Tasmania. The Australian Capital Territory and Jervis Bay Territory, while not states, are also included. On some occasions, the southern state of South Australia is also included in this grouping due to its economic ties with the eastern states.
The suburbs of the Australian Capital Territory are organised into a hierarchy of districts, town centres, group centres, local suburbs and other industrial areas and villages. While these divisions have no formal role in the governance or administration of the city, they formed a basis for the planning and development of the city and are significant to the city's commercial and social activities.

Woodbridge is a semi-rural locality in the local government area (LGA) of Kingborough in the Hobart LGA region of Tasmania. The locality is about 26 kilometres (16 mi) south of the town of Kingston. The 2021 Census recorded a population of 547 for the state suburb of Woodbridge, with the median age being 54. There are 180 families living in Woodbridge, with a mean of 1.8 children per household. It is located 38 kilometres (24 mi) south of the state capital, Hobart.
Greater Perth is Perth's Greater Capital City Statistical Area (GCCSA), a geographical area designed to represent the functional extent of Western Australia's (WA) capital city.

The City of Albury is a local government area in the Murray region of New South Wales, Australia. The area covers 305.9 square kilometres (118.1 sq mi) to the north of the Murray River. The area extends around 10 to 12 kilometres east and west along the river from the centre of Albury and up to 20 kilometres (12 mi) north. The population of the City of Albury area was 53,767 in June 2018.

The Shire of Northam is a local government area in the Wheatbelt region of Western Australia, beyond the northeastern fringe of the Perth metropolitan area centred on the town of Northam itself. The Shire covers an area of 1,431 square kilometres (553 sq mi). In 2007, it merged with the Town of Northam, almost tripling its population in the process from a previous size of 3,794.

Canberra Central is a district in the Australian Capital Territory in Australia. Consisting of both the subdivisions of North Canberra and South Canberra. The district is subdivided into divisions (suburbs), sections and blocks. The district of Canberra Central lies entirely within the bounds of the city of Canberra, the capital city of Australia.
The Perth metropolitan region or the Perth metropolitan area is the administrative area and geographical extent of the Western Australian capital city of Perth and its conurbation.

The City of Brisbane is a local government area (LGA) which comprises the inner portion of the metropolitan area of Brisbane, the capital of Queensland, Australia. Its governing body is the Brisbane City Council.
Blue Mountain Heights is a residential locality in the Toowoomba Region, Queensland, Australia. In the 2016 census, Blue Mountain Heights had a population of 929 people.
References
- ↑ "ESTIMATED RESIDENT POPULATION, States and Territories - Greater Capital City Statistical Areas (GCCSAs)". abs.gov.au. 28 July 2017.
- 1 2 "Population estimates by LGA, Significant Urban Area, Remoteness Area and electoral division, 2001 to 2022". abs.gov.au. Australian Bureau of Statistics. Retrieved 26 March 2024.
- 1 2 "Population estimates by LGA, Significant Urban Area, Remoteness Area and electoral division, 2001 to 2022". abs.gov.au. Australian Bureau of Statistics. Retrieved 6 May 2023.
- ↑ "1270.0.55.004 - Australian Statistical Geography Standard (ASGS): Volume 4 - Significant Urban Areas, Urban Centres and Localities, Section of State, July 2016 - Urban Centre and Locality (UCL) Ed 2016 in .csv format". Australian Bureau of Statistics. Australian Bureau of Statistics. Retrieved 12 April 2021.
- ↑ "2016 Census Datapacks - General Community Profile - Urban Centres and Localities". Australian Bureau of Statistics. Australian Bureau of Statistics. Retrieved 12 April 2021.
- ↑ Australian Bureau of Statistics (31 October 2012). "Sydney". 2011 Census QuickStats. Retrieved 8 December 2012.
- ↑ Australian Bureau of Statistics (25 October 2007). "Sydney". 2006 Census QuickStats. Retrieved 8 December 2012.
- ↑ Australian Bureau of Statistics (31 October 2012). "Melbourne". 2011 Census QuickStats. Retrieved 8 December 2012.
- ↑ Australian Bureau of Statistics (25 October 2007). "Melbourne". 2006 Census QuickStats. Retrieved 8 December 2012.
- ↑ Australian Bureau of Statistics (31 October 2012). "Brisbane". 2011 Census QuickStats. Retrieved 8 December 2012.
- ↑ Australian Bureau of Statistics (25 October 2007). "Brisbane". 2006 Census QuickStats. Retrieved 8 December 2012.
- ↑ Australian Bureau of Statistics (31 October 2012). "Perth (WA)". 2011 Census QuickStats. Retrieved 8 December 2012.
- ↑ Australian Bureau of Statistics (25 October 2007). "Perth (WA)". 2006 Census QuickStats. Retrieved 8 December 2012.
- ↑ Australian Bureau of Statistics (31 October 2012). "Adelaide". 2011 Census QuickStats. Retrieved 8 December 2012.
- ↑ Australian Bureau of Statistics (25 October 2007). "Adelaide". 2006 Census QuickStats. Retrieved 8 December 2012.
- ↑ Australian Bureau of Statistics (31 October 2012). "Gold Coast - Tweed Heads (Gold Coast part)". 2011 Census QuickStats. Retrieved 12 April 2021.
- ↑ Australian Bureau of Statistics (31 October 2012). "Canberra - Queanbeyan (Canberra part)". 2011 Census QuickStats. Retrieved 12 April 2021.
- ↑ Australian Bureau of Statistics (31 October 2012). "Newcastle". 2011 Census QuickStats. Retrieved 8 December 2012.
- ↑ Australian Bureau of Statistics (25 October 2007). "Newcastle". 2006 Census QuickStats. Retrieved 8 December 2012.
- ↑ Australian Bureau of Statistics (31 October 2012). "Central Coast". 2011 Census QuickStats. Retrieved 8 December 2012.
- ↑ Australian Bureau of Statistics (25 October 2007). "Central Coast". 2006 Census QuickStats. Retrieved 8 December 2012.
- ↑ Australian Bureau of Statistics (31 October 2012). "Wollongong". 2011 Census QuickStats. Retrieved 8 December 2012.
- ↑ Australian Bureau of Statistics (25 October 2007). "Wollongong". 2006 Census QuickStats. Retrieved 8 December 2012.
- ↑ Australian Bureau of Statistics (31 October 2012). "Sunshine Coast". 2011 Census QuickStats. Retrieved 8 December 2012.
- ↑ Australian Bureau of Statistics (25 October 2007). "Sunshine Coast". 2006 Census QuickStats. Retrieved 8 December 2012.
- ↑ Australian Bureau of Statistics (31 October 2012). "Hobart". 2011 Census QuickStats. Retrieved 8 December 2012.
- ↑ Australian Bureau of Statistics (25 October 2007). "Hobart". 2006 Census QuickStats. Retrieved 8 December 2012.
- ↑ Australian Bureau of Statistics (31 October 2012). "Townsville". 2011 Census QuickStats. Retrieved 8 December 2012.
- ↑ Australian Bureau of Statistics (25 October 2007). "Townsville". 2006 Census QuickStats. Retrieved 8 December 2012.
- ↑ Australian Bureau of Statistics (31 October 2012). "Geelong". 2011 Census QuickStats. Retrieved 8 December 2012.
- ↑ Australian Bureau of Statistics (25 October 2007). "Geelong". 2006 Census QuickStats. Retrieved 8 December 2012.
- ↑ Australian Bureau of Statistics (31 October 2012). "Cairns". 2011 Census QuickStats. Retrieved 8 December 2012.
- ↑ Australian Bureau of Statistics (25 October 2007). "Cairns". 2006 Census QuickStats. Retrieved 8 December 2012.
- ↑ Australian Bureau of Statistics (31 October 2012). "Darwin". 2011 Census QuickStats. Retrieved 4 January 2012.
- ↑ Australian Bureau of Statistics (25 October 2007). "Darwin". 2006 Census QuickStats. Retrieved 8 December 2012.
- ↑ Australian Bureau of Statistics (25 October 2007). "Palmerston". 2006 Census QuickStats. Retrieved 8 December 2012.
- ↑ Australian Bureau of Statistics (31 October 2012). "Toowoomba". 2011 Census QuickStats. Retrieved 8 December 2012.
- ↑ Australian Bureau of Statistics (25 October 2007). "Toowoomba". 2006 Census QuickStats. Retrieved 8 December 2012.
- ↑ Australian Bureau of Statistics (31 October 2012). "Ballarat". 2011 Census QuickStats. Retrieved 8 December 2012.
- ↑ Australian Bureau of Statistics (25 October 2007). "Ballarat". 2006 Census QuickStats. Retrieved 8 December 2012.
- ↑ Australian Bureau of Statistics (31 October 2012). "Bendigo". 2011 Census QuickStats. Retrieved 8 December 2012.
- ↑ Australian Bureau of Statistics (25 October 2007). "Bendigo". 2006 Census QuickStats. Retrieved 8 December 2012.
- ↑ Australian Bureau of Statistics (31 October 2012). "Maitland (NSW)". 2011 Census QuickStats. Retrieved 8 December 2012.
- ↑ Australian Bureau of Statistics (25 October 2007). "Maitland (NSW)". 2006 Census QuickStats. Retrieved 8 December 2012.
- ↑ Australian Bureau of Statistics (31 October 2012). "Mackay". 2011 Census QuickStats. Retrieved 1 January 2014.
- ↑ Australian Bureau of Statistics (25 October 2007). "Mackay". 2006 Census QuickStats. Retrieved 8 December 2012.
- ↑ Australian Bureau of Statistics (31 October 2012). "Launceston". 2011 Census QuickStats. Retrieved 8 December 2012.
- ↑ Australian Bureau of Statistics (25 October 2007). "Launceston". 2006 Census QuickStats. Retrieved 8 December 2012.
- ↑ Australian Bureau of Statistics (31 October 2012). "Bunbury". 2011 Census QuickStats. Retrieved 8 December 2012.
- ↑ Australian Bureau of Statistics (25 October 2007). "Bunbury". 2006 Census QuickStats. Retrieved 8 December 2012.
- ↑ Australian Bureau of Statistics (31 October 2012). "Rockhampton". 2011 Census QuickStats. Retrieved 8 December 2012.
- ↑ Australian Bureau of Statistics (25 October 2007). "Rockhampton". 2006 Census QuickStats. Retrieved 8 December 2012.
- ↑ Australian Bureau of Statistics (31 October 2012). "Gold Coast - Tweed Heads (Tweed Heads part)". 2011 Census QuickStats. Retrieved 12 April 2021.
- ↑ Australian Bureau of Statistics (31 October 2012). "Melton". 2011 Census QuickStats. Retrieved 8 December 2012.
- ↑ Australian Bureau of Statistics (25 October 2007). "Melton". 2006 Census QuickStats. Retrieved 8 December 2012.
- ↑ Australian Bureau of Statistics (31 October 2012). "Hervey Bay". 2011 Census QuickStats. Retrieved 8 December 2012.
- ↑ Australian Bureau of Statistics (25 October 2007). "Hervey Bay". 2006 Census QuickStats. Retrieved 8 December 2012.
- ↑ Australian Bureau of Statistics (31 October 2012). "Bundaberg". 2011 Census QuickStats. Retrieved 8 December 2012.
- ↑ Australian Bureau of Statistics (25 October 2007). "Bundaberg". 2006 Census QuickStats. Retrieved 8 December 2012.
- ↑ Australian Bureau of Statistics (31 October 2012). "Wagga Wagga". 2011 Census QuickStats. Retrieved 8 December 2012.
- ↑ Australian Bureau of Statistics (25 October 2007). "Wagga Wagga". 2006 Census QuickStats. Retrieved 8 December 2012.
- ↑ Australian Bureau of Statistics (31 October 2012). "Coffs Harbour". 2011 Census QuickStats. Retrieved 8 December 2012.
- ↑ Australian Bureau of Statistics (25 October 2007). "Coffs Harbour". 2006 Census QuickStats. Retrieved 8 December 2012.
- ↑ Australian Bureau of Statistics (31 October 2012). "Albury - Wodonga (Albury part)". 2011 Census QuickStats. Retrieved 12 April 2021.
- ↑ Australian Bureau of Statistics (31 October 2012). "Shepparton – Mooroopna". 2011 Census QuickStats. Retrieved 8 December 2012.
- ↑ Australian Bureau of Statistics (25 October 2007). "Shepparton – Mooroopna". 2006 Census QuickStats. Retrieved 8 December 2012.
- ↑ Australian Bureau of Statistics (31 October 2012). "Port Macquarie". 2011 Census QuickStats. Retrieved 8 December 2012.
- ↑ Australian Bureau of Statistics (25 October 2007). "Port Macquarie". 2006 Census QuickStats. Retrieved 8 December 2012.
- ↑ Australian Bureau of Statistics (31 October 2012). "Orange". 2011 Census QuickStats. Retrieved 8 December 2012.
- ↑ Australian Bureau of Statistics (25 October 2007). "Orange". 2006 Census QuickStats. Retrieved 8 December 2012.
- ↑ Australian Bureau of Statistics (31 October 2012). "Canberra - Queanbeyan (Queanbeyan part)". 2011 Census QuickStats. Retrieved 12 April 2021.
- ↑ Australian Bureau of Statistics (31 October 2012). "Albury - Wodonga (Wodonga part)". 2011 Census QuickStats. Retrieved 12 April 2021.
- ↑ Australian Bureau of Statistics (31 October 2012). "Sunbury". 2011 Census QuickStats. Retrieved 8 December 2012.
- ↑ Australian Bureau of Statistics (25 October 2007). "Sunbury". 2006 Census QuickStats. Retrieved 8 December 2012.
- ↑ Australian Bureau of Statistics (31 October 2012). "Dubbo". 2011 Census QuickStats. Retrieved 8 December 2012.
- ↑ Australian Bureau of Statistics (25 October 2007). "Dubbo". 2006 Census QuickStats. Retrieved 8 December 2012.
- ↑ Australian Bureau of Statistics (31 October 2012). "Tamworth". 2011 Census QuickStats. Retrieved 8 December 2012.
- ↑ Australian Bureau of Statistics (25 October 2007). "Tamworth". 2006 Census QuickStats. Retrieved 8 December 2012.
- ↑ Australian Bureau of Statistics (31 October 2012). "Bathurst". 2011 Census QuickStats. Retrieved 8 December 2012.
- ↑ Australian Bureau of Statistics (25 October 2007). "Bathurst". 2006 Census QuickStats. Retrieved 8 December 2012.
- ↑ Australian Bureau of Statistics (31 October 2012). "Mildura - Buronga (Mildura part)". 2011 Census QuickStats. Retrieved 12 April 2021.
- ↑ Australian Bureau of Statistics (31 October 2012). "Gladstone". 2011 Census QuickStats. Retrieved 8 December 2012.
- ↑ Australian Bureau of Statistics (25 October 2007). "Gladstone". 2006 Census QuickStats. Retrieved 8 December 2012.
- ↑ Australian Bureau of Statistics (31 October 2012). "Geraldton". 2011 Census QuickStats. Retrieved 8 December 2012.
- ↑ Australian Bureau of Statistics (25 October 2007). "Geraldton". 2006 Census QuickStats. Retrieved 8 December 2012.
- ↑ Australian Bureau of Statistics (31 October 2012). "Nowra – Bomaderry". 2011 Census QuickStats. Retrieved 8 December 2012.
- ↑ Australian Bureau of Statistics (25 October 2007). "Nowra – Bomaderry". 2006 Census QuickStats. Retrieved 8 December 2012.
- ↑ Australian Bureau of Statistics (31 October 2012). "Warrnambool". 2011 Census QuickStats. Retrieved 12 April 2021.
- ↑ Australian Bureau of Statistics (31 October 2012). "Kalgoorlie – Boulder". 2011 Census QuickStats. Retrieved 8 December 2012.
- ↑ Australian Bureau of Statistics (25 October 2007). "Kalgoorlie – Boulder". 2006 Census QuickStats. Retrieved 8 December 2012.
- ↑ Australian Bureau of Statistics (31 October 2012). "Albany". 2011 Census QuickStats. Retrieved 8 December 2012.
- ↑ Australian Bureau of Statistics (25 October 2007). "Albany". 2006 Census QuickStats. Retrieved 8 December 2012.
- ↑ Australian Bureau of Statistics (31 October 2012). "Blue Mountains". 2011 Census QuickStats. Retrieved 12 April 2021.
- ↑ Australian Bureau of Statistics (31 October 2012). "Lismore". 2011 Census QuickStats. Retrieved 8 December 2012.
- ↑ Australian Bureau of Statistics (25 October 2007). "Mackay". 2006 Census QuickStats. Retrieved 8 December 2012.
- ↑ Australian Bureau of Statistics (31 October 2012). "Gawler". 2011 Census QuickStats. Retrieved 17 November 2017.
- ↑ Australian Bureau of Statistics (25 October 2007). "Gawler". 2006 Census QuickStats. Retrieved 17 November 2017.
- 1 2 "Population estimates by LGA, Significant Urban Area, Remoteness Area and electoral division, 2001 to 2021". Australian Bureau of Statistics. Australian Bureau of Statistics . Retrieved 31 March 2022.
External links
- "Table 1: Population growth and turnover in Local Government Areas (LGAs), 2006 to 2011". Australian Bureau of Statistics. 25 November 2009. Retrieved 10 August 2015. — Spreadsheet of population data for local government areas in the 2006 and 2011 Australian census
Text is available under the CC BY-SA 4.0 license; additional terms may apply.
Images, videos and audio are available under their respective licenses.