Fishbone Diagram
A fishbone diagram, also known as an Ishikawa diagram or cause and effect diagram, is a tool used to identify the root causes of a problem. It is named after Japanese quality control expert Kaoru Ishikawa, who developed the concept in the 1960s. Organizations across a variety of industries, including manufacturing, healthcare, and service use the fishbone diagram to identify and analyze the factors that contribute to a particular problem or issue.
Teams typically use a fishbone diagram to identify all of the possible causes of a specific problem or effect. You construct it by drawing a horizontal line with the problem or effect written at the end, and then drawing lines coming off of the central line to represent the different categories of causes. Teams typically label it with the major contributing factors, such as people, equipment, materials, environment, and methods.
Once a team determines the categories, the next step is to brainstorm and list out all of the potential causes within each category. You then draw the causes as branches off of the main lines, with each branch representing a specific cause.
Once a team has identified and listed all of the causes, the next step is to analyze the relationships between the causes to identify the root causes of the problem. You can do this through a variety of techniques, such as the 5 Whys method, which involves asking why the problem occurs repeatedly until the root cause is identified.
Once a team has identified the root causes, the next step is to develop and implement solutions to address those root causes. This can involve making changes to processes, equipment, training, or other factors that contribute to the problem.
The fishbone diagram is a valuable tool for identifying and addressing the root causes of a problem. By systematically analyzing the factors that contribute to a problem, organizations can develop effective solutions and improve the overall performance and quality of their processes.
Fishbone Diagram Example
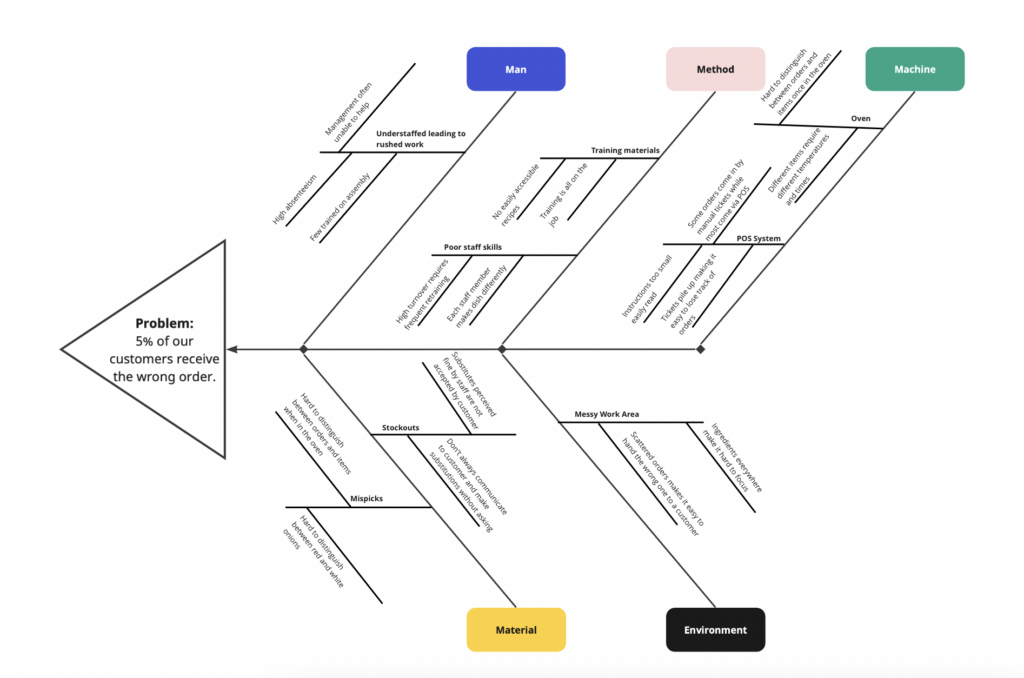
When building a fishbone team members should be careful to include only the actual physical causes. It can be tempting to include items someone believes is happening or wishes were happening. Consequently, a fishbone can turn into a “wishbone” diagram.
Additional Resources on the Fishbone Diagram
Articles
- Ask Art: How Useful is Six Sigma and the Black Belts and Green Belts that Come with It?
- Jim Womack on how lean compares with Six Sigma, Re-engineering, TOC, TPM, etc., etc.
- Not Every Problem Is a “Nail” But Companies Typically Reach for the Same Old “Hammer”
- Why A3 Thinking is the Ideal Problem-Solving Method
- Developing Problem Solvers
- Fishbone Diagrams and Mind Maps