
Electoral history of Adlai Stevenson II

This is the electoral history of Adlai Stevenson II, who served as Governor of Illinois (1949–1953) and 5th United States Ambassador to the United Nations (1961–1965), and was twice the Democratic Party's nominee for President of the United States, losing both the 1952 and 1956 presidential general elections to Republican Dwight D. Eisenhower.
Stevenson was elected as a Democrat in the 1948 Illinois gubernatorial election. In 1952, he had won his party's nomination to seek a second term as governor. However, he was nominated as his party's presidential nominee at the 1952 Democratic National Convention, being successfully drafted at the convention. As a result, Stevenson had to withdraw from the gubernatorial election in order to run for president. Stevenson and his running mate John Sparkman lost the presidential election to the Republican ticket of Dwight D. Eisenhower and Richard Nixon.
In 1956, he successfully sought to again receive his party's nomination for president. He and his running mate Estes Kefauver lost to the Republican ticket of Eisenhower and Nixon.
At the 1960 Democratic National Convention, Stevenson launched a late effort to again receive his party's nomination, but this was unsuccessful, and John F. Kennedy was nominated for president instead.
Gubernatorial[edit]
1948[edit]
| Party | Candidate | Votes | % | |
|---|---|---|---|---|
| Democratic | Adlai E. Stevenson | 578,390 | 100 | |
| Total votes | 578,390 | 100 | ||
| Party | Candidate | Votes | % | |
|---|---|---|---|---|
| Democratic | Adlai E. Stevenson | 2,250,074 | 57.11 | |
| Republican | Dwight H. Green (incumbent) | 1,678,007 | 42.59 | |
| Prohibition | Willis Ray Wilson | 9,491 | 0.24 | |
| Socialist Labor | Louis Fisher | 2,673 | 0.07 | |
| Write-in | Others | 12 | 0.00 | |
| Total votes | 3,940,257 | 100 | ||
1952[edit]
| Party | Candidate | Votes | % | |
|---|---|---|---|---|
| Democratic | Adlai E. Stevenson (incumbent) | 708,275 | 99.97 | |
| Write-in | Others | 213 | 0.03 | |
| Total votes | 708,488 | 100 | ||
Presidential[edit]
1952[edit]
Democratic primaries[edit]
1952 Democratic Party presidential primaries:[4]
- Estes Kefauver - 3,169,448 (65.04%)
- Pat Brown - 485,578 (9.97%)
- Richard Russell, Jr. - 371,179 (7.62%)
- Matthew M. Neely - 191,471 (3.93%)
- Robert J. Bulkley - 184,880 (3.79%)
- Hubert Humphrey - 102,527 (2.10%)
- Adlai Stevenson - 81,096 (1.66%)
- Dwight Eisenhower - 64,911 (1.33%)
- Harry S. Truman (inc.) - 62,345 (1.28%)
- Unpledged delegates - 46,361 (0.95%)
- Robert S. Kerr - 45,285 (0.93%)
- William O. Douglas - 29,532 (0.61%)
- W. Averell Harriman - 19,806 (0.41%)
- Jerome F. Fox - 18,322 (0.38%)
Democratic National Convention balloting[edit]
| 1952 Democratic National Convention presidential balloting[5] | |||||||
|---|---|---|---|---|---|---|---|
| Ballot | 1st Before Shifts | 1st After Shifts | 2nd Before Shifts | 2nd After Shifts | 3rd Before Shifts | 3rd After Shifts | Unanimous |
| Estes Kefauver | 300.5 | 340 | 362 | 361 | 279.5 | 275.5 | - |
| Adlai Stevenson | 248.5 | 273 | 329.5 | 324.5 | 613 | 617.5 | 1,230 |
| Richard Russell Jr. | 267.5 | 268 | 294 | 294 | 261.5 | 261 | - |
| W. Averell Harriman | 126 | 123.5 | 121.5 | 121.5 | - | - | - |
| Alben W. Barkley | 49.5 | 48.5 | 81 | 81 | 67.5 | 67.5 | - |
| Robert S. Kerr | 69 | 65 | 5.5 | 5.5 | - | - | - |
| Paul A. Dever | 37.5 | 37.5 | 30.5 | 30.5 | 0.5 | 0.5 | - |
| G. Mennen Williams | 40.5 | - | - | - | - | - | - |
| Hubert Humphrey | 26 | 26 | - | - | - | - | - |
| J. William Fulbright | 22 | 22 | - | - | - | - | - |
| Brien McMahon | 16 | - | - | - | - | - | - |
| James E. Murray | 12 | 12 | - | - | - | - | - |
| Harry S. Truman | 6 | 6 | 1 | 6 | - | - | - |
| Oscar R. Ewing | 4 | 4 | 3 | 3 | 3 | 3 | - |
| Paul Douglas | 3 | 3 | 3 | 3 | 3 | 3 | - |
| William O. Douglas | 0.5 | 0.5 | - | - | - | - | - |
| Not Voting | 1.5 | 1.5 | 1.5 | 1.5 | 2.5 | 2.5 | - |
General election[edit]
| Presidential candidate | Party | Home state | Popular vote[6] | Electoral vote[7] |
Running mate | |||
|---|---|---|---|---|---|---|---|---|
| Count | Percentage | Vice-presidential candidate | Home state | Electoral vote[7] | ||||
| Dwight David Eisenhower | Republican | New York | 34,075,529 | 55.18% | 442 | Richard Milhous Nixon | California | 442 |
| Adlai Ewing Stevenson II | Democratic | Illinois | 27,375,090 | 44.33% | 89 | John Jackson Sparkman | Alabama | 89 |
| Vincent Hallinan | Progressive | California | 140,746 | 0.23% | 0 | Charlotta Amanda Spears Bass | New York | 0 |
| Stuart Hamblen | Prohibition | Texas | 73,412 | 0.12% | 0 | Enoch Arden Holtwick | Illinois | 0 |
| Eric Hass | Socialist Labor | New York | 30,406 | 0.05% | 0 | Stephen Emery | New York | 0 |
| Darlington Hoopes | Socialist | Pennsylvania | 20,203 | 0.03% | 0 | Samuel Herman Friedman | New York | 0 |
| Douglas MacArthur | Constitution | Arkansas | 17,205 | 0.03% | 0 | Harry Flood Byrd Sr. | Virginia | 0 |
| Farrell Dobbs | Socialist Workers | Minnesota | 10,312 | 0.02% | 0 | Myra Tanner Weiss | California | 0 |
| Other | 9,039 | 0.02% | — | Other | — | |||
| Total | 61,751,942 | 100% | 531 | 531 | ||||
| Needed to win | 266 | 266 | ||||||
1956[edit]
Democratic primaries[edit]
1956 Democratic Party presidential primaries:[8]
- Adlai Stevenson II - 3,069,504 (50.70%)
- Estes Kefauver - 2,283,172 (37.71%)
- Unpledged delegates - 380,300 (6.28%)
- Frank J. Lausche - 278,074 (4.59%)
- John W. McCormack - 26,128 (0.43%)
- Dwight D. Eisenhower - 6,358 (0.11%)
- W. Averell Harriman - 3,368 (0.06%)
- Robert Meyner - 1,129 (0.02%)
- John F. Kennedy - 949 (0.02%)
- Harry S. Truman - 728 (0.01%)
- Stuart Symington - 402 (0.01%)
- Paul A. Dever - 207 (0.00%)
- Lyndon B. Johnson - 2 (0.00%)
- Others - 3,610 (0.06%)
Democratic National Convention balloting[edit]
| 1956 Democratic National Convention presidential balloting[9] | |
|---|---|
| Contender | Vote |
| Adlai Stevenson | 905.5 (65.9%) |
| W. Averell Harriman | 210 (15.31%) |
| Lyndon B. Johnson | 80 (5.83%) |
| Stuart Symington | 45.5 (3.32%) |
| Happy Chandler | 36.5 (2.66%) |
| James C. Davis | 33 (2.41%) |
| John S. Battle | 32.5 (2.37%) |
| George Bell Timmerman | 23.5 (1.71%) |
| Frank J. Lausche | 5.5 (0.4%) |
General election[edit]
| Presidential candidate | Party | Home state | Popular vote[10] | Electoral vote[11] |
Running mate | |||
|---|---|---|---|---|---|---|---|---|
| Count | Percentage | Vice-presidential candidate | Home state | Electoral vote[11] | ||||
| Dwight David Eisenhower (Incumbent) | Republican | Pennsylvania | 35,579,180 | 57.37% | 457 | Richard Milhous Nixon | California | 457 |
| Adlai Ewing Stevenson II | Democratic | Illinois | 26,028,028 | 41.97% | 73 | Carey Estes Kefauver | Tennessee | 73 |
| (Unpledged electors) | (n/a) | (n/a) | 196,318 | 0.32% | 0 | (n/a) | (n/a) | 0 |
| Thomas Coleman Andrews | States' Rights | Virginia | 108,956 | 0.18% | 0 | Thomas Harold Werdel | California | 0 |
| Eric Hass | Socialist Labor | New York | 44,300 | 0.07% | 0 | Georgia Olive Cozzini | Wisconsin | 0 |
| Enoch Arden Holtwick | Prohibition | Illinois | 41,937 | 0.07% | 0 | Edwin M. Cooper | California | 0 |
| Farrell Dobbs | Socialist Workers | New York | 7,797 | 0.01% | 0 | Myra Tanner Weiss | California | 0 |
| Harry Flood Byrd Sr. | States' Rights | Virginia | 2,657 | <0.01% | 0 | William Ezra Jenner | Indiana | 0 |
| Darlington Hoopes | Socialist | Pennsylvania | 2,128 | <0.01% | 0 | Samuel Herman Friedman | New York | 0 |
| Henry B. Krajewski | American Third | New Jersey | 1,829 | <0.01% | 0 | Anna Yezo | New Jersey | 0 |
| Gerald Lyman Kenneth Smith | Christian Nationalist | Michigan | 8 | <0.01% | 0 | Charles Robertson | Michigan | 0 |
| Walter Burgwyn Jones | Democratic | Alabama | —(a) | —(a) | 1 | Herman Eugene Talmadge | Georgia | 1 |
| Other | 8,691 | 0.01% | — | Other | — | |||
| Total | 62,021,328 | 100% | 531 | 531 | ||||
| Needed to win | 266 | 266 | ||||||
1960[edit]
Democratic primaries[edit]
1960 Democratic Party presidential primaries:[12]
- John F. Kennedy - 1,847,259 (31.43%)
- Pat Brown - 1,354,031 (23.04%)
- George H. McLain - 646,387 (11.00%)
- Hubert Humphrey - 590,410 (10.05%)
- George Smathers - 322,235 (5.48%)
- Michael DiSalle - 315,312 (5.37%)
- Unpledged delegates - 241,958 (4.12%)
- Albert S. Potter - 208,057 (3.54%)
- Wayne Morse - 147,262 (2.51%)
- Adlai Stevenson - 51,833 (0.88%)
Democratic National Convention balloting[edit]
| 1960 Democratic National Convention presidential balloting | ||
|---|---|---|
| Candidate | Votes | Percentage |
| John F. Kennedy | 806 | 52.89% |
| Lyndon B. Johnson | 409 | 26.84% |
| Stuart Symington | 86 | 5.64% |
| Adlai Stevenson | 79.5 | 5.25% |
| Robert B. Meyner | 43 | 2.82% |
| Hubert Humphrey | 41 | 2.76% |
| George A. Smathers | 30 | 1.97% |
| Ross Barnett | 23 | 1.51% |
| Herschel Loveless | 2 | 0.13% |
| Pat Brown | 1 | 0% |
| Orval Faubus | 1 | 0% |
| Albert Rosellini | 1 | 0% |
| Abstentions | 1.0 | 0.00% |
Maps[edit]
-
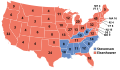 1952 presidential election
 -
 1956 Democratic presidential primaries
 -
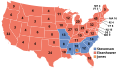 1956 presidential election


References[edit]
- ^ Illinois Blue Book 1947-1948. Illinois Secretary of State. p. 747. Retrieved 29 March 2020.
- ^ Illinois Blue Book 1949-1950. Illinois Secretary of State. pp. 745–46, 785. Retrieved 29 March 2020.
- ^ Illinois Blue Book 1951-1952. Illinois Secretary of State. pp. 757–758. Retrieved 31 March 2020.
- ^ "Our Campaigns - US President - D Primaries Race - Feb 01, 1952". www.ourcampaigns.com.
- ^ Richard C. Bain and Judith H. Parris, Convention Decisions and Voting Records
- ^ Leip, David. "1952 Presidential Election Results". Dave Leip's Atlas of U.S. Presidential Elections. Retrieved September 16, 2012.
- ^ "Electoral College Box Scores 1789–1996". National Archives and Records Administration. Retrieved August 1, 2005.
- ^ "Our Campaigns - US President - D Primaries Race - Feb 01, 1956". www.ourcampaigns.com.
- ^ Richard C. Bain and Judith H. Parris, Convention Decisions and Voting Records, pp. 294–298
- ^ Leip, David. "1956 Presidential Election Results". Dave Leip's Atlas of U.S. Presidential Elections. Retrieved August 1, 2005.
- ^ "Electoral College Box Scores 1789–1996". National Archives and Records Administration. Retrieved August 1, 2005.
- ^ "Our Campaigns - US President - D Primaries Race - Feb 01, 1960". www.ourcampaigns.com.