STRATEGIC MANAGEMENT ANALYSIS
This analysis covers the comprehensive range of Wal-Mart’s operations. This includes its history, mission statement, and strategy. This paper discusses and evaluates the retail industry as a whole, and includes a thorough analysis of Wal-Mart’s recent financial and marketing performance. After an analysis of Wal-Mart’s performance, the team’s report investigates its current strengths, weaknesses, opportunities, and threats. From this, the team identified the major problem that the company is currently facing as well as potential solutions. This report also includes both an implementation and contingency plan for the selected solution to the major problem.
WAL-MART
Spring 2017, Strategic Management
Scott Schwend, Quan Tran, Alex Ward, and Kevin Wu
Executive Summary
In 1962, Sam Walton opened up the first Wal-Mart store in Rogers, Arkansas. Success came quickly to the company. Although Walton died in 1992, the company has continued to grow, mostly spurring from acquisitions, although the company expanded internally as well. By July 2016, Wal-Mart was listed as the largest company in the world, generating $482 billion in annual revenue.
Wal-Mart’s corporate mission statement is “Saving people money so they can live better.” Although it not very specific, the statement is sufficient in identifying Wal-Mart’s approach to pleasing customers, which is saving them money. Three main points make up Wal-Mart’s current strategy: increasing focus on customer service, improving groceries, and enhancing the flexibility of the shopping experience. The company has done so through increased training and higher wages, improved selection of organic foods, and implementation of alternative shopping methods.
In the future, Wal-Mart will likely expand into several trends. For one, Wal-Mart should add the ability for customers to pay with mobile payment as a widespread option. Apple Pay certainly is continuing to increase in usage and popularity, so it is important that Wal-Mart adhere to that trend. Furthermore, Wal-Mart should invest more money into improving its omnichannel strategy, including improving and more so integrating its in-store, online, and mobile shopping experiences. It should work to improve its mobile application into a more convenient method of purchase for the consumer and one that the consumer will choose over in-store or online every time. Wal-Mart should also improve its social media and online presence, interacting more with its customers. Creating personal connections with consumers is becoming more and more prevalent for companies in the social media and internet age. Finally, Wal-Mart should improve its shipping process to reduce its shipping time and compete with Amazon Prime’s two-day shipping advantage.
Wal-Mart has many competitors across the globe. It has intense competition both domestically and internationally, and a lot of competitors use the same low-price strategy that Wal-Mart does. Amazon is Wal-Mart’s largest competitor and is still growing. To compete with Amazon, Wal-Mart must improve its e-commerce and make it a necessary for its customers. Wal-Mart has its own position on a strategic group map, proving itself to be the world’s biggest retailer. It operates with the most distribution channels out of any other company in the industry, with a global presence and the highest sales in the United States.
Looking at a Porter’s five forces analysis of the retail industry, a few things are apparent. Overall, the retail industry is not an attractive industry for new entrants. There is intense competition, strong threats of substitutes, moderate-to-strong buyers’ bargaining power, and weak suppliers’ bargaining power.
Looking at the industry forecast, it is apparent that holiday sales’ growth in 2016 was higher than in 2015. The 2017 year-long retail growth is expected to be 3.9% in the US. A possible good impact of this for Wal-Mart is a surge in online sales and a possible tax cut. Furthermore, retail sales are expected to grow both domestically and globally.
Wal-Mart provides products that span nearly all consumer needs and at highly competitive prices. The company purchases in extremely high quantities in order to keep its prices low, and does so through a variety of sourcing channels in-house and externally. The company pursues a cost leadership strategy, which it achieves with economies of scale and by utilizing technology and labor efficiency to bring down the costs of doing business. It also leverages its low prices as a selling point, as having inexpensive products is the most appealing asset for its customers. The company advertises its low prices through all of the normal marketing mediums. Wal-Mart has a substantial presence across the United States and internationally, with 10,020 retail locations across 28 countries. Wal-Mart sells under 60 different banners that each cater to different customers.
Wal-Mart’s most important market segments are price value affluent shoppers and price sensitive affluent shoppers. According to Business Insider, Wal-Mart’s average shopper is white, female, approximately 50 years old, and has an annual household income of $55,000. However, Wal-Mart does not target any direct audiences and keeps its targeting broad, because all consumers benefit from lower prices. Lower income groups find the most value in shopping at Wal-Mart because of its low-price strategy.
Market penetration is Wal-Mart’s main intensive strategy. Market development is Wal-Mart’s second intensive strategy. Product development is its third-most intensive strategy.
The key financial ratios reveal that Wal-Mart is a healthy company; however, it has not experienced much growth in recent years. Compared to the five other industry members that the team selected, Wal-Mart ranks in the middle in most of the financial statistics. Recently, Warren Buffett’s Berkshire Hathaway sold off about $900 million worth of stock in Wal-Mart. Buffet stated that he does not believe that traditional retailers like Wal-Mart will be able to survive in the future. He also stated that he believes Amazon will continue to disrupt the market of traditional retailers by continually increasing its market share, a statement that could be cause for concern as the market typically puts substantial weight on Buffet’s opinions, otherwise known as the “Buffet effect.”
Wal-Mart’s strengths include its unique marketing position as leader, technological advantages, operational progress, economies of scale, highly effective retail expansion strategy, and strong ecommerce presence. Wal-Mart’s weaknesses include its low degree of flexibility in product development, low differentiation of company-developed products, disproportionately high fixed costs for product sourcing, low return on investment for its acquisition of Jet.com, low technological advantage, low margins, and semi-poor public relations. Wal-Mart’s opportunities include diversifying in other large scale businesses, diversifying and improving its reach through e-commerce, investing in the manufacturing industry, increasing its corporate citizenship, expanding into the discount retail space, and furthering international expansion. Wal-Mart’s threats include competition in the industry, overall price competition, resistance over its wages, criticism over its unionization policies, protests, and change in government policy.
The major problem facing Wal-Mart is the growing number of retail purchases that are occurring online. The first proposed solution for Wal-Mart is for it to convert some of its current stores into distribution centers. The second proposed alternative is for Wal-Mart to implement a paid membership plan for its customers, in which members could enjoy free same-day shipping and delivery on its online orders. The third proposed alternative is to implement a delivery service from online sales straight out of stores. Another potential solution for Wal-Mart is to integrate the use of Jet.com into its online sale operations. A final potential solution is the combination of solutions three and four, or implementing a delivery service from online sales straight out of stores and implementing Jet.com into its online sales operations.
The team chose solution five as the best solution. This solution not only addresses the issue of a sub-par website for online sales, but also provides a direct advantage over other retailers (online or not) with the fast delivery service. To implement this plan, Wal-Mart would incorporate Jet’s practice into Wal-Mart and vice versa. This could be accomplished by sending Jet’s engineer to Wal-Mart’s online retail department and sending Wal-Mart’s logistics experts to Jet. Furthermore, to implement same-day delivery, Wal-Mart would turn its stores into distribution centers when needed and purchase delivery vehicles. The service would be available to online customers whose orders reach a minimum requirement in terms of amount and delivery distance. The delivery would be provided at an additional fee, and this fee would either be flat or vary depending on the distance. However, this service would be provided on only a certain number but not all products. In case this plan starts to backfire, Wal-Mart could sell Jet if it keeps losing the company money, liquidate delivery vehicles and relating assets if the delivery service does not make economic sense, and/or liquidate all assets and file bankruptcy in the extreme case, which is unlikely to happen.
Company History
In 1962, Sam Walton opened up the first Wal-Mart store in Rogers, Arkansas. Success came quickly to the company. By 1967, the Walton family owned 24 stores that generated $12.7 million in sales. In October 1969, Wal-Mart announced its establishment as a corporation in the state of Delaware. In 1970, less than ten years after Sam Walton opened the first store, Wal-Mart became publicly traded. At the time, Wal-Mart’s shares traded at $16.50 (Our History). In 1977, Wal-Mart made its first corporate acquisition of a store that was actively in business by assuming ownership of Mohr-Value stores (Wal-Mart Stores, Inc.). Mohr-Value operated in Missouri and Illinois and previously purchased Carp’s Super stores in 1973, which had operations in Kirksville, Missouri as well as other rural Missouri towns (Cape Store Purchased).
The first Sam’s Club opened in Midwest City, Oklahoma in 1983. Sam’s Club is a membership-based wholesale shop aimed at providing products in bulk to small businesses and individuals. The first Wal-Mart Supercenter opened in Washington, Missouri in 1988. Wal-Mart Supercenters were designed to be one-stop-shops for customers and include a wide breadth of departments, such as groceries, clothing, oil, and tire service shops, optical centers, photo-processing labs, and more. Some Supercenters have brought in other services that are operated within the store such as hair salons, banks, and fast-food restaurants. In 1988, Sam Walton stepped down from his role as Chief Executive Officer and David Glass stepped in as his replacement. Although Walton was no longer CEO, he remained actively involved with the company’s decisions and strategy until his death in 1992 (Our History).
By 1990, Wal-Mart became the number-one retailer in the United States. In 1991, Wal-Mart established its first international store as Sam’s Club in Mexico City through a joint venture with Cifra, a Mexican retail company. The following year, Wal-Mart expanded into Canada through the acquisition of 122 Woolco stores. In 1993, Wal-Mart experienced its first week of $1 billion in sales. Wal-Mart continued its international expansion and in 1996, opened its first store in China. In 1997, the company experienced its first $100 billion sales year. In 1988, Wal-Mart tapped into the United Kingdom market through the acquisition of Asda. In the same year, Wal-Mart introduced the Neighborhood Market store format, which was more focused on groceries than its parent company’s other stores and was intended to provide easier parking, less crowded aisles, and a faster checkout (Our History).
By the year 2000, Wal-Mart employed more than 1.1 million associates worldwide. In the same year, H. Lee Scott Jr. succeeded Glass as CEO and Wal-Mart.com was established, allowing customers to shop online. In 2002, Wal-Mart broke into the Fortune 500. In 2004, Wal-Mart entered into a partnership with Seiyu Group, a retail merchant in Japan. Wal-Mart.com launched its Site to Store service in 2007, which allows customers to order products via the company’s website with in-store pickup. In 2009, Mike Duke took over as CEO and the company tapped into Chile by becoming a majority owner in D&S S.A., an import and distribution company (Our History).
In 2010, Wal-Mart and Bharti Enterprises joined forces to create Bharti Wal-Mart in India. Although the two companies split in 2013, Wal-Mart has continued to operate in India (Leob). Wal-Mart acquired South African MassMart in 2011, which placed the company at over 11,000 retail stores worldwide. In 2014, Wal-Mart’s current CEO Doug McMillion took over from Mike Duke. By 2014, Wal-Mart employed 2.4 million associates and operated more than 11,000 stores in 27 countries. Wal-Mart also served an average of 200 million customers every week (Our History). By July 2016, Wal-Mart was listed as the largest company in the world, generating $482 billion in annual revenues (Yeomans). In order to better compete with Amazon, Wal-Mart acquired Jet.com in 2016 for $3 billion with hopes of improving online sales (Rey).
While Wal-Mart has had tremendous success since its inception, the company has had its fair share of problems. The company has remained union-free throughout its history, despite being the nation’s largest employer (Dickinson). Wal-Mart’s success in preventing its employees from unionizing, although legal, has been a source of controversy. The company has been accused of threatening to permanently replace employees that unionize, which is allowed under federal law (Dickinson). Wal-Mart has tried to address employee relation issues. In 2015, Wal-Mart raised its national starting wage to $9 per hour, $1.75 per hour higher than the federal minimum wage at the time (Ritholtz). Wal-Mart also experienced trouble trying to establish relations with consumers in countries such as Russia, Germany, South Korea, and India (Lutz).
A Wal-Mart store in Monticello, New York resulted in bad publicity for the company. The store received four consecutive health inspections for rodent infestation, and the story made national news (Wyrich). A 2005 documentary titled “Wal-Mart: The High Cost of Low Prices” was aimed at convincing shoppers to boycott Wal-Mart (Roten). While the company challenged and denied many of the statements made in the film, many of them stuck with consumers for some time. Wal-Mart has also faced a number of lawsuits. Recently, the company reached a $35 million settlement with Washington state workers who claimed that they were forced to skip meal and rest breaks while on the clock (Johnson).
Although Wal-Mart has experienced a number of issues throughout its history, litigation and employee wage discrepancies can be seen in a number of other corporate companies. Wal-Mart has found itself amidst controversy in the past; regardless, the unprecedented growth and success of Sam Walton’s retail business cannot be ignored. Wal-Mart has revolutionized the retail industry on its way to becoming the largest company in the world.
Corporate Mission and Current Strategy
Wal-Mart’s corporate mission statement is “Saving people money so they can live better.” This holds a striking resemblance to the company’s ad slogan, “Save money. Live better.” “The ideal mission statement identifies the company’s product or services, specifies the buyer needs it seeks to satisfy, identifies the customer groups or markets it is endeavoring to serve, specifies its approach to pleasing customers, sets the firm apart from its rivals, and clarifies the firm’s business to stakeholders” (Thompson, 24). The statement does a good job of identifying Wal-Mart’s approach to pleasing customers, which is saving them money.
Wal-Mart’s mission statement does not mention its products or services. This may be due to its large product diversity and most consumers’ preexisting knowledge about the company. The statement also fails to address the customer group(s) it is seeking to serve. While Wal-Mart may have the goal to serve everyone, its statement does not specifically identify this goal; however, realistically serving everyone is not possible. Wal-Mart is not typically a store at which the affluent shop; according to Business Insider, the average Wal-Mart shopper has a household income of $53,125 (Peterson). Therefore, a mission statement focusing on the middle class may be more beneficial. Wal-Mart’s mission statement also does not differentiate the company from its competitors. For example, Amazon’s mission statement is, “We strive to offer our customers the lowest possible prices, the best available selection, and the utmost convenience.” (Gregory) Wal-Mart and Amazon’s mission statements both involve saving their consumers' money, while Amazon also touches on its selection and convenience. It is clear that Wal-Mart’s mission statement does not set it apart from competitors.
The mission statement also fails to identify Wal-Mart’s business to its stakeholders. It does not even address that the company is in the retail industry; a blanket statement regarding saving people money could potentially apply to any business. The vagueness in this area of the mission statement could be a result of the breadth of products and services that Wal-Mart provides. The statement also fails to specify the buyer needs it seeks to satisfy. “Saving money” would not be considered a need, but rather a want. The needs Wal-Mart satisfies would likely come from the wide array of products it provides.
A company’s mission statement must be of high quality and should serve as a guide for actions taken by the organization. Wal-Mart’s mission statement is poorly structured and lacks specificity of any kind. Strategic Management Insight rated the statement at 1.2/4.5, remarking that it “sounds more like a slogan than a true mission” (Jurevicius). It provides too little information about the core purpose of the business. While a poor mission statement does not result in the demise of a company, the lack of quality in the statement could hinder the business decisions of employees from the corporate down to the associate levels.
CEO Doug McMillion has changed the corporate strategy since taking over the position in 2014 (Dudovskiy). The new strategy focuses on three main points: increasing focus on customer service, improving groceries, and enhancing the flexibility of the shopping experience (Dudovskiy). In order to increase customer service, Wal-Mart is trying to make itself a more attractive place to work. By increasing its minimum wage to $9 per hour, setting fixed schedules for employees, and offering a six-month training program, Wal-Mart hopes to attract better workers that can provide quality service to its customers (Lutz). Additionally, by offering more extensive training, Wal-Mart hopes to retain workers for a longer period of time. According to Business Insider, “the company is also looking into expanding its ‘Checkout Promise,’ a program that guarantees registers are fully staffed during peak hours” (Lutz).
With a recent shift of general consumers becoming more health-conscious, Wal-Mart hopes to improve its groceries by offering fresher products and more organic options (Lutz). The biggest obstacles in offering more organic alternatives include finding ways to offer them at low prices and the insufficiency of supply. Organic food products generally cost more than nonorganic products to produce, and therefore are usually sold at higher prices. Additionally, the recent soar in demand for organic products has domestic producers falling short of demand (Roseboro). Wal-Mart held a deal with Yucaipa for two years to sell Wild Oats organic products. In 2016, Wal-Mart announced that it would phase the Wild Oats brand out and turn to its store brand Great Value to produce organic products (Nassauer). By producing its own organic products, Wal-Mart might be able to remedy both its price and supply issues.
By stating that it wants to enhance the flexibility of the shopping experience, Wal-Mart is implying that its customers should have the power to choose how they want to shop. In 2016, Wal-Mart announced that it would offer curbside grocery pickup at 600 locations (Picchi); customers would be able to order online and pick up their groceries without ever going outside. Additionally, Wal-Mart does not plan to charge extra for this service (Picchi). Last year, Wal-Mart announced it would begin testing grocery delivery by using Uber, Lyft, and Deliv to take customer orders to their homes (Perez). The grocery delivery service is being tested first in Denver and Phoenix from Wal-Mart and Sam’s Club stores (Perez). Wal-Mart has also increased customer flexibility through the recent announcement of free two-day shipping on purchases over $35 (Jones). This strategic plan positions the company well against Amazon, which currently offers free two-day shipping for Amazon Prime members, requiring a $99 annual subscription (Jones). By providing more options to customers, Wal-Mart is making progress toward its strategic goal of giving customers more flexibility.
Industry Analysis
Future Outlook and Trend
Today, there are many retailers competing with each other selling the same products. They compete not only in price, but also in unique product features and in the race of adopting new technology. In the 21st century, technology has advanced at a fast pace, and has significantly changed the way people and corporations function. For example, for the past 15 years, most people have no longer used cash and check, but instead used credit and debit card. Going into 2017, experts believe that mobile payment will become the next big adoption from retailers around the world (“12 Forecasts”). According to TechCrunch, 70% of all US customers with mobile phones will utilize this technology in 2017. Mobile payments are expected to account for $60 billion in sales, a number projected to grow to $503 billion by 2020, according to Business Insider (“12 Forecasts”). Therefore, retailers will soon switch to this method of payment, unless they want to fall behind and lose sales to competitors.
The rise of the Internet has also changed the way people shop, as more and more people are shopping online instead of in-store. Thus, retailers will spend more money on improving their omnichannel strategies because it has become a new standard for the industry (“12 Forecasts”). Besides traditional physical stores and online websites, businesses have also started selling their product through mobile applications and social networks. Furthermore, the movement toward online shopping will also lead to another race in personalization. Retailers have realized that personalization has become more and more important to customers, who want to shop where they not only are addressed by name, but also can get recommendations on products based on their shopping histories and other digital footprints. Therefore, retailers will continue investing in building algorithms and artificial intelligence to give their customers a uniquely personalized shopping experience. Finally, shipping time will also be important in deciding the sales of a company. Since free shipping is no longer an advantage but rather a requirement for online retailers, they will attempt to beat their competitors in terms of speed to get more customers (“12 Forecasts”).
Analysis of Competitors
Domestic Competitors
The retail industry in the United States has a decent amount of competitors. Thus, the competitor analysis is conducted on Wal-Mart’s major competitors to quantify the competition intensity.
Target Corporation, the second largest general merchandise retailer in the United States, is considered one of the direct competitors to Wal-Mart. Target also pursues a low price strategy. Its brand is associated with “expecting more and paying less.” Target Corporation has 1,802 stores throughout the United States and has plans to open more stores in the next few years (“Corporate Fact Sheet”). Besides physical stores, customers can also shop online on its website and mobile application (“The shopping experience”). The company sells everything from groceries and household appliances to apparels and electronics, which is very similar to Wal-Mart’s one-stop shop approach. Furthermore, it also has a wide distribution network, with 38 distribution centers in the United States (“Corporate Fact Sheet”).
Dollar General Corporation operates as a discount retailer in southern, southwestern, midwestern, and eastern United States. As of October 2016, Dollar General has a total of 13,205 stores operating in 43 states. The company sells various products, including consumable products, packaged food products, perishables, snacks, health and beauty products, pet products, tobacco products, seasonal products, home products, and apparel (“Dollar General Corporation”).
Dollar Tree, Inc., a discount retailer, operates the Dollar Tree and Family Dollar chain in the United States and Canada. The Dollar Tree chain sells a variety of products at $1, comprising consumable merchandise, everyday consumables, and seasonal goods, whereas the Family Dollar chain provides consumable merchandise, home products, apparel, seasonal products, and personal electronics. As of January 30, 2016, Dollar Tree, Inc. has a total of 13,851 stores, 21 distribution centers, and two store support centers in the United States (“Dollar Tree, Inc.”).
Costco Wholesale Corporation operates membership warehouses and is a direct competitor to Wal-Mart’s Sam’s Club. Costco provides both branded and private-label merchandise in various categories, ranging from packaged foods and groceries to appliances and electronics. As of August 2016, Costco sold its products through a network of 501 warehouses all over the United States and through its website. In addition, Costco operates in international markets, including Puerto Rico, Mexico, Canada, United Kingdom, Korea, Japan, Taiwan, Spain, and Australia (“Costco Wholesale Corporation”).
Amazon is emerging as a big threat to Wal-Mart in many ways. Amazon provides products from vendors and third-party sellers, and allows anyone to sell their products on Amazon’s website (“Amazon.com, Inc.”). Customers can buy a wide variety of products on Amazon’s website, ranging from essential and everyday products to electronics and entertainment products. Amazon also offers Amazon Prime, a subscription plan that lets customers enjoy free two-day shipping on over 50 million eligible items and expose themselves to a huge collection of movies, music, and books. In addition, Amazon has started providing same-day delivery and 2-hour delivery to customers in certain areas (“Amazon Prime”).
International Competitors
In the international markets, Wal-Mart also faces competition from other big global corporations.
Tesco PLC is a British corporation and one of the largest retailers in the world. It has opened 6,902 stores in 11 countries in Europe and Asia, including United Kingdom, India, Malaysia, Thailand, Czech Republic, Hungary, Ireland, Poland, Slovakia, Turkey, and China. The products it provides range from groceries to general products (“About Us”).
Carrefour is a French multinational retailer. Besides operating in e-commerce and m-commerce, it operated 11,935 physical stores in over 30 countries under the group banners in multiple formats, including 1,462 hypermarkets, 3,227 supermarkets, 7,075 convenience stores, and 171 cash and carry stores as of December 2016, serving more than 100 million customer households around the world (“Key Figures”). Carrefour’s principle is to provide customers a wide selection of high-quality products at the lowest price possible (“Quality at the Best Value”).
Metro Group is a Germany-based multinational wholesale corporation . It has business in three segments, consisting of Metro Cash&Carry, Media-Saturn, and Real. Metro Cash&Carry has two smaller brands, Metro and Makro, which provide wholesale business to professional customers, whereas Media-Saturn is a consumer electronics retailer. The Real segment, on the other hand, operates as a hypermarket, selling different goods ranging from fresh products to non-food items through its network of physical stores and website(“Metro AG”). As of December 2016, Metro has expanded its business to most of Europe and Asia (“Location worldwide”).
Strategic Group Map
The strategic group map is graphed to access the market position of selected retailers in the industry. The map is constructed using two variables, which are the distribution channels and geographic coverage. The data of the selected retailers is shown in Appendix 1.

Exhibit 1. Strategic Group Map of Selected Retailers
Porter’s Five Forces Analysis
Here the Porter’s five forces analysis is conducted to give a better understanding about the competitive pressure on Wal-Mart in the retail industry.
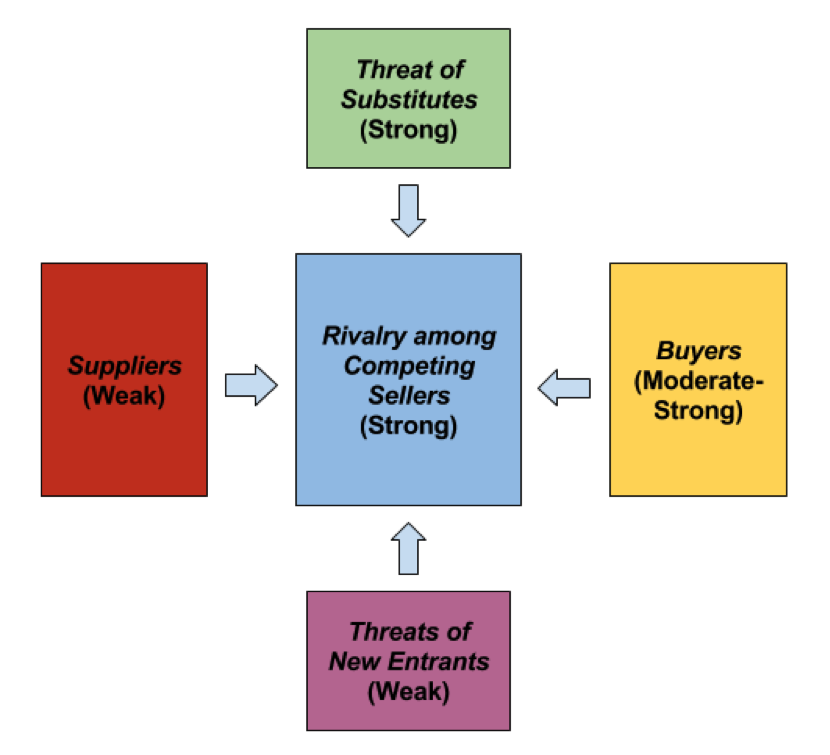
Exhibit 2. Porter’s Five Forces Analysis
Rivalry among Competing Sellers (Strong): Rivalry in the retail industry is strong among competitors because there are low switching costs for customers moving between retailers. Furthermore, there are a high number of competitors in the industry which pursue the same strategy. For example, Wal-Mart and Target both pursue a low-price strategy to attract customers.
Threat of New Entrants (Weak): In the retail industry, established companies have many cost advantages that are difficult for a new entrant to establish, including economy of scale, partnership with suppliers, and favorable locations. In addition, entering the retail industry requires new companies a high capital investment to compete with the already established retailers. Therefore, the threat of new entrants in the retail industry is weak.
Threats of Substitutes (Strong): The threat of substitutes is strong, as traditional brick-and-mortar stores are now losing sales to online retailers. Due to technological advancement, online shopping is easier everywhere around the world.
Suppliers’ Bargaining Power (Weak): Suppliers’ bargaining power is weak to Wal-Mart, because of the high number of suppliers in the market. In addition, Wal-Mart could switch to another supplier with ease because of the variety of available substitutes. Lastly, Wal-Mart is a big retailer, which helps its suppliers sell a large volume of product, so they will not want to hurt their relationship with Wal-Mart.
Buyers’ Bargaining Power (Moderate-strong): This is due to the abundance of retailers in the industry and low switching costs. Furthermore, most of the products provided by Wal-Mart are standardized products, which consumers can easily find at other retailers’ locations. Although buyers’ power reduces slightly because most of their purchases are essential goods such as groceries, this is only a minor factor since there are many substitute grocery stores in the industry.
Industry Forecast
The domestic retail industry did relatively well in 2016, especially in the online segment. During the holiday season, total holiday sales increased by 3.4% from the previous year, which is higher than the 2.7% growth in 2015 (Payne). Dividing into online sales and in-store sales, 2016’s online sales grew by 14% compared to 2015’s online sales, whereas in-store sales rose by only 1.4% in the same period. However, recent trends indicate that customers are doing their holiday season shopping as early as October. If this is the case, 2016 holiday sales growth would be 3.6%. Going into 2017, the year-long growth of total retail sales excluding gasoline is expected to be 3.9%, which is about the same as in 2016. Online sales are surging, but may be offset by the slowdown in in-store sales with the shutdown of many physical stores throughout the United States. However, if there are any tax cuts in early 2017, customer spending could be positively influenced and sales growth in 2017 would end up being higher than expected. In case Congress does not pass the tax cut early enough, the sales boost would be pushed back and happen in 2018 (Payne). Globally, Statista expected the retail sales growth to be 3.3% and 3.4% in 2017 and 2018, respectively (“Forecast for global retail sales”).
Looking further, it is reasonable to expect that sales in the retail industry will continue to grow in the United States unless significant disruption occurs. According to Statista, there was an upward trend in the annual retail industry sales in the United States from 2000 to 2014. The only year that sales dropped was 2009, which was the year after the Great Recession. Sales in 2010 then quickly recovered back to where they were in 2008, during this time, the rest of the economy still struggled and could not do the same (“Annual retail industry sales”).

Exhibit 3. Forecast for global retail sales growth from 2008 to 2018 (Statista)

Exhibit 4. Annual retail industry sales in the United States from 2000 to 2014 (in trillion U.S. dollars) (Statista)
Marketing Analysis
Product
Wal-Mart’s product offerings consist of a wide variety of consumer goods spanning effectively all consumer needs. Wal-Mart provides these goods at highly competitive prices. It is important to note that Wal-Mart does not develop products independently, but instead purchases from other manufacturers (Soni, n.p.). Products are purchased in extremely high quantities, keeping prices low. Wal-Mart does this through a variety of sourcing channels, both in house and external. In 2015, Wal-Mart took actions to increase internal sourcing, opting to reduce its dependency on firms such as Li and Fung (Layne). Product sources are both domestic and international, with a growing focus on domestic sourcing in recent years. In 2013, Wal-Mart launched an initiative pledging to purchase $50 billion in domestic goods over the next 10 years (Wal-Mart Stores).
Price
Wal-Mart pursues a cost leadership strategy. The company utilizes economies of scale to create advantages, allowing the company to purchase large quantities of products at low prices. According to Basker, Wal-Mart saves approximately 2% in costs for every additional 10% of product purchased (5). Historically, Wal-Mart has used cost leadership to great effect by consistently offering lower prices than those of competitors (Basker 4). Logistically, Wal-Mart also utilizes technology and labor efficiency to bring down the costs of doing business; Wal-Mart’s leadership in this area has allowed it to maintain an edge over competitors, helping it establish sustainable cost leadership (Basker 32).
In recent years, Wal-Mart’s value-oriented image has deteriorated in the eyes of consumers. Price awareness has increased, primarily as a result of readily accessible information when researching consumer goods (Peterson). To combat this, Wal-Mart introduced competitive price matching, aimed at reestablishing its position as a price leader. Proprietary software Savings Catcher, which was implemented in 2014, automatically price matched Wal-Mart products to those of competitors (Wal-Mart Stores). Wal-Mart cited increased customer transparency and price confidence as a result of these changes. The company shifted policies in 2016, removing price matching from a substantial portion of its stores (Dudley). A new rollback program was implemented instead, claiming to reduce prices on a large portion of commonly price matched products (Gustafson). Since then, Wal-Mart’s performance has improved substantially, outperforming all major competitors in retail (Gustafson).
Wal-Mart leverages the fact that food, health, and beauty items are bought more frequently than other merchandise. Therefore, it keeps food prices low to gain traffic and expects that customers will buy more expensive items while they’re shopping for food (Gustafson). It also makes use of “fill-in trips,” or smaller trips to the grocery store between larger purchase trips in which customers buy necessities like milk, by placing baskets toward the front of the stores. Wal-Mart also recently implemented an expansion into its grocery pickup service that lets customers order their groceries online and pick them up in the store (Gustafson).
Promotion
Wal-Mart has consistently leveraged low prices as a main selling point. Inexpensive products are a cornerstone of the company’s appeal to customers. Advertising materials are utilized that emphasize lower costs (as compared to competitors), both on advertisements as well as through in-store branding and promotion (Basker 14).
Wal-Mart’s advertising materials exist along the entire spectrum of marketing materials. The company advertises on television, the internet, and in newspapers. Wal-Mart also has a steady online presence, with accounts on all popular social media sites (Dudley). Word-of-mouth and public relations are also key to the mix, although inside stores, Wal-Mart displays signage touting their “Everyday Low Prices” and showcase “rollbacks” where prices are reduced. Wal-Mart’s “Everyday Low Prices” strategy discourages customers from looking for promotions and specials. One way in which Wal-Mart has achieved lower prices is by asking vendors to stop mentioning its name in their ads, and instead direct marketing resources toward cutting prices (Dudley). If suppliers spend less money on promotion, they can pass the savings to Wal-Mart through retail. The company is also reducing its promotions for particular items within its stores. This particular strategy backfired when J.C. Penney Co. attempted it; the company lost billions of dollars and many customers (“As Not Seen on TV: Wal-Mart Dials Back on Ads in Low Price Push”).
Place
Today, Wal-Mart has a substantial physical presence across the United States and at an international level. According to Walmart’s annual report, the company has over 11,000 retail locations across 28 countries (9). The report also states there are 60 different banners that Wal-Mart sells under, catering to different consumers (19). Wal-Mart also differentiates stores based on regional needs. Wal-Mart has pursued four varieties of Wal-Mart stores: discount stores, supercenters, neighborhood markets, and express marts. The discount store format is the traditional Walmart store, which provides non-perishable consumer products. Supercenter stores consist of discount store offerings along with grocery, deli, and bakery goods spanning approximately 180,000 square feet (Garcia). Neighborhood markets are approximately 40,000 square feet in size and operate as small grocery stores, including convenience goods (Garcia). In 2016, Wal-Mart phased its express marts out of its marketing mix, as these stores functioned similarly to Walgreens and other convenience stores (Trefis Team). With this, the company is able to address multiple forms of consumer needs, allowing for Wal-Mart to reach and sell to a greater body of customers. It is important to note that within each store type, offerings remain consistent, allowing for all stores to remain functionally identical. Wal-Mart continues to expand domestically and internationally.
Segmentation, Targeting, Positioning
Segmentation
Wal-Mart’s most important segments are price value affluent shoppers and price sensitive affluent shoppers. According to Business Insider, just over 50% of Wal-Mart customers make under a $50,000 household income, and just over 25% make under a $25,000 household income (Peterson). Nearly 75% of Wal-Mart customers are white, non-Hispanic. Wal-Mart brings a steady spread of age groups 25 and older; 25-34, 35-44, 45-54, 55-64, and 65 and higher each represent about 18% of Wal-Mart’s age segments (Peterson). Wal-Mart’s two highest customer bases by generation are Baby Boomers and Generation X, with approximately 35% and 30% of its customer base, respectively. 75% of Wal-Mart shoppers are female. Overall, Wal-Mart’s average shopper is white, female, approximately 50 years old, and has an annual household income of $55,000. (Peterson).
Targeting
Wal-Mart’s targeting is fairly broad. All consumers benefit from lower prices, and their presence and product availability allow for many customers to shop at Wal-Mart. As a result of this, Wal-Mart does not directly target any audiences. However, certain demographics benefit more from this value proposition. Lower income groups shop more frequently at Wal-Mart, as opposed to retailers such as Target and Kohl’s (Mondrose). In recent years, Wal-Mart has seen increased success with millennials. Millennials “are the most value-driven generation that we’ve seen in my lifetime...they are very focused on value, which aligns well for Wal-Mart,” says Wal-Mart Chief Merchant Steve Bratspies (Wahba).
Positioning
Wal-Mart’s vision statement “We save people money so they can live better” establishes its position within the industry as the cost leader that everyone benefits from. This encompasses most, if not all, consumers.
Intensive Strategies
Market penetration is Wal-Mart’s main intensive strategy. This strategy involves selling more goods and services to the target market, which is often achieved by discounts, promotions, and special packages (Gustafson). Market development is Wal-Mart’s secondary intensive strategy. This strategy involves entering new markets to sell to new customers, which Wal-Mart achieves by establishing new stores domestically and overseas. Product development is Wal-Mart’s third intensive strategy, but it is utilized differently from most. Wal-Mart does not independently develop products, but the company constantly sources new products to offer in stores, which incurs costs that can be considered similar to that of development (Layne). This strategy is less of a factor than penetration and development. Wal-Mart’s revenues are not typically driven by innovation or new products. Everyday goods make up a large part of all sales and its grocery section alone is responsible for over half of its revenues (Ferguson).
Complete Financial Analysis
Income Statement
Starting with a high-level analysis of the income statement(s) for Wal-Mart over the last five years (which can be found in appendix 2), we can begin to get a grasp of the company’s financial performance in terms of profitability. We’re also able to take a look at the company’s performance and gain further insights based on the additional analyses we’ve conducted.
Revenue

Exhibit 5. Revenue (Data from Morningstar.com)
Starting at the top of the income statement, revenue increased every fiscal year from 2012 to 2015, then fell slightly in 2016. As shown in the chart above, revenue increased by 5% from 2012 to 2013. From 2013 to 2014 and 2014 to 2015, it increased once again, but at a slower rate of about 2%. The average percentage change during this time period was a positive 3%. The change in revenue from 2015 to 2016 was about negative 1%, Wal-Mart’s only decrease in revenue in the past five years. The decrease in revenue is relatively small and is not cause for concern in terms of growth for the company. Furthermore, the overall percentage change in revenue from fiscal year 2012 to 2016 is an increase of about 8%, which indicates significant growth for an already mature company.
Net Income

Exhibit 6. Net Income (Data from Morningstar.com)
The growth changes within net income have not correlated directly with the growth in revenue. From 2012 to 2013, net income increased significantly by 8%. Net income also increased modestly from 2014 to 2015 by 2%. However, from 2013 to 2014 and 2015 to 2016, net income dropped significantly. The drop was especially severe from 2015 to 2016, with a decrease of about 11%. The volatility of net income from 2012 to 2015 does not correlate with the relatively steady increases in revenue during the same period. While the 1% decrease in revenue from 2015 to 2016 correlates with the decrease in net income, the percentage changes are significantly different.
There are a number of elements that contribute to the income statement that can influence and explain the discord between revenue and net income. By looking at key factors and ratios derived from the income statement, explanations for these differences will likely become apparent. The ratios will be compared to Wal-Mart’s domestic competitors in order to anchor its performance against its competitors. Since some ratio results are relative, comparing them to others’ in the industry will illustrate a clearer picture of Wal-Mart’s financial performance. The domestic competitors used throughout this analysis are Target, Costco, Dollar General, Dollar Tree, and Amazon.
Gross Profit Margin

Exhibit 7. Gross Profit Margin (Data from Morningstar.com)
The gross profit margin, also referred to as gross margin, represents the percentage of revenues that remain after the cost of sales is accounted for. The sales that remain are viewed as the revenue available to cover operating expenses in order to maintain profitability. Thus, companies always desire a higher gross profit percentage because it provides potential for greater profitability. Typically, the gross profit percentage should trend upward as companies become more efficient and build economies of scale.
Over the past five years, Wal-Mart’s gross profit percentage has hovered around 25%, with no dramatic increases or decreases. Another way to interpret the gross profit percentage of 25% is that on average, each dollar of sales is associated with 75 cents in costs. The steadiness of Wal-Mart’s gross profit is a positive in terms of predictability. Although investors would likely prefer to see an increase in the margin, the steadiness of the margin during times of fluctuating revenues makes financial results more predictable for Wal-Mart. One reason the company’s gross margin has experienced little change over the last five years may be a result of its stage in the business life-cycle. Wal-Mart is past the stage of rapid growth and is likely in the maturity or potentially slight decline stage. Wal-Mart has always been known for its proficiency in logistics and ability to obtain products at low costs. The purchasing power and logistic improvements may have reached diminishing returns, or have maximized their current potential. If so, it is possible that Wal-Mart may not experience substantial growth until a future breakthrough occurs.
Compared to domestic competitors, Wal-Mart’s gross profit margin is below average. For the past five years, the domestic industry average has been around 26-27%, while Wal-Mart has trailed slightly at about 25%. From 2012 to 2015, Dollar Tree had the highest margin amongst these competitors. Dollar General had the second highest from 2012 to 2014. However, in 2015, Amazon finished with the second highest gross profit margin, surpassing Dollar General. In 2016 Amazon finished with the highest gross profit percentage at about 35.1%. Target ranked in the middle of its competitors in each of the past five years, with little variation in its gross profit margin. Costco had the lowest gross profit margin in each of the last five years; in each year, Costco’s margin percentage was only about half as big as Wal-Mart’s, the next lowest.
Operating Profit Margin

Exhibit 8. Operating Profit Margin (Data from Morningstar.com)
The operating profit margin, also known as the return on sales, is a measure of the percentage of sales that remain after taking into account operating expenses. Operating expenses are incurred by a company during its day-to-day operations but may not be directly tied to the cost of goods sold. Some examples include utilities, wages, depreciation, and sales commissions. The operating profit, the amount left over after operating expenses are taken into consideration, is also known as earnings before interest and taxes, or EBIT. Thus, by not taking the interest and tax expenses into consideration, EBIT gives us an idea of the profitability of the company’s current operations.
Wal-Mart’s operating profit margin is below its competitors’. The industry average is around 6-7%, while Wal-Mart’s ranges from 5% to 6%. This indicates that Wal-Mart has relatively higher operating expenses as compared to the average of the competitors. Wal-Mart’s operating profit margin has decreased over the last five years, which is similar to the industry as a whole. One reason behind this could be increasing wages of retail employees, which would cause an increase in operating expenses, thus lowering the operating profit margin. Target’s operating profit margin has been trending in a similar fashion over the last five years, which is likely to be influenced by similar causes.
Dollar General and Dollar Tree have high operating profit percentages compared to their competitors. Once again, wages may be a significant factor in this. Dollar General and Dollar Tree both typically have much less employees working in their stores than Wal-Mart and Target. When all of the stores in the country are taken into account, the differences in wage expenses are likely to be significant. Amazon, which does not have the brick and mortar stores that its competitors do, still has the lowest operating profit margin of the companies selected. While Amazon may not have employees working the floors of a store, it still has significant wage expenses due to warehouse workers. Furthermore, the warehouses and machinery required for Amazon’s operations are a significant source of depreciation, which also increases operating expenses.
Net Profit Margin
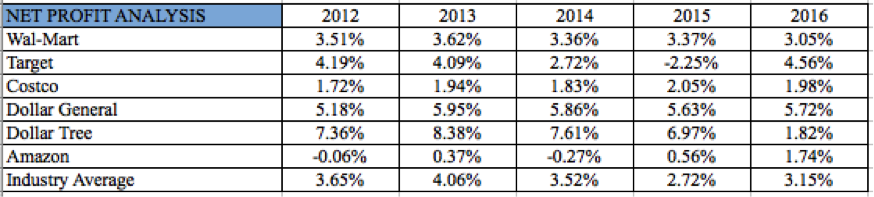
Exhibit 9. Net Profit Margin (Data from Morningstar.com)
The net profit margin is the after-tax and interest profit of a firm and can be interpreted as a percentage per dollar of sales. Unlike the operating profit margin, the net profit margin takes both the interest and tax expenses into consideration. The changes from operating profit to net profit can reveal the interest expense of a company, which partially reveals its debt obligations. Wal-Mart’s net profit percentage ranges from around 3% to 3.5% over the last five years, but has maintained consistency throughout. The industry average varied from 2.72% to 4.06% during the same period. From 2012 to 2014, Wal-Mart was below the average net profit percentage of its competitors. However, Wal-Mart was above the industry average in 2015. In 2016, the company’s net profit once again dropped below its competitors’ average. The analysis of Wal-Mart beating the average in 2015 must take into consideration that Target had a negative 2.5% net profit margin that year, which pulled the average down significantly.
In each of the last five years, Dollar Tree has had the highest net profit percentage of the companies selected. Dollar General followed with the second highest in each of the years selected. Amazon had the lowest net profit percentage in each of the five years, with negative profits in two of the years. It is important to note that although Amazon had one of the highest gross profit margins in the industry, it had both the lowest net and lowest operating profit margins. Target had a higher net profit percentage than Wal-Mart in 2012, 2013, and 2016, while Wal-Mart surpassed Target in 2014 and 2015. When compared to its competitors, Costco maintained a similar position in this area as it did in the operating and gross profit analysis. Similarly, Wal-Mart maintained a similar position compared to its peers, with gross, operating, and net profit margins typically just below the industry average. It is important to note that for Wal-Mart, its gross profit, operating profit, and net profit as a percentage of sales stayed relatively steady over the five year period being analyzed. As stated previously, Wal-Mart’s consistency is a positive in the eyes of many investors, as future performance can be predicted with greater ease.

Exhibit 10. Change in Profit (Data from Morningstar.com)
In order to get a more accurate picture of the effects of interest and tax expenses of the companies being analyzed, the team has generated the above chart to show the change from operating profit as a percentage of sales to net profit as a percentage of sales. For example, a change in profit of negative 2% in the chart above would indicate that operating profit was 2% higher than net profit as a percentage of sales. Thus, interest and tax expenses would be equivalent to roughly 2% of sales. A number close to zero is desired, as that would indicate relatively low tax and interest expenses. As shown by the chart, Wal-Mart beats the industry average in all of the previous five years. While this does not mean that the total interest and tax expenses for Wal-Mart are lower than others, it does indicate that it is lower than the average as a percentage of sales. Taking the amount as a percentage of sales compares the expense(s) to the relative size of the firm. Dollar General and Dollar Tree, which both had among the highest operating and net profits, have some of the largest tax and interest expenses as a percentage of sales. Amazon and Costco had the smallest net profit as a percentage of sales difference.
Total Return on Assets

Exhibit 11. Total Return on Assets (Data from Morningstar.com)
The total return on assets measures the return on total investment for the company. The ratio adds the interest expense to after-tax profits in the numerator, since assets are financed by both creditors and stockholders. The numerator is then divided by total assets. The ratio illustrates a firm’s ability to earn a profit before contractual obligations (interest expenses) are paid. Wal-Mart’s total return on assets is consistently within 8.5% and 9.5% over the five year period. However, these returns are relative, so it is useful to compare them to Wal-Mart’s industry average. In all but one year, Wal-Mart either meets or passes the average of its competitors. Furthermore, from 2012 to 2015, Wal-Mart’s return was the third highest, behind Dollar General and Dollar Tree. In 2016, Wal-Mart had the second highest return, with Dollar General realizing the highest return at about 11%. Although Wal-Mart does not have the highest return among its competitors, its returns are consistent and are positioned well compared to competitors.
Net Return on Total Assets

Exhibit 12. Net Return on Total Assets (Data from Morningstar.com)
Net return on total assets shows the profitability of a firm as compared to its total assets and measures the return earned by shareholders on the firm’s total assets. Unlike total return on assets, net return on assets does not account for interest, which is why it is the return earned by shareholders. The larger the net return on total assets, the better. This ratio is particularly important because if shareholders know that the company has high returns on its assets, then they will be more willing for the company to purchase assets. The chart above indicates that Wal-Mart had a higher net return on total assets than the average in 2012, 2015, and 2016, while following below the average in 2013 and 2014. Dollar Tree had the highest net return on total assets in each of the last five years, with four years of returns near or around 20%. The company with the second highest net return on total assets was Dollar General, although Wal-Mart had a higher return in 2012.
Wal-Mart had at least the third highest net return on total assets in each of the last five years. While Dollar Tree had significantly higher returns most of the years, in 2016 Wal-Mart surpassed Dollar Tree as its return dropped to about 3%. Compared to its competitors’, Wal-Mart’s net return on assets is strong. While its returns are not the highest, it is positioned well among its competitors in this regard and has relatively constant returns, at around 8%.
Return on Stockholders’ Equity

Exhibit 13. Return on Stockholders' Equity (Data from Morningstar.com)
The return on stockholders’ equity represents the return stockholders are earning on their capital investment in the firm and a company’s ability to generate profit off of the investments received from shareholders. According to the textbook, a return in the range of 12% to 15% is considered average for all companies (Thompson, 84). Wal-Mart had a return on stockholders’ equity of at least 20% from 2012 to 2015 and a return of about 18% in 2016. Comparing these returns to the statement from the textbook, Wal-Mart’s return on stockholders’ equity is above what would be considered average for all companies. Although there was a slight decline on the return from 2015 to 2016, Wal-Mart has been able to achieve a stable return over the past five years. This is especially true when compared to some of its competitors, which have some returns changing from positive to negative from year to year. Wal-Mart’s relatively high returns and consistency make it an attractive stock to potential investors.
The calculated average return for the selected companies ranged from about 15.9% to 20.5% over the last five years, which is much more volatile than Wal-Mart’s returns. Wal-Mart’s return beat the average in each of the previous five years. Dollar Tree had the highest return on stockholders’ equity in each year from 2012 to 2015, but this return fell dramatically in 2016 to around 9%. Wal-Mart had the second highest return on equity from 2012 to 2015. Although Wal-Mart’s return remained relatively stable in 2016, some of the other companies began to realize returns that rivaled Wal-Mart’s.
In 2016, Target, Costco, and Dollar General all had returns that surpassed those of Wal-Mart. While Amazon did not have a higher return on equity than Wal-Mart in 2016, its return increased substantially from 2015. The only two companies to have a decrease in return on equity from 2015 to 2016 were Wal-Mart and Dollar General. Although competitors had returns that were higher than Wal-Mart’s in 2016, it is likely not cause for immediate concern that investors will move their capital to a rival firm. First, 2016 is just a single data point, so a savvy investor would look at performance over a period of time, not based on a single year. Second, Wal-Mart has had more consistent returns than its competitors. While some investors are only interested in short-term gains, many are interested in long-term gains and financial performance.
Return on Invested Capital
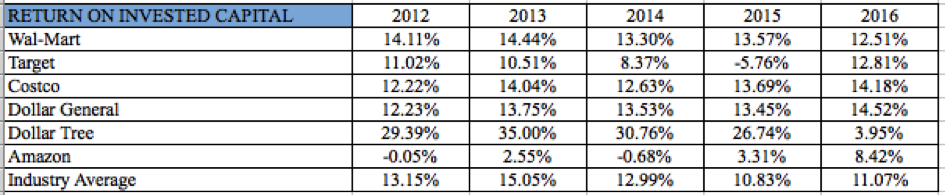
Exhibit 14. Return on Invested Capital (Data from Morningstar.com)
The return on invested capital (ROIC) ratio depicts a firm’s ability to make profits from long-term monetary capital that was invested into the firm. This long-term invested capital comes from parties such as bondholders and shareholders. According to the textbook, a higher return indicates that a firm has a greater ability to use long-term capital to improve the bottom line. This ratio is especially important because it can indicate to the investors the kind of return that they might expect to receive. From 2012 to 2016, Wal-Mart’s ROIC was relatively steady, ranging from about 12.5% to 14.5%. Wal-Mart’s return beat the average of the selected companies in all of the years analyzed except for 2013. Dollar Tree had the highest ROIC in every year except for 2016. Similar to the return on shareholders’ equity, in 2016, Target, Costco, and Dollar General all had returns that surpassed Wal-Mart’s. Another similarity is that Dollar Tree had a significant drop in return from 2015 to 2016 and Amazon had a relatively significant increase as compared to its previous performance. These similarities are expected as the only difference between return on equity and return on invested capital is that long-term debt is added to the denominator to calculate ROIC.
After evaluating Wal-Mart’s income statement and the associated ratios, also referred to as the profitability ratios, it appears that Wal-Mart’s revenue stream and profit are consistent. Although Wal-Mart may not meet the average of its competitors on some of the ratios, its profits are less volatile. Although there are many types of investors, many prefer consistency in financial results. This consistency allows for investors to make more accurate predictions of the future, and thus have a more precise vision of financial results. Therefore, when the company continues to perform consistently into the future, the investor will be less likely to be upset by unexpected financial results.
Balance Sheet
The balance sheet, also known as the statement of financial position, gives an investor a snapshot of a company at a given time. By looking at Wal-Mart’s balance sheet for the past five years (appendix 3), it is clear that not many significant changes have occurred. Slight increases or decreases to accounts such as cash or current liabilities have taken place, but none of these changes seem to be significant and are likely due to the day-to-day business of the company. Furthermore, changes that have occurred on the balance sheet are more easily interpreted with further information provided by ratios. Thus, we will explore Wal-Mart’s position within the industry based on key balance sheet ratios
Current Ratio

Exhibit 15. Current Ratio (Data from Morningstar.com)
The quick ratio measures a firm’s ability to pay off short-term liabilities using cash and assets that can quickly be converted to cash. A ratio of at least one is ideal, as this means that the firm has more current assets than it does current liabilities. A ratio of less than one indicates that a firm has more current liabilities than it does current assets. In each of the last five years, Wal-Mart has had a current ratio of less than one. While a ratio of less than one can sometimes be cause for concern, more information about the company’s operations has to be known before making a determination. However, even if a low current ratio is a part of the firm’s strategy, there is always an increased risk associated with not being able to meet short-term liabilities.
Compared to the industry, Wal-Mart is the only company with a current ratio of less than one in each of the last five years. Besides Wal-Mart, there are only two other instances in which one of the firms had a current ratio below one; Dollar Tree, with a current ratio of around two each year, seems to be the healthiest in terms of its ability to meet short term liabilities. The source of Wal-Mart’s low current ratio could be due to a number of reasons including management’s decision to keep the ratio low or too much short-term financing. Wal-Mart’s current ratio is still high enough that there is likely to be little risk associated with it; however, Wal-Mart’s management should seek to improve on its current position in order to attract investors.
Working Capital


Exhibit 16. Working Capital
Working capital is calculated by taking current assets minus current liabilities. The result is the cash that is available to finance a firm’s day-to-day operations. The top chart above is the calculated working capital (in millions) for each firm over the past five years. The numbers themselves are not directly applicable for comparison because of the varying sizes of the firms. Instead, the team generated a second chart that indicates whether working capital was positive (+) or negative (-). As indicated by the chart, Wal-Mart had a negative working capital for each of the five years. By comparison, there are only three other instances of a firm having a negative net working capital over the same five-year time period: Dollar General, Dollar Tree, and Amazon.
Not only is the presence of a negative working capital an issue, but the extent of Wal-Mart’s working capital deficit is further cause for concern. The top working capital chart, which is stated in millions, indicates that the lowest working capital deficit was about $2 billion and the largest was almost $11 billion. Large working capital shortages such as these have the potential to cause problems for Wal-Mart. First, Wal-Mart may not be able to pay off its current liabilities in a timely manner. Furthermore, without a positive working capital, Wal-Mart may not be able to finance activities such as inventory expansion, additional accounts receivable, and operations growth without having to borrow more money or raise more funds through an equity issuance (Thompson 84).
Days of Inventory

Exhibit 17. Days of Inventory (Data from Morningstar.com)
The days of inventory ratio illustrates how long a company takes in order to turn its inventory into sales. Therefore, a lower days of inventory ratio is preferred, and is calculated by dividing the inventory by the average cost of sales per day. This ratio shows that Wal-Mart has an efficient inventory management. The days of inventory ratio increased by around 4 days from 2012 to 2014; however, it has not changed much and has been relatively stable, around 45 days, for the last 3 years. Among the six companies, only Costco has a higher efficiency of managing inventory. In the last 5 years, it takes Target, one of Wal-Mart’s biggest direct competitors, around 60 days to sell off its inventory.
Average Collection Period

Exhibit 18. Average Collection Period (Data from Morningstar.com)
The average collection period illustrates the length of time a firm has to wait to receive the cash payment for its sales, and a shorter time period is favorable. In 2016, Wal-Mart’s collection period was just slightly better than the industry average; however, this average was pulled down significantly because generally Dollar General and Dollar Tree do not sell their products on account. Over the last five years, this has been one of the aspects that Wal-Mart has been able to improve, as its average collection period declined from around 5 days from 2012 to 2015 to just over 4 days in 2016.
Total Debt-to-Assets Ratio

Exhibit 19. Total Debt-to-Assets Ratio (Data from Morningstar.com)
The total debt-to-assets ratio indicates the extent to which debt (both long-term and short-term) has been used to finance the acquisition of assets. If a firm’s debt-to-assets ratio is too high, it may signal that a firm is using too much debt to purchase assets and can indicate concern for bankruptcy. Therefore, a lower debt-to-assets ratio is better as it shows that a firm can finance its operations without the use of debt. Wal-Mart’s debt-to-assets ratio has been consistent over the last five years, ranging from .52 to .55. In each of the five years, Wal-Mart’s ratio was less than the average of its competitors’. In comparison to others in the industry, Wal-Mart appears to use its debt efficiently. Wal-Mart’s low debt position relative to its assets may help to explain why its working capital was so low. By avoiding debt, Wal-Mart likely used cash or other liquid assets in order to finance its operations.
Long-term Debt-to-Capital Ratio

Exhibit 20. Long-term Debt-to-Capital Ratio (Data from Morningstar.com)
The long-term debt-to-capital ratio is an important measurement that is used to determine the creditworthiness of a company by identifying the percentage of capital investments that have been financed by both debt and equity. A lower ratio is preferred since it increases the capacity for a firm to borrow funds. The textbook states that a long-term debt-to-capital ratio below .25 is preferred and that debt-to-capital ratios above .5 and certainly above .75 are cause for concern. High debt-to-capital ratios may indicate an excessive reliance on long-term debt, lower creditworthiness, and weak balance sheet strength (Thompson, 84). Wal-Mart’s debt-to-capital ratio ranges from .32 to .38 over the five-year period. Wal-Mart’s debt-to-capital ratio has been lower than the industry average in every year except for 2012. Although Wal-Mart’s debt-to-capital ratio is not below the .25 relationship that the textbook identified, its lower reliance on debt financing is better than the average of its competitors’. The results of this comparison indicate that, from a lender’s point-of-view, Wal-Mart may be more creditworthy than some of its competitors.
Times-Interest-Earned Ratio
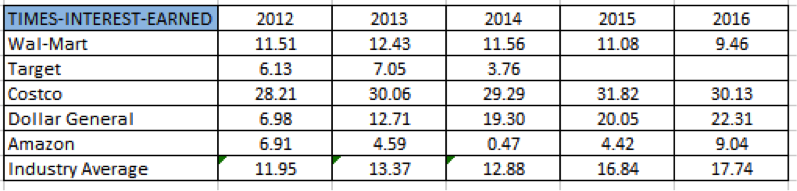
Exhibit 21. Times-Interest-Earned Ratio (Data from Morningstar.com)
Times-interest-earned ratio is used to demonstrate a company’s ability to fulfill its debt obligations, as calculated by dividing the earnings before interest and tax by the tax payable amount. Wal-Mart’s times-interest-earned ratio is relatively high, as usually a minimum ratio of 2.0 is required by lenders. This ratio measures Wal-Mart’s ability to pay annual interest expenses. Over the year, Wal-Mart’s interest coverage ratio has been quite stable, around 11. However, in 2016, this ratio dropped to 9.46. Compared to the industry average, Wal-Mart’s ratio was just slightly under in the period between 2012 and 2014, but the differences have increased in the last two years.
Statement of Cash Flows

Exhibit 22. Net Change in Cash (Data from Morningstar.com)
The above chart is Wal-Mart’s net change in cash for each of the last five years. During each of the years, the total net change and cash varied from positive to negative from year to year. Furthermore, the variations in cash from year to year are substantial. For example, from 2014 to 2015, cash flows went from negative $500 million to a positive $1.8 billion in 2015, a change of about 470%. Typically, more consistent cash flows would indicate a healthier company, but more information is needed to determine if there are significant events that caused the changes in cash flows. By looking at the cash flows from operations, financing, and investing, a clearer picture of Wal-Mart’s cash flows will come to light (full statement of cash flows can be found in appendix 4).
Cash Flows from Operations

Exhibit 23. Cash Flows from Operations (Data from Morningstar.com)
Above is Wal-Mart’s net change in cash flow from operations for the previous five years. Cash flows from operations are the changes in cash from daily business activities. For the most part, these cash flows maintained relatively consistent from year-to-year. The change in operating cash flow from 2014 to 2015 was the largest, with a 22.8% increase. Overall, Wal-Mart’s operating cash inflow grew by about 13% from 2012 to 2016, signifying relatively significant growth. More importantly, Wal-Mart’s operating cash flow was positive in each of the last five years. Positive cash flows from operations provides adequate cash to support financing and investing activities. The activities that make up cash flows from operations were consistent for the most part. Inventory and deferred income tax cash flows, however, did experience significant changes. Both of these cash items are discussed below.

Exhibit 24. Inventory Cash Flows (Data from Morningstar.com)
For each year above, cash flows from inventory was negative, which is expected because cash is used to acquire inventory. The interesting point is that cash outflows for inventory have decreased during each of the last five years. Year-to-year changes ranged from about 25% to 43%. The overall change in cash outflows for inventory from 2012 to 2016 was $3.7 billion down to about $700 million, a decrease of about 81%. There could be a few potential explanations for the decrease in cash flows to purchase inventory. Wal-Mart could be deciding to keep fewer inventories on-site. Additionally, the significant cash outflows for inventory in prior years could have resulted in significant inventory levels, which may have decreased the need for inventory in subsequent years.

Exhibit 25. Deferred Income Taxes (Data from Morningstar.com)
Another important note to make about operating cash flows is in regards to deferred income taxes. In 2012, deferred income taxes had a positive cash inflow of about $1 billion. In each of the subsequent years, deferred income taxes resulted in a cash outflow. The reason for the cash inflow in 2012 would have resulted from an income tax payable. Then, in years 2013 to 2016, more income taxes were paid than were delayed as payables. While this process is not uncommon for companies, it is important to note this variation when interpreting cash flows from operations.
Cash Flows from Investing


Exhibit 26. Cash Flows from Investing (Data from Morningstar.com)
Investing cash flows indicate the changes in cash from property, plant, equipment, acquisitions, and other investing activities. Wal-Mart had a negative net cash flow during each year from 2012 to 2016. The most important observation to make in regards to Wal-Mart’s investing cash flows is that the net outflow from investing activities has decreased in each of the last five years. Overall, cash outflows from investing activities have decreased by about 36%. The major change came from 2012 to 2013, which resulted in a decrease in outflows of about 24%. The reason for this is likely due to a $3.5 billion acquisition that occurred in 2016, which increased outflows significantly. To further illustrate the consistency in investing cash flows other than the acquisition, the above chart shows that cash outflows from investments in property, plant, and equipment stayed relatively consistent from year to year.
Cash Flows From Financing


Exhibit 27. Cash Flows from Financing (Data from Morningstar.com)
Wal-Mart’s cash flows from financing activities were negative for each of the last five years. Over the five year period, cash outflows from financing activities increased by about 91%. Cash outflows from financing activities increased substantially from 2012 to 2013 and 2014 to 2015. The significant increase in cash outflows from financing from 2012 to 2013 was largely influenced by the major decrease in inflows from long-term debt issued from $5 billion to $211 million. The decrease in net long-term debt issued could be caused by Wal-Mart either collecting less from debt issuances or issuing more debt in 2013. Furthermore, the major change that occurred from 2014 to 2015 can be linked to the major change in short-term borrowing. In 2015, payments on short-term borrowing exceeded amounts borrowed by about $6.3 billion. This major cash outflow contributed to the significant increase in cash outflows from financing for the year 2015.
Free Cash Flow

Exhibit 28. Free Cash Flow (Data from Morningstar.com)
Free cash flow illustrates the company’s capability of internally funding new projects, repaying outstanding debt, making new acquisitions, repurchasing stock, or increasing the amount of dividend. As shown above, Wal-Mart’s free cash flow have been significantly higher than other companies in the industry, giving it the opportunity to continue to grow domestically and internationally. Furthermore, its free cash flows also have had an upward trend in the last five years, indicating improved performance and giving the company a greater firm value.
Stock Price

Exhibit 29. Stock Price (Screenshot from Morningstar.com)
As of March 14, 2017, Wal-Mart’s stock price closed at $70.72 per share. Over the past year, Wal-Mart’s stock has varied over the range of $62.72 to $75.19. Wal-Mart’s current stock price is currently about 6% below its 52-week high. Over the past five years, Wal-Mart’s stock has traded between $56.30 and $90.97 per share. The current stock price is about 22% below its 5-year high. Wal-Mart’s beta, which measures the volatility of a stock compared to the market, was .03 as of March 14, 2017 (WMT Key Statistics). A beta of less than 1 means that the stock is less volatile than the market; thus to a risk-averse investor, Wal-Mart’s stock appears to be an attractive buy based on its beta value.

Exhibit 30. Growth of 10,000 Share Investments in Wal-Mart (Screenshot from Morningstar.com)
The above chart displays 10,000 share investments in Wal-Mart in 2007 and its subsequent growth to 2016. The chart also compares Wal-Mart’s growth to the S&P 500 and other discount stores. From 2007 to 2014, Wal-Mart beat the S&P and was in consistent growth with other discount stores. In 2015, Wal-Mart’s stock lost 26% of its value, while discount stores only lost about 14% and the S&P gained about 1.3%. In 2016, discount stores had growth of 10.6% and the S&P had growth of 11.96%, while Wal-Mart had a more favorable return of 16%. However, due to the losses in 2015, the return from 2007 to 2016 on 10,000 shares of Wal-Mart is less than the return that was realized by discount stores and the S&P.

Exhibit 31. Weekly Insider Transactions (Screenshot from Morningstar.com)
Recently, Warren Buffett’s Berkshire Hathaway sold off about $900 million worth of stock in Wal-Mart, a sale that was announced on February 15, 2017. Buffet stated that he does not believe that traditional retailers like Wal-Mart will be able to survive in the future. Buffett also stated that he believes Amazon will continue to disrupt the market of traditional retailers by continually increasing its market share (Wahba). The above chart, obtained from Morningstar, shows the trading of Wal-Mart’s stock by insiders to the company. The chart shows that the day after Buffett’s purchase was announced, sales of the stock from those within the company increased dramatically. The three orange columns to the right of the graphic represent this sales spike. The first orange column under February 2017 represents the sales during the week immediately following Buffet’s sale. The sale of stock by insiders is an interesting point to investigate as it could mean that insiders also feel that the stock may not perform well in the future or that insiders feel that Buffett’s comments are harmful to the company’s stock regardless.
Price-to-Earnings Ratio

Exhibit 32. Price-to-Earnings Ratio (Data from Morningstar.com)
Exhibit 32. Price-to-Earnings Ratio (Data from Morningstar.com)
Generally speaking, a price-to-earning (P/E) ratio of 20 or above indicates that investors have confidence in the future growth and performance of the firm. In this sense, investors are not too confident about the future growth of Wal-Mart compared to Costco or Dollar Tree. However, a relatively low P/E ratio can also indicate that the stock is currently undervalued.
Dividend Payout Ratio

Exhibit 33. Dividend Payout Ratio (Data from Morningstar.com)
Exhibit 33. Dividend Payout Ratio (Data from Morningstar.com)
Wal-Mart, Target, and Costco all have a long history of paying dividends. However, the dividend payout ratio is different among the three corporations, and Wal-Mart’s dividend payout ratio has usually been above the industry average. Moreover, its dividend payout ratio has had an upward trend in the last five years, which could help it attract more investors.
SWOT Analysis
Strengths
Wal-Mart holds a unique market position; according to Wal-Mart’s 2016 annual report, the company earned total revenues of $482 billion dollars in that year, which firmly establishes the company in a leadership position (18). As the market leader, Wal-Mart’s locations are widely accessible worldwide, allowing for an unparalleled brand presence and accessibility that no other company has been able to reach. From this, Wal-Mart holds unique advantages, namely in technological, operational progress, and economies of scale. Through these three advantages, Wal-Mart is also able to increase operational efficiency and exert significant power over its competition, suppliers, and buyers (Basker 25). Wal-Mart also carries out a highly effective strategy for retail expansion. Wal-Mart’s online presence and digital strategies, including Walmart.com and Jet.com, give the company a strong position for modern commerce. Recent changes to Wal-Mart’s online business structure and upper management have been decisive, and set up the company for competition against top online retailers (Silverman).
The company has been a consistent early adopter of information technology and operational innovation. Throughout its history, Wal-Mart has always utilized technological innovation to improve efficiency and productivity in its operations. It was an early adopter of barcode readers, which reduced labor costs exponentially. According to Basker, Wal-Mart’s implementation of new technology improved labor efficiency, resulting in sales growth of over 57% from 1982 to 2002 (7).
Wal-Mart also develops technology to serve its needs. In the 1990s, Wal-Mart connected all of its stores, distribution centers, and suppliers via internally developed software, reducing friction in the supply chain at a level previously unrealized by any other firm (ID Systems 2). Wal-Mart established the largest private satellite network in the world, allowing for instantaneous communication within the company (Basker 4). Wal-Mart has shown a clear pattern of implementing modern technology in ways that result in increased efficiency and cost reduction, allowing for the company to sustain its growth.
Today, Wal-Mart shows little indication of altering its position as the leading adopter of new technology. Its developing strength lies in digital commerce. The company’s 2016 annual report indicates a strong awareness toward the shifting technological climate present in commerce, including the acquisition of Chinese internet retailer Yihaodian, along with offering new mobile and online services for its existing businesses (Wal-Mart Stores, 8). Furthermore, its acquisition of Jet.com seeks to establish the company as an innovative leader in the rapidly growing segment of e-commerce. According to Wal-Mart’s press release, “Wal-Mart and Jet will maintain distinct brands, with Walmart.com focusing on delivering the company’s Everyday Low Price strategy, while Jet.com will continue to provide a unique and differentiated customer experience with curated assortment.” Thus, Wal-Mart’s current technological leadership has allowed for gains toward cost leadership and differentiation, creating an advantageous place in the market.
The company’s size and market leadership also allows for gains due to economies of scale. Wal-Mart is able to purchase at lower costs relative to all other competitors and as a direct result can keep prices lower than those of competitors. According to Basker, Wal-Mart’s process of directly sourcing goods at large volumes further widens the price disparity between Wal-Mart and its competitors, as smaller companies are unable to pursue similar quantities (21).
Wal-Mart pursues aggressive pricing tactics that are highly sensitive to those of its competitors. In a report by CNBC, Wal-Mart conducted aggressively targeted price cuts in 2016, and reported a 1.6% increase in sales growth, which directly correlated with reduced sales growth and store traffic experienced by competitors Target and Dollar Tree (Gustafson). Wal-Mart is also able to utilize its market leadership through efficient resource distribution and economies of scale. In doing so, the company is able to defeat competitors on a cost leadership basis. According to its Price Matching Policy, the company offers price matching both online and at retail locations, further denying competitors market share on a cost basis (Wal-Mart Stores).
Wal-Mart is also diversified internationally, with retail locations in over 28 countries, an online presence in 11 countries, and over 800,000 employees located outside of the United States. Wal-Mart’s global presence exceeds that of any other retailer, and conducts approximately 25% of sales internationally (Jurevicius).
Wal-Mart has an unmatched scale of operations and strong market power over suppliers and competitors. In a comparison of the top retailers in the world, Amazon, Tesco, Costco, and Carrefour all rank under Wal-Mart. In 2016, Amazon had annual revenue of $107 billion. In 2016, Tesco had annual revenue of approximately $100 billion, 6,902 locations, and 476,000 employees. Costco had annual revenue of approximately $110 billion, 686 locations, and 205,000 employees. Carrefour had annual revenue of approximately $110 billion, 12,296 locations, and 380,000 employees. Wal-Mart ranks at the top of this list, with a 2016 annual revenue of approximately $482 billion, 11,528 locations, and 2.3 million employees (Jurevicius).
Weaknesses
Wal-Mart’s position as a buyer of goods results in a degree of susceptibility for the company. The company is, for the most part, exempt from pressure exerted by its suppliers. Despite this, other problems can arise. Wal-Mart is offered a low degree of flexibility in product development. As a retail distributor for products located by the company, Wal-Mart is incapable of developing well-differentiated or unique products.
The products Wal-Mart offers are not highly differentiated and rely on cost leadership to attract customers. As a general trend, its retail differentiation strategy revolves heavily around its pricing strategy, highlighting “Everyday Low Prices” as the main selling point. Wal-Mart products can be found outside of its stores, and alternative brands, retailers, and substitute products are prevalent throughout the market. This is further harming because of Wal-Mart’s position as a large-scale buyer of goods. According to Basker, Wal-Mart incurs disproportionately high fixed costs when establishing sources for its products; while acceptable, this may hinder the profitability of Wal-Mart, especially when considering the breadth of its product offerings (22).
With Wal-Mart’s acquisition of Jet.com, it has established a differentiated position within e-commerce, but it is unclear if this investment will be successful. During the first quarter of 2016, market surveys from BI Intelligence indicated that 81% of consumers were not aware of Jet.com. According to Businessinsider.com, Jet.com currently experiences a burn rate of $5 million a month, and has yet to become profitable. Jet also has an unproven market position, driven primarily by first-time shoppers to the site. 73% of 2015 sales were driven by first time shoppers.
Historically, Wal-Mart has used technology innovation to great effect. However, in recent years, Wal-Mart may be losing its technological advantage. The company’s quarterly statements indicate that its e-commerce growth has consistently dropped over the past eight quarters (Wal-Mart Stores). Meanwhile, Amazon was responsible for 43% of all e-commerce sales growth in 2016 (D’Onfro). Firms such as Amazon have grown to become heavily tech-enabled in past years. Wal-Mart has only recently started to increase its technological presence in the current market environment, announcing large-scale hiring initiatives in the San Francisco Bay Area as of March 2017 (Green). As a whole, Wal-Mart’s recent actions have served to catch up to tech trends, rather than setting trends as the company has done in the past.
As a company that competes on a cost leadership basis, Wal-Mart experiences low margins. In 2016, despite earning revenues of $482 billion, only $14.6 billion was retained as net income. Over the years, Wal-Mart has undertaken varying measures to reduce costs and improve margins, some with adverse effects. In 2008, Wal-Mart settled a lawsuit for $352 million regarding claims to unpaid mandatory overtime (Greentime).
Public relations have been an area of controversy for the company. Over the years, Wal-Mart has committed to controversial choices over and over again. In 2009, Wal-Mart paid $17.5 million in a settlement over allegations of racial bias in hiring practice (Associated Press). In 2013, Wal-Mart paid the EPA $81 million in fees for environmental crimes (Harrington). In 2016, Wal-Mart settled a same-sex discrimination suit for $7.5 million, in which benefits were not provided for same-sex couples (Scheiber). Time and time again, Wal-Mart has displayed questionable ethics while conducting business, and these actions are clearly detrimental to company performance. The numerous lawsuits Wal-Mart has been involved in have resulted in high-profile, multi-million dollar settlements. In addition to financial detriment, such decisions reflect poorly on Wal-Mart’s ethics; besides the aforementioned examples, the company has entered the spotlight for environmental harm, child labor, dangerous workplace equipment, and unfair practices towards retail workers, women, minorities, and same-sex families. Such actions are likely to be negatively viewed by investors and to have tarnished Wal-Mart’s brand image in most consumer minds.
Opportunities
Wal-Mart’s opportunities are mainly related to expansion and improving its business practices, which are linked to the global economic situation. The company has the opportunity to diversify in other large scale businesses with its substantial resource base, similar to Amazon.
Wal-Mart has the opportunity to diversify and improve its reach through e-commerce business. According to Wal-Mart CEO Doug McMillon, the acquisition of Jet.com in 2016 would accelerate the company’s priorities of lower prices, broadening its assortment, and offering the simplest, easiest shopping experience. Jet co-founder and CEO Marc Lore felt that the acquisition was mutually beneficial, remarking that joining Wal-Mart would help fuel the realization of Jet’s vision to create “a new shopping experience.” Jet.com has demonstrated its ability to scale with speed, reaching $1 billion in run-rate Gross Merchandise Value and offering 12 million stock keeping units in its first year. The company has a growing customer base with 400,000 new shoppers added monthly and 25,000 daily processed orders on average. It has over 2,400 retailer and brand partners (“Walmart Agrees to Acquire Jet.com, One of the Fastest Growing e-Commerce Companies in the U.S.”).
Wal-Mart also has opportunities through investing in the American manufacturing industry and increasing its corporate citizenship. In 2014, the company awarded seven research and development institutions a total of $4 million in grants to create new processes, ideas, and jobs. Among the seven awarded were Georgia Tech Research Corporation, Indiana University - Purdue University at Indianapolis, North Carolina State University College of Textiles, Oregon State University, Texas Tech University, University of Texas at Arlington, and University of Georgia Research Foundation. Among the industry categories represented were the automation of sewn goods, advancement of 3D printing, implementation of new technologies in fabric printing, creation of new mold fabricating approaches, finding of new ways of innovating cotton production, creation of small motor subsystems, and creation of a new approach to fabric dyeing. Wal-Mart plans to provide $10 million in total grants through the next five years. “By investing in American ingenuity originating everywhere from the research lab to the assembly line, [Wal-Mart] can transform [its] approach to manufacturing to be more cost-effective and efficient. [It] can bring more jobs and more production back into American communities.” Wal-Mart also announced that by 2023 it will buy $250 billion in products that support American manufacturing and jobs. Through these investments, Wal-Mart has the opportunity to improve its surrounding environment to set itself up for more success in the future (“From Research Lab to the Assembly Line: Walmart, the Walmart Foundation and the U.S. Conference of Mayors Award $4 Million to Help Spark Innovation in American Manufacturing”).
Wal-Mart also has an opportunity to expand in the discount retail space. The company tried for years to compete against discount retailers Dollar Tree and Dollar General with its Wal-Mart Express. Early in 2016, it sold off 100 Express stores to Dollar General, abandoning the business venture. However, due to its size and financial ability, Wal-Mart is now strategically cutting prices on certain commodities inside Wal-Mart locations near competing dollar stores. These commodities include laundry detergent and fresh fruit, and anything else that produces higher traffic in the store. For example, in North Carolina a basket of popular items like peanut butter and apples was found to be 12.6% cheaper than a basket in comparison at Dollar General stores. If Wal-Mart were to duplicate this pricing strategy in North Carolina into all of its stores, Wal-Mart’s sustainable competitive advantage would be significantly damaging to Dollar General and other dollar stores (Banjo).
Finally, Wal-Mart has the opportunity to further expand internationally. In 2015, Wal-Mart had more stores internationally than domestically, with 6,189 stores and 4,987 stores, respectively. Among these international markets are the United Kingdom, Canada, Mexico, Brazil, and China, the company’s five largest international markets. However, this international to domestic ratio is lacking, considering the immense amount of other countries to which Wal-Mart could expand. It isn’t that Wal-Mart’s international expansion is unprofitable; from 2009 to 2014, Wal-Mart’s revenue from international operations grew at a compound rate of 7.3%, making the international revenue segment faster growing than the domestic segment. However, the international segment’s profitability is lower internationally because of high front-end costs involved in driving international expansion. Wal-Mart plans to increase revenues internationally by utilizing e-commerce, adding more locations, and implementing its low price strategy in international markets (Soni).
Threats
Wal-Mart is threatened by competition in the industry. Its main competitor is Amazon. Amazon’s algorithmic approach that presents particular products to its customers and entices them to buy has set it ahead of Wal-Mart in the e-commerce industry. Being an e-commerce company has also allowed the company to use real-time data to implement dynamic pricing. Wal-Mart’s e-commerce sales measured a mere $14 billion in 2015, whereas Amazon’s sales measured $107 billion in the same year; however, Wal-Mart’s total sales were $482 billion (Petro).
Wal-Mart is also threatened by an overall price competition, but has begun reducing TV advertising, newspaper advertising, and in-store displays in an effort to cut costs. Involved in this process is removing the “available at Wal-Mart” message on many of Wal-Mart’s products. This has brought complaints by major suppliers, who claim doing so will push customers to retailers like Target and Bed Bath and Beyond. For example, if a product is advertised with Target instead, consumers may be more apt to buy it at Target. “[Wal-Mart’s] competitors have gotten stronger,” said Edward Jones analyst Brian Yarbrough. “Now everyone is so close in price that it comes down to the shopping environment and convenience” (“As Not Seen on TV: Wal-Mart Dials Back On Ads In Low Price Push”).
Wal-Mart has received some resistance regarding its wages. Campaigners in all parts of the food, drink, and retail industries are fighting for a higher minimum wage. A common accusation is that Wal-Mart and other firms with cheap labor benefit from government subsidies. These subsidies come from low-wage workers that rely on the government for an addition to their low wages to make a living wage. In this way, Wal-Mart and other cheap labor firms would fail if it weren’t for the government’s support of its employees. In the past, Wal-Mart has raised its starting wages to $9 from the national minimum, a change brought on partly by social pressures; advocates have argued that higher wages make happier workers, and happier workers make a better company shopping environment. In late 2015, the company “expected profits to fall by 6% to 12% in 2017, with higher wages responsible for three-quarters of the shortfall.” Wal-Mart has had some issues with the wage change. For one, it has not raised all wages uniformly, including long-serving staff that already make $10 or more. This has led to some backlash from staff that are upset about the company granting minimum wage workers higher wages but other workers none (“High Expectations”).
Wal-Mart has received criticism for its views and policies on unionization and protests. In 2014, the National Labor Relations Board issued a complaint against Wal-Mart for attempting to break up an organized protest by its workers on Black Friday. The board issued a formal charge against Wal-Mart for breaking US labor laws. The board had received complaints from several employees in reference to the protest, one of which acknowledging a Wal-Mart spokesperson threatening that “there could be consequences” for protesters (“Feds Accuse Walmart of threatening, intimidating employees who protest company”). This event among others could create problems for Wal-Mart, including with the government, its customers, and its employees. Wal-Mart has already created a reputation for being against unions and employee organization, but more protests in the future could force the company to change its policies.
Finally, recent tax policies and tariffs threaten Wal-Mart’s profitability. In January 2017, President Trump discussed the possibility of tariffs that would affect imports into the US from Mexico and China, along with a border-adjustment tax targeting imports. The unpredictability of the political climate may lead to serious problems for Wal-Mart, as the company relies on imports to conduct business. Wal-Mart imports approximately $50 billion annually in Chinese goods. Border taxes would be detrimental to Wal-Mart’s bottom line, and prices would be pushed up as a result (Soergel).
Major Problem and Possible Solutions
Problem
The major problem facing Wal-Mart is the growing number of retail purchases that are occurring online. Some customers have abandoned traditional shopping, typically consisted of purchasing goods at a brick-and-mortar store. Now, there has been a recent trend of consumers shifting their spending to online retailers. Although Wal-Mart has an online shopping platform, its online sales have been minimal compared to online merchants like Amazon. Wal-Mart will have to either learn to compete based in the realm of internet sales or entice customers to continue to come into its stores. If not, Wal-Mart could be at risk of losing market share.
Solution 1
The first proposed alternative is for Wal-Mart to convert some of its current stores into distribution centers. Wal-Mart has well-positioned stores all across the country. As traditional brick-and-mortar stores lose market share to online retailers, Wal-Mart’s in-store sales may begin to decline. Converting current stores into distribution centers would allow for timely deliveries and increased delivery volume. By using current buildings, Wal-Mart can save millions of dollars in sunk costs by avoiding the construction of new distribution warehouses. Another advantage of this solution is that Wal-Mart can strategically select the stores to convert based on location. Through successful supply chain planning, Wal-Mart can have distribution centers located throughout the country in order to provide shipping faster than other online retailers like Amazon. A major downside to this solution is the opportunity cost. By replacing stores with distribution centers, Wal-Mart would be missing out on the in-person sales that would normally occur without converting the facility. This could be offset by continuing in-store operations at a smaller scale, while allocating a larger portion of the store for fulfillment. While faster delivery through more distribution centers could net an overall increase in sales, Wal-Mart would be taking a risk by making this bet. Another potential issue with this alternative is layoffs. A distribution center is likely to be highly automated and could result in less required labor. Therefore, Wal-Mart would need to lay off its excess workers. Mass layoffs are likely to result in bad publicity for the company, possibly leading to a temporary decrease in sales.
Solution 2
The second proposed alternative is for Wal-Mart to implement a paid membership plan for its customers, in which members could enjoy free same-day shipping and delivery on its online orders. The membership could also reward participants for shopping in-store by offering them deals that would not be available to non-member shoppers. By doing this, Wal-Mart would be able to compete with Amazon Prime, which provides members free 2-day shipping on over 50 million eligible items sold on its website for a cost of $99 per year. With a wide geographic coverage from its stores spread across the United States, Wal-Mart would be able to implement this at a low cost while also increasing revenue from membership fees. This will also help Wal-Mart boost its sales and gain market share as customers would move to Walmart from Amazon because orders would be delivered faster at a relatively low price. The disadvantage of this alternative is that if Wal-Mart could not acquire enough members for this plan, it would not be able to reach the required economies of scale and the delivery cost per item would end up being too high. The increased delivery costs would hurt its margin while the revenue from the membership fees would not be enough to offset it. Another drawback is that the gain from online sales would possibly come from the exact decline of its own in-store sales. Therefore, most of the customers it would gain would already be its in-store shoppers. In this case, there is no real gain in market share. Furthermore, when customers shop in the store, they also tend to conduct impulse buys; shopping online might eliminate this, which would negatively impact Wal-Mart’s sales.
Solution 3
The third proposed alternative is to implement a delivery service from online sales straight out of stores. This option would not require Wal-Mart to expand its distribution centers or add any more. Wal-Mart already has the required capital all across the country: its own stores. There would be little extra cost, especially when compared to the efforts competitors would undertake, and might only require the addition of inventory space to accommodate this. Wal-Mart stores are located in strategic areas, and are placed in nearly all highly-populated areas. The company could take advantage of its close proximity to its current and potential customers by offering speedy delivery, oftentimes delivering in an hour or less. The deliveries would be ordered completely online and taken directly to customers’ front doors. For customers in less populated areas where Wal-Mart stores are farther away, the company could make less conservative delivery promises, or choose to opt out of using these locations.
This strategy would involve Wal-Mart ordering extra inventory to its stores and then delivering orders via a dedicated fleet of delivery mini vans or trucks. Low cost orders would require customers to pay a small fee, while higher volume orders would be completely free. Customers would be able to order anything from groceries to TVs, all through Wal-Mart’s website or mobile app. The service could utilize modern or more convenient payment options. One such option would bill the customer’s account, which he or she would pay at the end of the month. The service would make purchasing items at Wal-Mart incredibly convenient and hands-free.
The strategy would bring in more service for Wal-Mart, which would help pay for the potential extra inventory and inventory space required to implement it. It would compete with Amazon’s strategies of implementing faster and faster deliveries. However, it would require no extra distribution centers, unlike Amazon, which requires distribution centers spread across the country to fulfill its orders.
Solution 4
Another potential solution for Wal-Mart is to integrate the use of Jet.com into its online sale operations. In 2016, Wal-Mart acquired Jet.com, an e-commerce company, which has a similar sales platform to that of Amazon. Although Wal-Mart owns Jet.com, it has avoided a full integration of the two companies. One benefit of integrating would be an enhanced platform that Wal-Mart could use to further increase its sales. Although Wal-Mart already has an online presence for sales, the site has not been up to par. Wal-Mart has had trouble getting customers to shop on its website and its online shopping experience has not been sufficient enough to compete with other e-commerce companies. By using Jet.com’s platform and acquiring its member base, Wal-Mart would be able to improve its online sales. Another benefit would be that Wal-Mart would be able to implement the improved site quickly. If Wal-Mart were to keep the two companies separate and use Jet.com’s expertise to rebuild its own site, the new platform would likely take a considerable amount of time to implement. However, by using Jet.com’s site, the transition would likely be much quicker and easier. One downside to this alternative is that Wal-Mart would lose the benefit of diversification; by keeping the two operations separate, Wal-Mart’s loss in customers may not affect Jet.com’s customer base or performance and vice versa. Another downside to integration is that Jet.com’s current customer base may not be open to the idea. By using the Jet.com platform as Wal-Mart’s online sales platform, Jet.com customers would likely then be limited to only Wal-Mart products. These consumers may resist the change and may decide to take their business elsewhere.
Solution 5
The fifth proposed solution is a combination of two previous suggestions: the implementation of a delivery service while also integrating Jet.com into Wal-Mart’s operations. As stated previously, the delivery service would provide online shoppers with their orders within a few hours of delivery. This parallels food delivery, which is placed over the phone or online and then driven to the customer shortly thereafter. Wal-Mart’s adoption of Jet.com’s business would hopefully boost sales. The two strategies complement each other well, and therefore this hybrid alternative would be beneficial. Many of the same advantages and disadvantages of the two separate strategies still apply. However, the use of both strategies brings up some changes. One advantage to this strategy is that in addition to current Wal-Mart customers, previous Jet.com customers would also experience faster delivery. This would allow Wal-Mart to successfully retain Jet.com’s customers after Jet.com’s platform is used for Walmart.com. A disadvantage of this alternative is resource limitations. Through the use of Jet.com’s experience and resources, Wal-Mart is likely to increase sales quite substantially. However, this could result in a number of more potential delivery orders from customers. With the increased orders, Wal-Mart may not be able to implement enough drivers or vehicles in order to make the delivery operation efficient.
Selection and Justification of Best Solution
The critical issue that Wal-Mart is currently facing is the growth of e-commerce, which has resulted in less shopping at traditional brick-and-mortar stores. Now, customers have taken their money to major online retailers such as Amazon. If Wal-Mart cannot adequately address the issue, it will likely face a decrease in market share in the future or the possible risk of going out of business. After an evaluation of the strengths and weaknesses of the five proposed solutions, Wal-Mart would be best situated to compete with online businesses by both fully integrating Jet.com into Wal-Mart’s operations and also starting a delivery service that sends orders to customers within hours. By implementing this strategy, Wal-Mart would be able to use Jet.com’s resources in order to develop a website that is more likely to attract online shoppers. Wal-Mart would also be able to leverage Jet’s talent to further build on synergies between their capabilities, mostly in fulfillment and e-commerce. By delivering customer orders within hours, Wal-Mart would be fulfilling orders much faster than Amazon’s two-day shipping. This solution not only addresses the issue of a sub-par website for online sales, but also provides a direct advantage over other retailers (online or not) with the fast delivery service.
Although Wal-Mart would have to keep more products on hand, its current stores likely have sufficient space to store the extra goods. Therefore, the additional storage space required would be minimal. Furthermore, although there is an increased liability of delivery drivers on the road, other companies have similar operations that send drivers out on deliveries. The increased revenue from this strategy would likely outweigh any potential liability that would result from having delivery drivers running regular routes. Furthermore, the issue of previous Jet.com customers becoming upset is also likely to be a minimal issue. While it could be a potential issue if Jet.com’s integration was the only solution implemented, the delivery benefit would likely mitigate the loss in customers. Jet.com customers would be able to enjoy faster delivery options than previously offered to them. Therefore, less of them are likely to leave to other retailers where they will either have to wait longer to receive their orders or will have to go into a physical store in order to make their purchases. Furthermore, Jet.com has few return customers, and at present relies on new first time customers. Thus, the impact of this is lessened, while integrating Wal-Mart’s capabilities also may allow for growth in return purchases.
As stated previously, by implementing the Jet.com integration as the only solution, the alternative would likely result in the loss of too many customers to make the option beneficial. Also, while only adopting a delivery system without also improving the online experience would still be an overall positive strategy, it can be further enhanced with a better website, which should result in a further increase in sales. Furthermore, although turning some Wal-Mart stores into distribution centers would improve the logistics of their e-commerce operations, the opportunity cost from a decrease in in-store sales would likely outweigh the benefits. Also, the alternative would likely require Wal-Mart to lay off workers, which usually results in negative publicity. On the other hand, the team’s proposed solution would likely result in more workers employed by Wal-Mart. While adopting a paid-membership system is an attractive alternative, many of the people that would sign up for the membership would likely already be Wal-Mart customers. Therefore, there would be no real gain.
Implementation Plans and Contingency Plans
Implementation Plans
The first proposed action is to integrate Jet.com into Wal-Mart to improve Wal-Mart’s online sales. This could be accomplished by immediately deploying Jet.com’s engineers to rebuild Wal-Mart’s online infrastructure to increase efficiency of the whole system and improve the online customer experience. On the other hand, although Jet.com has a reputation in processing orders effectively and efficiently, it does quite poorly with logistics, which partly led to the $5 million monthly losses that they incurred. This could be improved significantly by learning from or utilizing the logistics knowledge that Wal-Mart has already achieved. Furthermore, Wal-Mart could reposition some of its experts in this field to Jet to help improve Jet’s logistic system. By implementing both strategies, Wal-Mart could have two strong e-retailing players at the same time to compete with other companies.
The second proposed action is for Wal-Mart to provide a same-day delivery service to its customers. This could be easily implemented because Wal-Mart has physical stores throughout the United States, and each store would be able to serve as a distribution center when needed. This service would be similar to the pizza delivery service model executed by Domino’s and Pizza Hut; therefore, Wal-Mart would need to purchase a large number of delivery vehicles to fulfill this service. The number of vehicles required could vary from one to a few, but ultimately will depend on the store. The service would be available to online customers whose orders reach a minimum requirement in terms of amount and delivery distance. The delivery would be provided at an additional fee, and this fee would either be flat or vary depending on the distance. However, this service would only be provided on only a certain number but not all products, which would range from groceries to household necessities, creating a competitive advantage for Wal-Mart to win customers who do not have enough time to go shopping themselves.
Contingency Plans
In case the integration between Jet.com and Wal-Mart does not go as expected and Jet.com keeps losing money for a long period of time, Wal-Mart could resell Jet.com to other companies who would be interested in buying it, thus allowing Wal-Mart to repay part or all of its initial investment from acquiring it. In addition, if the delivery service does not make economic sense, Wal-Mart could liquidate the delivery vehicles and relating assets, and stop providing this service. Last but not least, in the extreme case that Wal-Mart is unable to continue operating, it could liquidate all of its assets and file bankruptcy with the government. However, this last scenario is nearly impossible for the near future due to Wal-Mart’s strong current position, unless there is a sudden disruptive factor and it is unable to respond.