UK deaths in 2020: how do they compare with previous years?
BMJ 2021; 373 doi: https://doi.org/10.1136/bmj.n896 (Published 13 April 2021) Cite this as: BMJ 2021;373:n896Read our latest coverage of the coronavirus outbreak

- John Appleby, director of research and chief economist
- john.appleby{at}nuffieldtrust.org.uk
The covid-19 pandemic caused huge loss of life last year. The attribution of deaths to covid-19 will have changed within countries over the course of the pandemic, partly as a result of changes in testing and under-recording of covid-19 as a cause early on in the pandemic1; there is also variation between countries because of differences in the practice of recording deaths. Globally, an estimated 1.83 million people died from confirmed covid-19 in 2020.2 In England and Wales, the number of deaths with covid-19 mentioned on the death certificate in 2020 was 80 8303—an average of 221 a day.3
How does 2020 compare with previous years? Provisional figures from the Office for National Statistics (ONS) show 608 002 registered deaths in England and Wales in 2020.4 This was the second highest number of deaths in a year since 1838. The most deaths in the past 183 years occurred in 1918—a year also notable for a pandemic (fig 1). These figures exclude deaths not registered in England and Wales, which means the huge loss of military lives in the two world wars (about 888 000 over the four years of the first world war and 384 000 over the six years of the second world war5) are largely excluded.

Total deaths in England and Wales, 1838-20204
Since 1838 the population of England and Wales has grown nearly fourfold, from 15.2 million to 59.8 million. We would expect more deaths in a larger population. But even taking into account population changes, deaths per 100 000 population were higher in 2020 than in any year since 2003 (fig 2). Comparing year-on-year changes in crude death rate shows just how out of line 2020 is with historical trends. On this measure 2020 had the fifth highest increase (13.8%) historically (fig 3).

Deaths per 100 000 population in England and Wales, 1838-20204
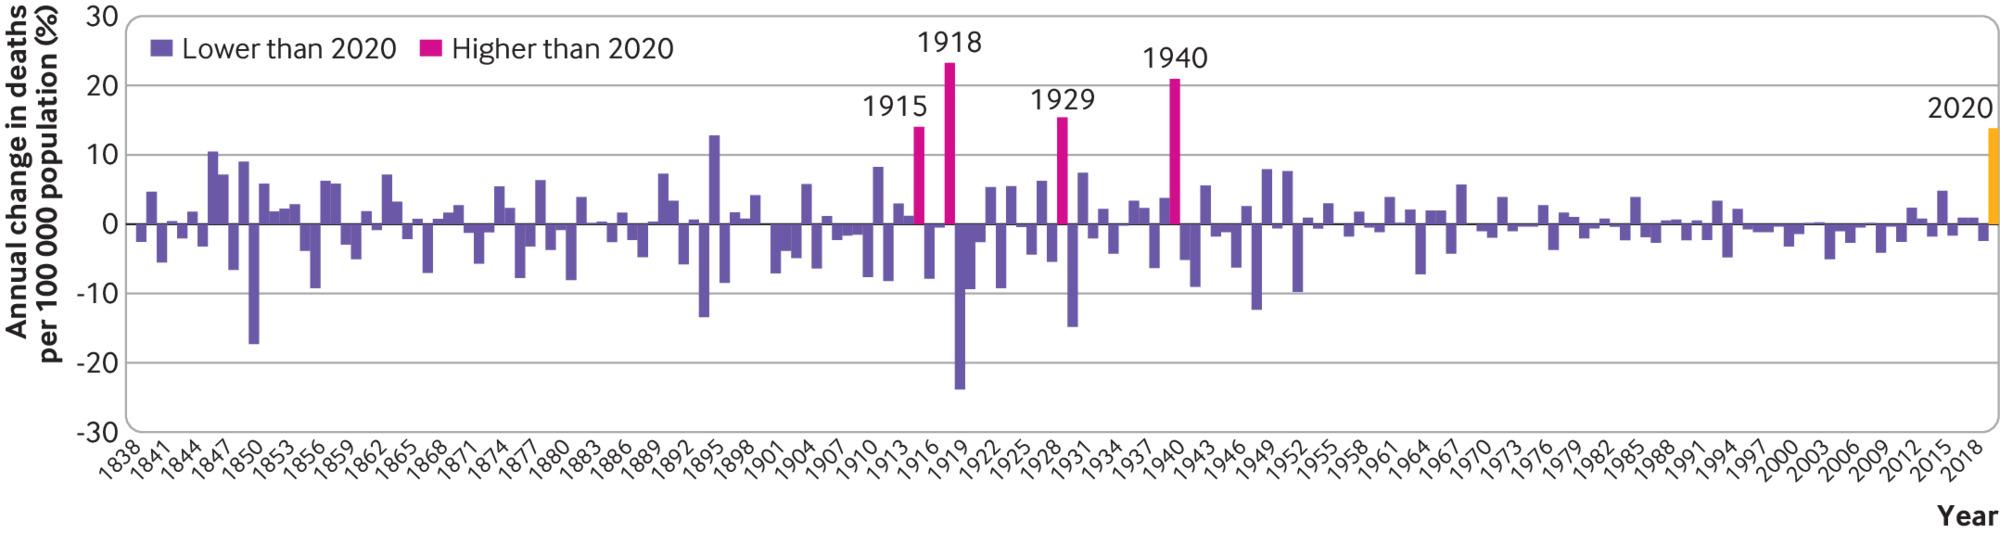
Year-on-year percentage changes in deaths per 100 000 population, England and Wales 1839-20204
But it’s not just the size of the population that has increased over the years. The proportion of older people in the population has also grown. And as with a larger population we would expect the number of deaths to increase as the population ages. The ONS provides age standardised mortality rates per 100 000 back to 1942, which take account of changes in the age structure of the population.
These show huge improvements in death rates since the second world war, with age standardised mortality rates more than halving between 1942 and 2019 (fig 4). But last year bucked the almost straight downward trend to record the highest death rate since 2008 and the highest year-on-year increase since 1943 (fig 5).

Age standardised mortality rates per 100 000 in England and Wales, 1942-20204

Percentage year-on-year changes in age standardised mortality rates per 100 000 in England and Wales, 1943-20204
While covid-19 vaccines, improved treatment, and immunity by infection have started to reduce deaths this year, the pandemic is by no means over. Globally, the number of covid-19 deaths in the first three months of 2021 (up to 30 March) was around 980 000, over 50% more than in the whole of 2020.2 And in just the first 10 weeks of this year (to the week ending 12 March), covid-19 deaths had increased by 67% over last year’s total, to 134 597 in England and Wales.36
Footnotes
Competing interests: I have read and understood BMJ policy on declaration of interests and have no relevant interests to declare.
Provenance and peer review: Commissioned; externally peer reviewed.
This article is made freely available for use in accordance with BMJ's website terms and conditions for the duration of the covid-19 pandemic or until otherwise determined by BMJ. You may use, download and print the article for any lawful, non-commercial purpose (including text and data mining) provided that all copyright notices and trade marks are retained.
https://bmj.com/coronavirus/usage