
Definition
Related Definitions
Volume
What does Volume mean?
In the stock market, volume indicates how much of a particular stock is traded within a specific time frame. Stocks traded more in number because of greater investors interest or significant attention are termed as High-Volume stocks. Comparing the current stock’s volume with the historical volume allows the investor to make investment decisions. Volume assessment also projects the price trend or potential reversal in the market. Therefore, volume is a crucial component for technical traders.
Volume is a measure of the total turnover of shares. Each trade is presented as a ticket and is counted separately even if the same bunch of shares have changed hands multiple times. For example: if 100 shares of ABC were bought, then sold and then re-bought and re-sold, it would result in 4 tickets. Volume, in this case, will be 400 shares.
Summary
- Volume is often taken as a sign of liquidity.
- Volumes are used in technical analysis. it is utilized to confirm patterns and price trends.
- High volume indicates higher participation.
- Volume should be assessed along with the price movement.
- The choice of volume indicator is dependent upon the trader and their requirements.
Frequently Asked Questions (FAQ’s)
What is the importance of volume in trading?
A volume is often used as a technical tool that confirms the chart pattern or price trends. The volume can impact the price movement in the stock market. By analysing the historical volume movement, the investor can predict the stage when the price might lose its momentum.
Volume numbers indicate the interest of the traders in a particular share. The higher volume shows a high level of interest and vice versa.
Volume has a significant positive relation with liquidity. High volume stocks have higher liquidity, and the transactions can be executed smoothly. It allows investors to cash in and out their position in the market quickly.
Generally, high trading volume is observed near the opening and closing time of the stock market, whereas during lunchtime, the trading volume is generally low.
Volume on Charts
The visual presentation of the volume traded throughout the day is present in the price chart of all trading platforms. The volume traded is presented in the form of bars. For example, an hour price chart would show the volume traded in the hourly interval. Generally, the volume bars are either red or green in colour. The red colour represents the volume associated with price moving lower, and the green indicates the volume associated with price moving higher in an hour.
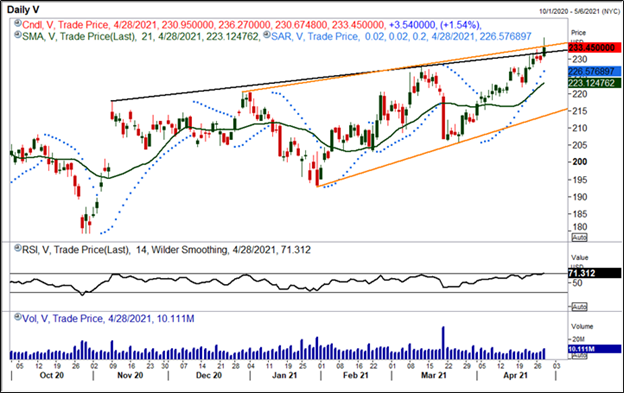
Source: Refinitiv; Analysis: Kalkine Media
How to use volume for technical analysis?
Generally, an investor takes position when the market is weak and aims to make profit when the market shows a strong upward movement. However, a trader should consider several aspects while trading on the basis of the volume.
- Trend Assessment: In the rising market, the volume tends to rise. If stock prices are increasing, but the volume is decreasing, then it depicts lower participation and hence a reversal can be predicted.
- Exhaustion: After a steep rally, if a sharp increase is observed in the stock price along with the volume, then as per technical analysis, this could be a potential end of the current trend.
- Bullish Signs: Volume can be used to predict the bullish market. If the volume increases accompanied by the decreasing price, then the prices will tend to move upward following the initial downward move. If the downward price movement does not cross the previous low, and the volume is lower than before, this could be considered bullish, as selling pressure is assumed to be reducing.
- Price reversal: After high price volatility and trading volume, if the price shows little movement with high volume, then the price reversal (change in the direction of price) could be predicted.
- Historical data: The current volume should be compared with the recent historical data. It will provide information regarding the short-term trading opportunities.
What are the different the Volume indicators?
There are different volume indicators based on which the volume is presented graphically. The difference can be seen in the indicators as they employ different mathematical formulae.
On-balance volume: This indicator shows the relationship between the price change and volume flow. The price is predicted by analysing the cumulative trading volume in the market.
Chaikin Money flow: It measures the flow of money for a chosen time frame. It is used to gauge the buying and selling pressure in a given time. It was developed by Marc Chaikin. This indicator fluctuates between 1 and -1. It is usually used for locating divergence as it oscillates.
Klinger Oscillator: This indicator was developed by Stephen Klinger, it is employed to identify long-term money flow trends keeping an eye on short-term fluctuations. The indicator provides information regarding the forces involved in price moves This indicator gained immense attention as it predicts the price reversal and the trend.