Economy of Mongolia
Last updated 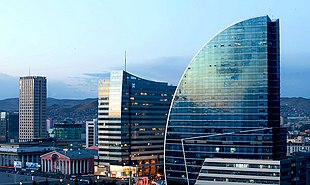 | |
| Currency | Mongolian tögrög (MNT, ₮) |
|---|---|
| Calendar year | |
Trade organizations | WTO, IMF, World Bank, ADB, SCO (Observer) |
Country group |
|
| Statistics | |
| Population | |
| GDP | |
| GDP rank | |
GDP growth |
|
GDP per capita | |
GDP per capita rank | |
GDP by sector |
|
| 10% (202e est.) [5] | |
Population below poverty line | |
| 32.7 medium (2018) [10] | |
Labor force by occupation |
|
| Unemployment | |
Main industries | construction and construction materials, mining (coal, copper, molybdenum, fluorspar, tin, tungsten, and gold), oil, food and beverages, processing of animal products, cashmere wool and natural fiber manufacturing |
| External | |
| Exports | |
Export goods | copper, apparel, livestock, animal products, cashmere, wool, hides, fluorspar, other nonferrous metals, coal, crude oil |
Main export partners |
|
| Imports | |
Import goods | machinery and equipment, fuel, cars, food products, industrial consumer goods, chemicals, building materials, cigarettes and tobacco, appliances, soap and detergent |
Main import partners |
|
FDI stock | |
Gross external debt | |
| Public finances | |
| −6.4% (of GDP) (2017 est.) [7] | |
| Revenues | 2.967 billion (2017 est.) [7] |
| Expenses | 3.681 billion (2017 est.) [7] |
| Economic aid | $185.94 million (2008) |
| Standard & Poor's: [18] BB- (Domestic) BB- (Foreign) BB (T&C Assessment) Outlook: Stable [19] Moody's: B1 Outlook: Stable Fitch: [19] B+ Outlook: Stable | |
The economy of Mongolia has traditionally been based on agriculture and livestock. Mongolia also has extensive mineral deposits: copper, coal, molybdenum, tin, tungsten, and gold account for a large part of industrial production. Soviet assistance, at its height one-third of Gross domestic product (GDP), disappeared almost overnight in 1990–91, in the time of the collapse of the Soviet Union. Mongolia was driven into deep recession.
Contents
- Economic history
- Socialist era
- Transition to a market economy
- Economic development present day
- The Wolf Economy
- Banks
- Commercial banks
- Investment banks
- Environment
- Other statistics
- See also
- References
- External links
Economic growth picked up in 1997–99 after stalling in 1996 due to a series of natural disasters and increases in world prices of copper and cashmere. Public revenues and exports collapsed in 1998 and 1999 due to the repercussions of the Asian financial crisis. In August and September 1999, the economy suffered from a temporary Russian ban on exports of oil and oil products. Mongolia joined the World Trade Organization (WTO) in 1997. [20] The international donor community pledged over $300 million per year in the last Consultative Group Meeting, held in Ulaanbaatar in June 1999. Recently, the Mongolian economy has grown at a fast pace due to an increase in mining and Mongolia attained a GDP growth rate of 11.7% in 2013. [21] However, because much of this growth is export-based, Mongolia is suffering from the global slowdown in mining caused by decreased growth in China. [22]
Economic history

Socialist era
The rapid political changes of 1990–91 marked the beginning of Mongolia's efforts to develop a market economy, but these efforts have been complicated and disrupted by the dissolution and continuing deterioration of the economy of the former Soviet Union. Prior to 1991, 80% of Mongolia's trade was with the former Soviet Union, and 15% was with other Council for Mutual Economic Assistance (CMEA) countries. Mongolia was heavily dependent upon the former Soviet Union for fuel, medicine, and spare parts for its factories and power plants.[ citation needed ]
The former Soviet Union served as the primary market for Mongolian industry. In the 1980s, Mongolia's industrial sector became increasingly important. By 1989, it accounted for an estimated 34% of material products, compared to 18% from agriculture. However, minerals, animals, and animal-derived products still constitute a large proportion of the country's exports. Principal imports included machinery, petroleum, cloth, and building materials.
In the late 1980s, the government began to improve links with non-communist Asia and the West, and tourism in Mongolia developed. As of 1 January 1991, Mongolia and the former Soviet Union agreed to conduct bilateral trade in hard currency at world prices.
Despite its external trade difficulties, Mongolia has continued to press ahead with reform. Privatization of small shops and enterprises has largely been completed in the 1990s, and most prices have been freed. Privatization of large state enterprises has begun. Tax reforms also have begun, and the barter and official exchange rates were unified in late 1991.
Transition to a market economy
Between 1990 and 1993, Mongolia suffered triple-digit inflation, rising unemployment, shortages of basic goods, and food rationing. During that period, economic output contracted by one-third. As market reforms and private enterprise took hold, economic growth began again in 1994–95. Unfortunately, since this growth was fueled in part by over-allocation of bank credit, especially to the remaining state-owned enterprises, economic growth was accompanied by a severe weakening of the banking sector. GDP grew by about 6% in 1995, thanks to largely to a boom in copper prices. Average real economic growth leveled off to about 3.5% in 1996–99 due to the Asian financial crisis, the 1998 Russian financial crisis, and worsening commodity prices, especially copper and gold.
Mongolia's gross domestic product (GDP) growth fell from 3.2% in 1999 to 1.3% in 2000. The decline can be attributed to the loss of 2.4 million livestock in bad weather and natural disasters in 2000. Prospects for development outside the traditional reliance on nomadic, livestock-based agriculture are constrained by Mongolia's landlocked location and lack of basic infrastructure. Since 1990, more than 1,500 foreign companies from 61 countries have invested[ when? ] a total of $338.3 million in Mongolia. By 2003 private companies made up 70% of Mongolian GDP and 80% of exports. [23]
Until recently, there have been a very few restrictions on foreign investments during most of Mongolia's post-socialist period. Consequently, mining industry's contribution to FDI increased to almost 25% in 1999 from zero in 1990. [24]
Economic development present day


Mongolia's reliance on trade with China meant that the worldwide financial crisis hit hard, [25] severely stunting the growth of its economy. With the sharp decrease in metal prices, especially copper (down 65% from July 2008-February 2009), [25] exports of its raw materials withered and by 2009 the stock market MSE Top-20 registered an all-time low since its dramatic spike in mid-2007. [26] Just as the economy started to recover, Mongolia was hit by a Zud over the winter period of 2009–2010, causing many livestock to perish and thus severely affecting cashmere production which accounts for a further 7% of the country's export revenues. [25]
According to the World Bank and International Monetary Fund estimates, real GDP growth reduced from 8% to 2.7% in 2009, and exports shrunk 26% from $2.5Bn to $1.9Bn before a promisingly steady increase up until 2008. [25] Because of this, it was projected that between 20,000 and 40,000 fewer Mongolians (0.7% and 1.4% of the population respectively) will be lifted out of poverty, than would have been the case without the global financial crisis.
In late 2009 and the beginning of 2010, however, the market has begun to recover once again. Having identified and learnt from its previous economic instabilities, legislative reform and a tightened fiscal policy promises to guide the country onwards and upwards. In February 2010, foreign assets were recorded at USD1,569,449 million. [27] New trade agreements are being formed and foreign investors are keeping a close eye on the "Asian Wolf".
Mining is the principal industrial activity in Mongolia, making up 30% of all Mongolian industry. [28] Another important industry is the production of cashmere. Mongolia is the world's second largest producer of cashmere, with the main company, Gobi Cashmere, accounting for 21% of world cashmere production as of 2006. [29]
Total export in 2019 was US$7.6 billion. [30]
The 2022 economic growth is expected to be one percent and international institutions anticipate the economy to speed up by at least six percent in 2023 from expanded commodity exports. [31] A significant commodity export boom is expected starting from 2023 with new coal rail networks to China coming online and increased copper production from Rio Tinto’s underground mine Oyu Tolgoi in southern Mongolia.
The Wolf Economy
The term was coined by Ganhuyag Chuluun Hutagt and subsequently popularized by Renaissance Capital in their report "Mongolia: "Blue-sky opportunity". [32] They state that Mongolia is set to become the new Asian tiger, or "Mongolian wolf" as they prefer to call it, and predict "unstoppable" economic growth. [33] With the recent developments in the mining industry and foreign interest increasing at an astonishing rate, it is claimed that the 'Wolf Economy' looks ready to pounce. The term's aggressive title mirrors the country's attitude in the capital markets, and with newfound mineral prospects it has the chance to retain its title as one of the world's fastest growing economies. [34]
Banks
The banking sector is highly concentrated, with five banks controlling about 80% of financial assets as of 2015: [35] Shares of Mongolia's five largest domestic banks are to be offered to the public for the first time on the soon-to-be partially privatized Mongolian Stock Exchange. [36]
Commercial banks
- KhasBank - KhasBank is a community development bank and microfinance institution headquartered in Ulaanbaatar, with a nationwide network of 100 offices and 1309 staff as of June 2012.
- Khan Bank - Khan Bank has its central office in Ulaanbaatar, where 5 branches are located. It has 24 regional branch offices throughout the country, each of which supervises an additional 15 to 25 smaller branches in its area, totaling 512. [37]
- Golomt Bank - Golomt Bank started in 1995 and now manages around 23% of the assets in the domestic banking system.
- Trade and Development Bank - TDB was formed in 1990 and is thus the oldest bank in Mongolia. It has a network of 28 branches and settlement centers, 60 ATMs, 1300 POS terminals, and Internet/SMS banking throughout the country. [38] Foreign banks like ING are breaking into the market.
In terms of access to credit, Mongolia ranked 61st out of 189 economies in accordance with 2015 Ease of Doing Business survey. [39] However, Mongolia had one of the highest banking branch penetration rates in the world at 1 bank branch per 15,257 residents as of May 2015. [35]
Investment banks
With a strengthening capital market environment, many foreign and local investment institutions have begun to establish themselves in Mongolia. The most prominent local agencies include: TDB Capital Archived 31 December 2019 at the Wayback Machine , Eurasia Capital, Monet Investment Bank, BDSec, MICC Archived 18 August 2020 at the Wayback Machine , and Frontier Securities.
Environment
As a result of rapid urbanization and industrial growth policies under the communist regime, Mongolia's deteriorating environment has become a major concern. The burning of soft coal coupled with thousands[ citation needed ] of factories in Ulaanbaatar and a sharp increase in individual motorization [ citation needed ] has resulted in severe air pollution. Deforestation, overgrazed pastures, and, less recently, efforts to increase grain and hay production by plowing up more virgin land have increased soil erosion from wind and rain.
Other statistics
The following table shows the main economic indicators in 2007–2022. [40] [ full citation needed ]
| Year | 2007 | 2008 | 2009 | 2010 | 2011 | 2012 | 2013 | 2014 | 2015 | 2016 | 2017 | 2018 | 2019 | 2020 | 2021 | 2022 |
|---|---|---|---|---|---|---|---|---|---|---|---|---|---|---|---|---|
| GDP in $billion (PPP) | 17.5 | 19.3 | 19.0 | 20.6 | 24.7 | 28.9 | 30.4 | 32.5 | 31.9 | 32.8 | 35.4 | 39.0 | 42.0 | 40.5 | 42.9 | 47.1 |
| GDP per capita in units (PPP) | 6,841 | 7,250 | 6,969 | 7,357 | 8,474 | 9,332 | 10,197 | 10,760 | 10,796 | 10,739 | 11,137 | 11,775 | 12,215 | 11,447 | 11,456 | 11,567 |
| GDP growth in percentage (real) | 8.8 | 7.8 | -2.1 | 7.3 | 17.3 | 12.3 | 11.6 | 7.9 | 2.4 | 1.5 | 5.6 | 7.7 | 5.6 | -4.6 | 1.6 | 2.5 |
| Inflation in percentage | 17.8 | 22.1 | 4.2 | 12.9 | 8.9 | 14.1 | 12.5 | 10.4 | 1.0 | 1.3 | 6.3 | 8.2 | 5.2 | 2.3 | 13.5 | 14.2 |
Household income or consumption by percentage share:
- lowest 10%: 3.5%
- highest 10%: 35% (2005)
Distribution of family income - Gini index: 40 (2000)
Agriculture - products: wheat, barley, vegetables, forage crops, sheep, goats, cattle, camels, horses
Industries: construction and construction materials; mining (coal, copper, molybdenum, fluorspar, and gold); food and beverages; processing of animal products, cashmere wool and natural fiber manufacturing
Industrial production growth rate: 6% (2010 est.)
Electricity:
- production: 3.43 TWh (2006 est.)
- consumption: 2.94 TWh (2006 est.)
- exports: 15.95 GWh (2006 est.)
- imports: 125 GWh (2006 est.)
Electricity - production by source:
- fossil fuel: 80%
- hydro: 0%
- other: 20% (2011)
- nuclear: 0%
Oil:
- production:822 barrels per day (130.7 m3/d) (2006 est.)
- consumption:11,220 barrels per day (1,784 m3/d) (2006 est.)
- exports:822 barrels per day (130.7 m3/d) (2006 est.)
- imports:12,280 barrels per day (1,952 m3/d) (2006 est.)
Exports - commodities: copper, apparel, livestock, animal products, cashmere wool, hides, fluorspar, other nonferrous metals
Imports - commodities: machinery and equipment, fuel, cars, food products, industrial consumer goods, chemicals, building materials, sugar, tea
Exchange rates: tögrögs/tugriks per US dollar: 1890 (2014), 1396 (2012), 1,420 (2009), 1,179.6 (2006), 1,205 (2005), 1,187.17 (2004), 1,171 (2003), 1,110.31 (2002), 1,097.7 (2001), 1,076.67 (2000)
See also
Related Research Articles
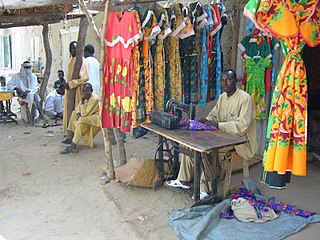
The economy of Chad suffers from the landlocked country's geographic remoteness, drought, lack of infrastructure, and political turmoil. About 85% of the population depends on agriculture, including the herding of livestock. Of Africa's Francophone countries, Chad benefited least from the 50% devaluation of their currencies in January 1994. Financial aid from the World Bank, the African Development Bank, and other sources is directed largely at the improvement of agriculture, especially livestock production. Because of lack of financing, the development of oil fields near Doba, originally due to finish in 2000, was delayed until 2003. It was finally developed and is now operated by ExxonMobil. In terms of gross domestic product, Chad ranks 147th globally with $11.051 billion as of 2018.

The economy of Ethiopia is a mixed and transition economy with a large public sector. The government of Ethiopia is in the process of privatizing many of the state-owned businesses and moving toward a market economy. The banking, telecommunication and transportation sectors of the economy are dominated by government-owned companies.

The economy of Gabon is characterized by strong links with France, large foreign investments, dependence on skilled foreign labor, and decline of agriculture. Gabon on paper enjoys a per capita income four times that of most nations of Africa, but its reliance on resource extraction industry fail to release much of the population from extreme poverty, as much of 30% of the population lives under the poverty threshold.

The economy of Kyrgyzstan is heavily dependent on the agricultural sector. Cotton, tobacco, wool, and meat are the main agricultural products, although only tobacco and cotton are exported in any quantity. According to Healy Consultants, Kyrgyzstan's economy relies heavily on the strength of industrial exports, with plentiful reserves of gold, mercury and uranium. The economy also relies heavily on remittances from foreign workers. Following independence, Kyrgyzstan was progressive in carrying out market reforms, such as an improved regulatory system and land reform. In 1998, Kyrgyzstan was the first Commonwealth of Independent States (CIS) country to be accepted into the World Trade Organization. Much of the government's stock in enterprises has been sold. Kyrgyzstan's economic performance has been hindered by widespread corruption, low foreign investment and general regional instability. Despite those issues, Kyrgyzstan is ranked 70th on the ease of doing business index.

The economy of Laos is a lower-middle income developing economy. Being one of the socialist states, the Lao economic model resembles the Chinese socialist market and/or Vietnamese socialist-oriented market economies by combining high degrees of state ownership with openness to foreign direct investment and private ownership in a predominantly market-based framework.

The economy of Malawi is $7.522 billion by gross domestic product as of 2019, and is predominantly agricultural, with about 80% of the population living in rural areas. The landlocked country in south central Africa ranks among the world's least developed countries. In 2017, agriculture accounted for about one-third of GDP and about 80% of export revenue. The economy depends on substantial inflows of economic assistance from the IMF, the World Bank, and individual donor nations. The government faces strong challenges: to spur exports, to improve educational and health facilities, to face up to environmental problems of deforestation and erosion, and to deal with the problem of HIV/AIDS in Africa. Malawi is a least developed country according to United Nations.

The economy of Mali is based to a large extent upon agriculture, with a mostly rural population engaged in subsistence agriculture.
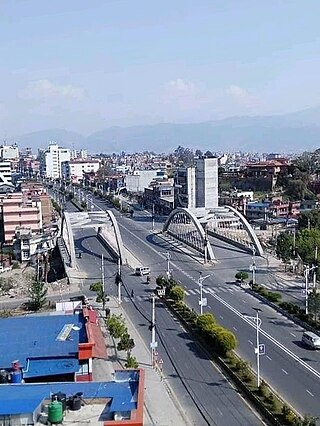
The economy of Nepal is developing category and largely dependent on agriculture and remittances. Until the mid-20th century Nepal was an isolated pre-industrial society, which entered the modern era in 1951 without schools, hospitals, roads, telecommunications, electric power, industry, or civil service. The country has, however, made progress toward sustainable economic growth since the 1950s. The country was opened to economic liberalization, leading to economic growth and improvement in living standards when compared to the past. The biggest challenges faced by the country in achieving higher economic development are the frequent changes in political leadership, as well as corruption.

The economy of Nicaragua is focused primarily on the agricultural sector. Nicaragua itself is the least developed country in Central America, and the second poorest in the Americas by nominal GDP. In recent years, under the administrations of Daniel Ortega, the Nicaraguan economy has expanded somewhat, following the Great Recession, when the country's economy actually contracted by 1.5%, due to decreased export demand in the American and Central American markets, lower commodity prices for key agricultural exports, and low remittance growth. The economy saw 4.5% growth in 2010 thanks to a recovery in export demand and growth in its tourism industry. Nicaragua's economy continues to post growth, with preliminary indicators showing the Nicaraguan economy growing an additional 5% in 2011. Consumer Price inflation have also curtailed since 2008, when Nicaragua's inflation rate hovered at 19.82%. In 2009 and 2010, the country posted lower inflation rates, 3.68% and 5.45%, respectively. Remittances are a major source of income, equivalent to 15% of the country's GDP, which originate primarily from Costa Rica, the United States, and European Union member states. Approximately one million Nicaraguans contribute to the remittance sector of the economy.

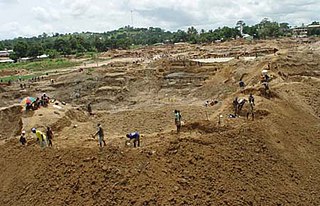
The gross domestic product (GDP) of Niger was $16.617 billion US dollars in 2023, according to official data from the World Bank. This data is based largely on internal markets, subsistence agriculture, and the export of raw commodities: foodstuffs to neighbors and raw minerals to world markets. Niger, a landlocked West African nation that straddles the Sahel, has consistently been ranked on the bottom of the Human Development Index, at 0.394 as of 2019. It has a very low per capita income, and ranks among the least developed and most heavily indebted countries in the world, despite having large raw commodities and a relatively stable government and society not currently affected by civil war or terrorism. Economic activity centers on subsistence agriculture, animal husbandry, re-export trade, and export of uranium.

The economy of the Republic of the Congo is a mixture of subsistence hunting and agriculture, an industrial sector based largely on petroleum extraction and support services. Government spending is characterized by budget problems and overstaffing. Petroleum has supplanted forestry as the mainstay of the economy, providing a major share of government revenues and exports. Nowadays the Republic of the Congo is increasingly converting natural gas to electricity rather than burning it, greatly improving energy prospects.

Once a single-crop agricultural economy, Saint Lucia has shifted to a tourism and banking serviced-based economy. Tourism, the island's biggest industry and main source of jobs, income and foreign exchange, accounts for 65% of its GDP. Agriculture, which was once the biggest industry, now contributes to less than 3% of GDP, but still accounts for 20% of jobs. The banana industry is now on a decline due to strong competition from low-cost Latin American producers and reduced European trade preferences, but the government has helped revitalize the industry, with 13,734 tonnes exported in 2018. Agricultural crops grown for export are bananas, mangoes, and avocados. The island is considered to have the most diverse and well-developed manufacturing industry in the eastern Caribbean.

The economy of Senegal is driven by mining, construction, tourism, fishing and agriculture, which are the main sources of employment in rural areas, despite abundant natural resources in iron, zircon, gas, gold, phosphates, and numerous oil discoveries recently. Senegal's economy gains most of its foreign exchange from fish, phosphates, groundnuts, tourism, and services. As one of the dominant parts of the economy, the agricultural sector of Senegal is highly vulnerable to environmental conditions, such as variations in rainfall and climate change, and changes in world commodity prices.

The economy of Seychelles is based on fishing, tourism, processing of coconuts and vanilla, coir rope, boat building, printing, furniture and beverages. Agricultural products include cinnamon, sweet potatoes, cassava (tapioca), bananas, poultry and tuna.
The economy of Sierra Leone is $4.082 billion by gross domestic product as of 2018. Since the end of the Sierra Leone Civil War in 2002, the economy is gradually recovering with a gross domestic product growth rate between 4 and 7%. In 2008 it in PPP ranked between 147th by World Bank, and 153rd by CIA, largest in the world.
The economy of Uzbekistan was formerly associated with a Soviet-style command economy, with a slow transformation to a market economy. However, in recent years and since the election of President Shavkat Mirziyoyev, Uzbekistan has seen rapid economic and social reform, aimed at boosting growth and transforming Uzbekistan into a true, modern market economy. International Financial Institutions, including EBRD, Asian Development Bank and the World Bank are actively engaging in supporting Uzbekistan's successful reform process and have rapidly increased their presence in the country.

The economy of Papua New Guinea (PNG) is largely underdeveloped with the vast majority of the population living below the poverty line. However, according to the Asian Development Bank its GDP is expected to grow 3.4% in 2022 and 4.6% in 2023. It is dominated by the agricultural, forestry, and fishing sector and the minerals and energy extraction sector. The agricultural, forestry, and fishing sector accounts for most of the labour force of PNG while the minerals and energy extraction sector, including gold, copper, oil and natural gas is responsible for most of the export earnings.

The economy of the Gambia is heavily reliant on agriculture. The Gambia has no significant mineral or other natural resources, and has a limited agricultural base. About 75% of the population depends on crops and livestock for its livelihood. Small-scale manufacturing activity features the processing of peanuts, fish, and animal hides.

Erdenet is the second-largest city in Mongolia, with a 2018 population of 98,057, and the capital of the aimag (province) of Orkhon. Located in the northern part of the country, it lies in a valley between the Selenge and Orkhon rivers about 240 km (149 mi) northwest of Ulaanbaatar, Darkhan, the capital. The road length between Ulaanbaatar and Erdenet is about 370 km (230 mi).

The economy of Ivory Coast is stable and currently growing, in the aftermath of political instability in recent decades. The Ivory Coast's economy is largely market-based and depends heavily on the agricultural sector. Almost 70% of the Ivorian people are engaged in some form of agricultural activity. GDP per capita grew 82% in the 1960s, reaching a peak growth of 360% in the 1970s, but this proved unsustainable and it shrank by 28% in the 1980s and a further 22% in the 1990s. This decline, coupled with high population growth, resulted in a steady fall in living standards. The Gross national product per capita, now rising again, was about US$727 in 1996. It was substantially higher two decades before.
References
This article needs additional citations for verification .(April 2010) |
- ↑ "World Economic Outlook Database, April 2019". IMF.org. International Monetary Fund . Retrieved 29 September 2019.
- ↑ "World Bank Country and Lending Groups". datahelpdesk.worldbank.org. World Bank . Retrieved 29 September 2019.
- ↑ "Population, total - Mongolia". data.worldbank.org. World Bank . Retrieved 13 October 2019.
- 1 2 3 "World Economic Outlook Database, October 2019". IMF.org. International Monetary Fund . Retrieved 20 October 2019.
- 1 2 3 "World Economic Outlook Database, April 2020". IMF.org. International Monetary Fund. Retrieved 20 April 2020.
- ↑ Global Economic Prospects, June 2020. World Bank. 8 June 2020. p. 74. doi:10.1596/978-1-4648-1553-9. ISBN 978-1-4648-1553-9 . Retrieved 10 June 2020.
{{cite book}}:|website=ignored (help) - 1 2 3 4 5 6 7 8 9 10 11 12 13 "The World Factbook". CIA.gov. Central Intelligence Agency . Retrieved 5 April 2019.
- ↑ "Poverty headcount ratio at national poverty lines (% of population) - Mongolia". data.worldbank.org. World Bank. Retrieved 9 January 2020.
- ↑ "Poverty headcount ratio at $3.20 a day (2011 PPP) (% of population) - Mongolia". data.worldbank.org. World Bank. Retrieved 21 March 2020.
- ↑ "GINI index (World Bank estimate) - Mongolia". data.worldbank.org. World Bank. Retrieved 21 March 2020.
- ↑ "Human Development Index (HDI)". hdr.undp.org. HDRO (Human Development Report Office) United Nations Development Programme . Retrieved 11 December 2019.
- ↑ "Inequality-adjusted Human Development Index (IHDI)". hdr.undp.org. HDRO (Human Development Report Office) United Nations Development Programme. Archived from the original on 12 December 2020. Retrieved 11 December 2019.
- ↑ "UNEMPLOYMENT RATE, sex, region, aimag and the Capital, by quarter, annual". 1212.mn. National Statistics Office of Mongolia. Retrieved 3 February 2020.
- ↑ "Unemployment, youth total (% of total labor force ages 15-24) (national estimate) - Mongolia". data.worldbank.org. World Bank. Retrieved 3 February 2020.
- ↑ "Ease of Doing Business in Mongolia". Doingbusiness.org. Retrieved 23 January 2017.
- ↑ "Mongolia trade balance, exports, imports by country 2020 | WITS Data". WITS, World Integrate Trade Solution.
- ↑ "Mongolia trade balance, exports, imports by country 2020 | WITS Data". WITS, World Integrate Trade Solution.
- ↑ "Sovereigns rating list". Standard & Poor's. Retrieved 26 May 2011.
- 1 2 Rogers, Simon; Sedghi, Ami (15 April 2011). "How Fitch, Moody's and S&P rate each country's credit rating". The Guardian. Retrieved 31 May 2011.
- ↑ Montsame News Agency. Mongolia. 2006, Foreign Service Office of Montsame News Agency, ISBN 99929-0-627-8, p. 72
- ↑ philip (23 March 2014). "Mongolia's economic prospects and challenges". East Asia Forum Quarterly: Volume 6, Number 1, 2014. 6 (1): 3–5. Retrieved 10 August 2016.
- ↑ Anonymous (2 September 2014). "Mongolia: Economy". Asian Development Bank. Retrieved 10 August 2016.
- ↑ Montsame News Agency. Mongolia. 2006, Foreign Service Office of Montsame News Agency, ISBN 99929-0-627-8, p. 67
- ↑ Enerelt Enkhbold, 2014. "The Impact of SEFILM on the Valuation of Mining Companies". Монголын Нийгэм-Эдийн Засгийн Өнөөгийн Байдал, Тулгамдсан Асуудлууд. Илтгэлүүдийн эмхэтгэл, pp. 240–253
- 1 2 3 4 "Mongolia Quarterly review for February 2009" (PDF). World Bank.
- ↑ "Монголын Хөрөнгийн Бирж". Mongolian Stock Exchange.
- ↑ "Bank of Mongolia Monthly Stat Bulletin". Bank of Mongolia. February 2010.[ permanent dead link ]
- ↑ Montsame News Agency. Mongolia. 2006, Foreign Service Office of Montsame News Agency, ISBN 99929-0-627-8, p. 82
- ↑ Montsame News Agency. Mongolia. 2006, Foreign Service Office of Montsame News Agency, ISBN 99929-0-627-8, p. 86
- ↑ "Mongolia | Imports and Exports | World | ALL COMMODITIES | Value (US$) and Value Growth, YoY (%) | 2003 - 2019". 14 November 2021.
- ↑ Adiya, Amar (22 June 2022). "Mongolia's Economy Plunges Amid Border Disruptions and Growing Food Shortages". Mongolia Weekly. Retrieved 11 September 2022.
- ↑ "Archived copy" (PDF). www.petromatad.com. Archived from the original (PDF) on 27 April 2015. Retrieved 11 January 2022.
{{cite web}}: CS1 maint: archived copy as title (link) - ↑ "Mongolian Wolf to Be 'Unstoppable'". biznetwork.mn / Bloomberg. 14 December 2009.
- ↑ "Investment in Mongolia 2019 - KPMG Mongolia". KPMG. 16 November 2020. Retrieved 14 May 2021.
- 1 2 Aaron Batten, Poullang Doung, Enerelt Enkhbold, Gemma Estrada, Jan Hansen, George Luarsabishvili, Md. Goland Mortaza, and Donghyun Park, 2015. The Financial Systems of Financially Less Developed Asian Economies: Key Features and Reform Priorities. ADB Economics Working Paper Series No. 450
- ↑ Adiya, Amar (25 May 2022). "What You Need To Know About Mongolia and What's On the Horizon in H2 2022". Mongolia Weekly. Retrieved 27 May 2022.
- ↑ "Mission statement". Archived from the original on 24 April 2013. Retrieved 7 May 2013.
- ↑ "Introduction: Trade and Development Bank of Mongolia". Trade and Development Bank of Mongolia. Archived from the original on 22 July 2011.
- ↑ "Doing Business in Mongolia - World Bank Group". Archived from the original on 6 December 2011. Retrieved 21 November 2011.
- ↑ "Report for Selected Countries and Subjects". www.imf.org/en/Home. Retrieved 23 March 2023.
External links
- (in English and Mongolian) Official site of the Ministry of Finance
- (in English and Mongolian) Official government site of the Bank of Mongolia - the central bank Archived 28 April 2021 at the Wayback Machine
- Mongolia CIA World Factbook

| System | |||
|---|---|---|---|
| Issues | |||
| Agreements |
| ||
| Ministerial Conferences | |||
| People | |||
| Members |
| ||
| |||
| Sovereign states |
|
|---|---|
| States with limited recognition | |
| Dependencies and other territories | |
Text is available under the CC BY-SA 4.0 license; additional terms may apply.
Images, videos and audio are available under their respective licenses.