Markets
Investing Megatrend: How Rapid Urbanization is Shaping the Future

How Rapid Urbanization is Shaping the Future
The world is constantly changing, and many of these shifts have the potential to alter the investment landscape.
While some of these changes can be temporary and fleeting, others can be powerful, transformative “megatrends” that shape how society is organized at a fundamental level.
One such megatrend that has been in place for decades is the rapid rate of population growth in urban areas — and while it’s been highly influential thus far, we’ve likely only seen the beginning of its formative impact on the global economy.
An Intro to Rapid Urbanization
Today’s infographic comes to us from iShares by BlackRock, and it highlights the case for rapid urbanization as being one of the most important overarching trends to watch in markets over the long term.
It’s a trend that originated in developed economies in the 21st century, as people transitioned from agricultural work to factory and service jobs.
| Region | Urban share of population (1900) | Urban share of population (2016) |
|---|---|---|
| United States | 40% | 82% |
| Japan | 12% | 91% |
| Western Europe | 41% | 80% |
In these developed economies today, cities are major sources of innovation and wealth creation, and the World Bank estimates that over 80% of global GDP is now generated in cities.
A Global Shift
Over the coming decades, the large-scale role of cities will become even more amplified as rapid urbanization spills over to the rest of the world.
Billions of people — especially in Asia and Africa — will be seeking opportunities in cities over the coming decades. Between 2018 and 2050, the global urban population will increase from 55% to 68%, adding another 2.5 billion people to cities around the world.
| Rank | Country | Urban population growth (2018-2050) |
|---|---|---|
| #1 | India | 416 million people |
| #2 | China | 255 million people |
| #3 | Nigeria | 189 million people |
Nearly 90% of this growth will be in Africa and Asia, with India alone adding 416 million new people to its cities — more than any other country in the world over this timeframe.
The Dawn of the Megacity
People are not only flocking to cities, they are flocking to megacities — urban conglomerations with more than 10 million people.
In just 40 years, the total amount of megacities will quadruple, gaining nearly 600 million residents in the process:
| Year | # of Megacities | Population | % of Urban Population |
|---|---|---|---|
| 1990 | 10 | 153 million | 7% |
| 2010 | 23 | 370 million | 12% |
| 2030 | 41 | 730 million | 14% |
With billions of new people living in urban areas — and many of them living in megacities — we will have to rethink how our cities are designed and engineered.
And as this happens, the city as we know it will be revolutionized.
The Urban Opportunity
Rapid urbanization will create both opportunities and challenges for society, and a plethora of investment possibilities in the process.
As global cities become more integrated with technology, new business models will emerge as cities become smarter, denser, and more connected.
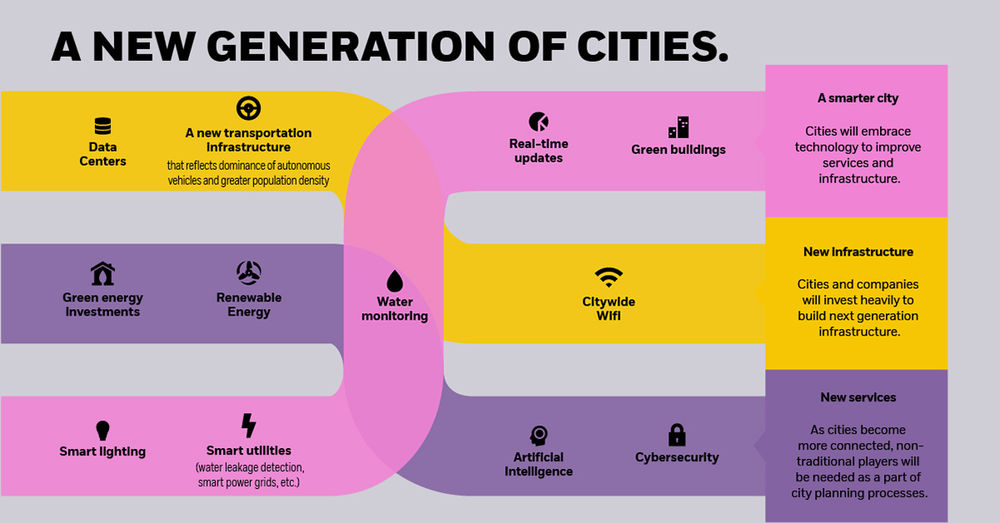
These potential opportunities include:
- Smarter cities
Cities will embrace technology to improve services and infrastructure, adding tech-driven features like smart lighting or real-time traffic updates. - New infrastructure
Cities and companies will invest heavily to build next generation infrastructure, such as data centers, green energy, and citywide WiFi. - A focus on personal security
With higher crime rates in cities than rural areas, governments will employ elevated levels of surveillance on citizens in cities. Increasing connectivity means that every activity is logged and monitored. - New services
As cities become more connected, non-traditional players — such as cybersecurity experts or cleantech engineers — will be needed as a part of city planning processes. - No car ownership
A lack of space and the rise of autonomous cars will mean fewer people will own a car, preferring to use ‘summon-able’ services instead. - New healthcare systems
As population density grows to unprecedented levels, existing healthcare systems will need to be radically overhauled to deal with this influx.
Rapid urbanization will have a wide-ranging impact on global economics, demographics, and society as a whole.
As rapid urbanization and other megatrends collide and feed off each other, there’s no doubt that even more thematic investment opportunities will be created.


Markets
Mapped: Europe’s GDP Per Capita, by Country
Which European economies are richest on a GDP per capita basis? This map shows the results for 44 countries across the continent.


Mapped: Europe’s GDP Per Capita, by Country (2024)
This was originally posted on our Voronoi app. Download the app for free on iOS or Android and discover incredible data-driven charts from a variety of trusted sources.
Europe is home to some of the largest and most sophisticated economies in the world. But how do countries in the region compare with each other on a per capita productivity basis?
In this map, we show Europe’s GDP per capita levels across 44 nations in current U.S. dollars. Data for this visualization and article is sourced from the International Monetary Fund (IMF) via their DataMapper tool, updated April 2024.
Europe’s Richest and Poorest Nations, By GDP Per Capita
Luxembourg, Ireland, and Switzerland, lead the list of Europe’s richest nations by GDP per capita, all above $100,000.
| Rank | Country | GDP Per Capita (2024) |
|---|---|---|
| 1 | 🇱🇺 Luxembourg | $131,380 |
| 2 | 🇮🇪 Ireland | $106,060 |
| 3 | 🇨🇭 Switzerland | $105,670 |
| 4 | 🇳🇴 Norway | $94,660 |
| 5 | 🇮🇸 Iceland | $84,590 |
| 6 | 🇩🇰 Denmark | $68,900 |
| 7 | 🇳🇱 Netherlands | $63,750 |
| 8 | 🇸🇲 San Marino | $59,410 |
| 9 | 🇦🇹 Austria | $59,230 |
| 10 | 🇸🇪 Sweden | $58,530 |
| 11 | 🇧🇪 Belgium | $55,540 |
| 12 | 🇫🇮 Finland | $55,130 |
| 13 | 🇩🇪 Germany | $54,290 |
| 14 | 🇬🇧 UK | $51,070 |
| 15 | 🇫🇷 France | $47,360 |
| 16 | 🇦🇩 Andorra | $44,900 |
| 17 | 🇲🇹 Malta | $41,740 |
| 18 | 🇮🇹 Italy | $39,580 |
| 19 | 🇨🇾 Cyprus | $37,150 |
| 20 | 🇪🇸 Spain | $34,050 |
| 21 | 🇸🇮 Slovenia | $34,030 |
| 22 | 🇪🇪 Estonia | $31,850 |
| 23 | 🇨🇿 Czech Republic | $29,800 |
| 24 | 🇵🇹 Portugal | $28,970 |
| 25 | 🇱🇹 Lithuania | $28,410 |
| 26 | 🇸🇰 Slovakia | $25,930 |
| 27 | 🇱🇻 Latvia | $24,190 |
| 28 | 🇬🇷 Greece | $23,970 |
| 29 | 🇭🇺 Hungary | $23,320 |
| 30 | 🇵🇱 Poland | $23,010 |
| 31 | 🇭🇷 Croatia | $22,970 |
| 32 | 🇷🇴 Romania | $19,530 |
| 33 | 🇧🇬 Bulgaria | $16,940 |
| 34 | 🇷🇺 Russia | $14,390 |
| 35 | 🇹🇷 Türkiye | $12,760 |
| 36 | 🇲🇪 Montenegro | $12,650 |
| 37 | 🇷🇸 Serbia | $12,380 |
| 38 | 🇦🇱 Albania | $8,920 |
| 39 | 🇧🇦 Bosnia & Herzegovina | $8,420 |
| 40 | 🇲🇰 North Macedonia | $7,690 |
| 41 | 🇧🇾 Belarus | $7,560 |
| 42 | 🇲🇩 Moldova | $7,490 |
| 43 | 🇽🇰 Kosovo | $6,390 |
| 44 | 🇺🇦 Ukraine | $5,660 |
| N/A | 🇪🇺 EU Average | $44,200 |
Note: Figures are rounded.
Three Nordic countries (Norway, Iceland, Denmark) also place highly, between $70,000-90,000. Other Nordic peers, Sweden and Finland rank just outside the top 10, between $55,000-60,000.
Meanwhile, Europe’s biggest economies in absolute terms, Germany, UK, and France, rank closer to the middle of the top 20, with GDP per capitas around $50,000.
Finally, at the end of the scale, Eastern Europe as a whole tends to have much lower per capita GDPs. In that group, Ukraine ranks last, at $5,660.
A Closer Look at Ukraine
For a broader comparison, Ukraine’s per capita GDP is similar to Iran ($5,310), El Salvador ($5,540), and Guatemala ($5,680).
According to experts, Ukraine’s economy has historically underperformed to expectations. After the fall of the Berlin Wall, the economy contracted for five straight years. Its transition to a Western, liberalized economic structure was overshadowed by widespread corruption, a limited taxpool, and few revenue sources.
Politically, its transformation from authoritarian regime to civil democracy has proved difficult, especially when it comes to institution building.
Finally, after the 2022 invasion of the country, Ukraine’s GDP contracted by 30% in a single year—the largest loss since independence. Large scale emigration—to the tune of six million refugees—is also playing a role.
Despite these challenges, the country’s economic growth has somewhat stabilized while fighting continues.

-

 Healthcare5 days ago
Life Expectancy by Region (1950-2050F)
-

 Economy2 weeks ago
Ranked: The Top 20 Countries in Debt to China
-

 Politics2 weeks ago
Charted: Trust in Government Institutions by G7 Countries
-

 Energy2 weeks ago
Mapped: The Age of Energy Projects in Interconnection Queues, by State
-

 Mining2 weeks ago
Visualizing Global Gold Production in 2023
-

 Markets1 week ago
Visualized: Interest Rate Forecasts for Advanced Economies
-

 Economy1 week ago
The Most Valuable Companies in Major EU Economies
-

 Markets1 week ago
The World’s Fastest Growing Emerging Markets (2024-2029 Forecast)