This problem has been solved!
You'll get a detailed solution from a subject matter expert that helps you learn core concepts.
See AnswerSee Answer done loadingQuestion: The data set shows the October 1 noon temperatures in degrees Fahrenheit for a particular city in each of the past 6 years. 76, 71, 78, 61, 85, 73 What is the five-number summary of the data set? What is the mean, x bar, of the data set? What is the sum of the squares of the differences between each data value and the mean? Use the table to organize your
 Here’s the best way to solve it.Who are the experts?Experts have been vetted by Chegg as specialists in this subject.Expert-verified


Transcribed image text:
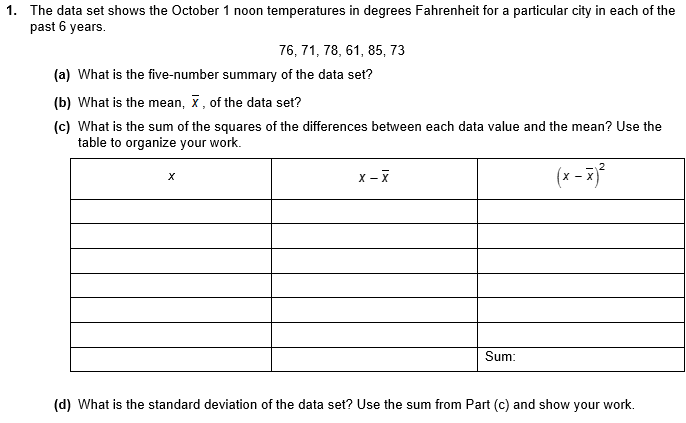
The data set shows the October 1 noon temperatures in degrees Fahrenheit for a particular city in each of the past 6 years. 76, 71, 78, 61, 85, 73 What is the five-number summary of the data set? What is the mean, x bar, of the data set? What is the sum of the squares of the differences between each data value and the mean? Use the table to organize your work. What is the standard deviation of the data set? Use the sum from Part (c) and show your work.
Not the question you’re looking for?
Post any question and get expert help quickly.