We talk about deer movements a lot on this blog. Movements before the rut, during the rut, after the rut, during gun season, in rain, in wind, before storms, in storms, after storms, in heat waves, in summer, in fawning season, in January, in October – you get the picture.
Following animals around with various tracking devices is nothing new. Researchers have been studying animal movements for decades. The first studies were published in the early 1960s. Home ranges, habitat use, dispersal, migration, survival, and, of course, behavior.
Indeed, the wildlife profession has learned much from plotting points and drawing lines. We know that dispersal is a fact of life for the majority of yearling males, but yearling females have their own unique dispersal story. We know that buck movements skyrocket during the rut while females are quite content to sit and wait. We know that landscape features influence movements. We know that the leading cause of mortality for a deer is a hunter.
But can behavior be inferred from those points and lines? Can life history events like parturition (birth) or breeding be seen on a map?
Certainly we have tried. Since we have both males and females collared in the same area, could we detect a breeding event? We speculated once but speculation isn’t more than a good blog post in this field. But peer reviewed research is a standard by which all research is judged and now we have that too.
Movement and location data from the Deer Forest Study were recently analyzed to determine if two methods could identify male-female interaction events in the breeding season. My eyes nearly went cross from reading it and Duane suggested that if I paired it with a beer it would make more sense. It is pretty heady stuff (the paper, not necessarily the beer I was drinking).
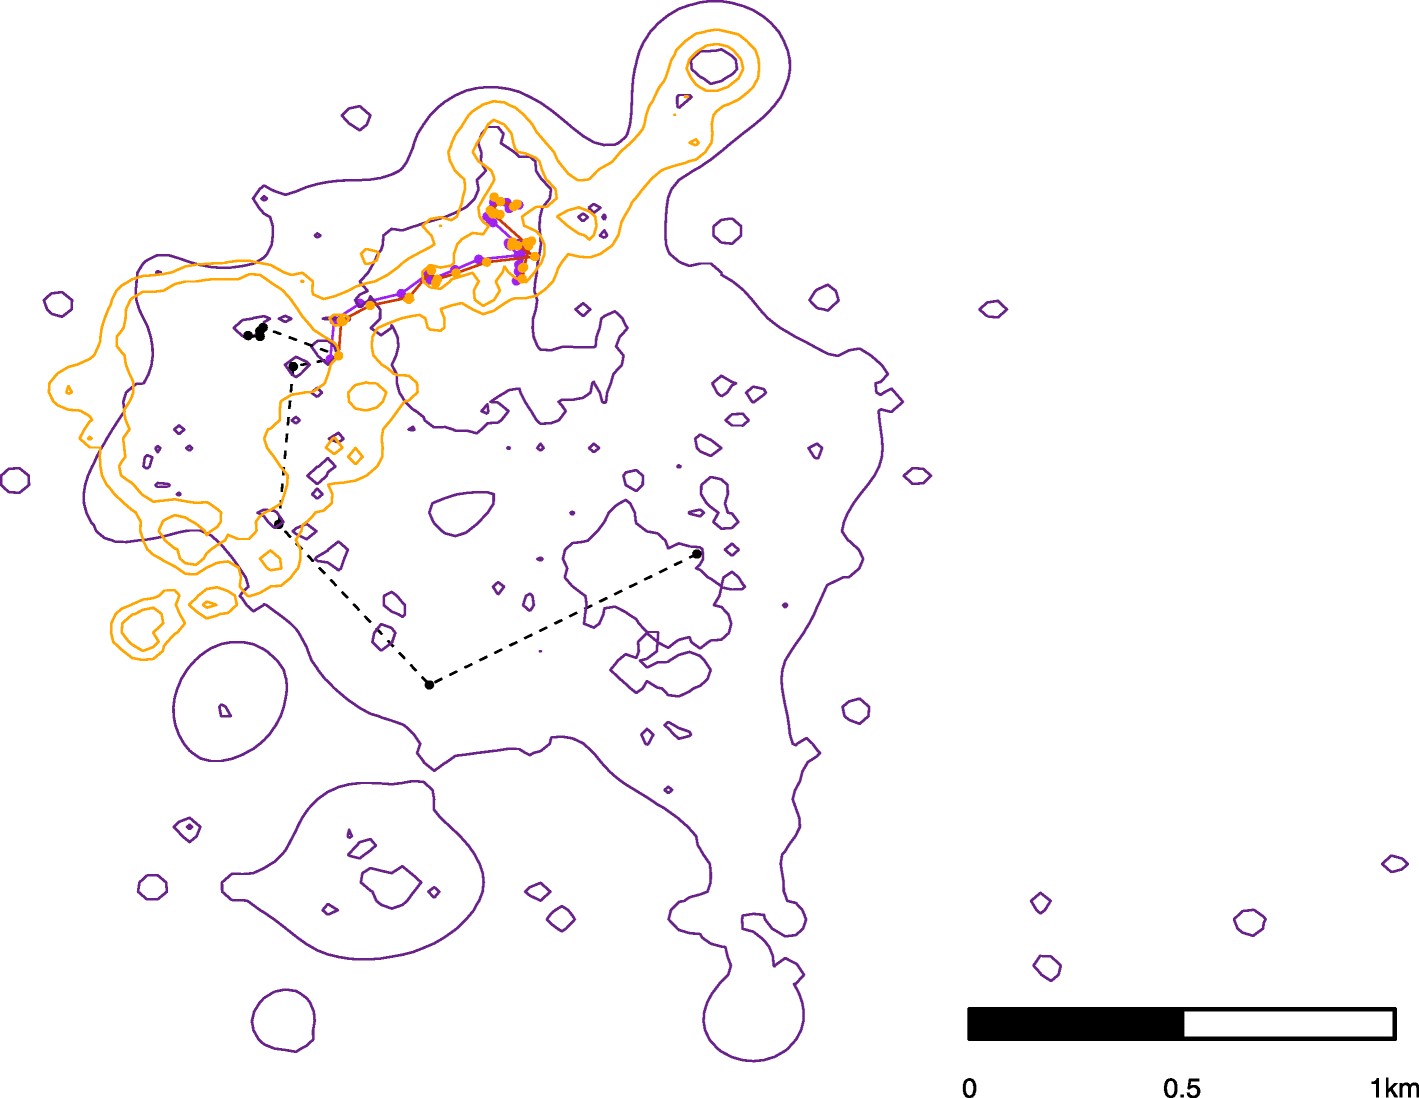
Below is an example of some data that were available and used from The Deer-Forest Study – the home ranges of a male (purple) and female (orange) deer. Think of these lines as contours on a topographic map – the higher the “elevation” the more likely you are to find the deer in that location. The orange and purple points are when these two deer were within 109 yards (100 m) of each other.
If you only had the locations of the male, would you see a difference in his movements when near the female compared to when they weren’t traveling together?
I am here to save you some eye and head pain. Conclusion – you can’t garner behavioral insights from statistically analyzing location data from one sex (or even both sexes) when there is no validation of data.
You’re thinking how is that helping, right?
Ok, let’s try this. Just because you’re in the kitchen doesn’t mean you’re eating. Male and female movements are highly variable during the breeding season. That means that just looking at points on a map isn’t enough information to understand when males and females interact.
Some research has looked at male movement patterns and assigned or identified behavior likely related to breeding but without verifying this and with no female movement data to inform it, the conclusions are speculative. The methods previously used to describe and explain male-female interactions during the breeding season did not match up with the locations where we had known interactions of male and female deer.
When camera technology can be incorporated into deer collars – we’ll be able to ascribe behavior to specific movements and locations on a map. Then we’ll really learn something about deer behavior! Although I’m not convinced.
-Jeannine Fleegle
Wildlife Biologist
Deer and Elk Section, Game Commission
A copy of the scientific paper behind this blog post is available here.