Misc
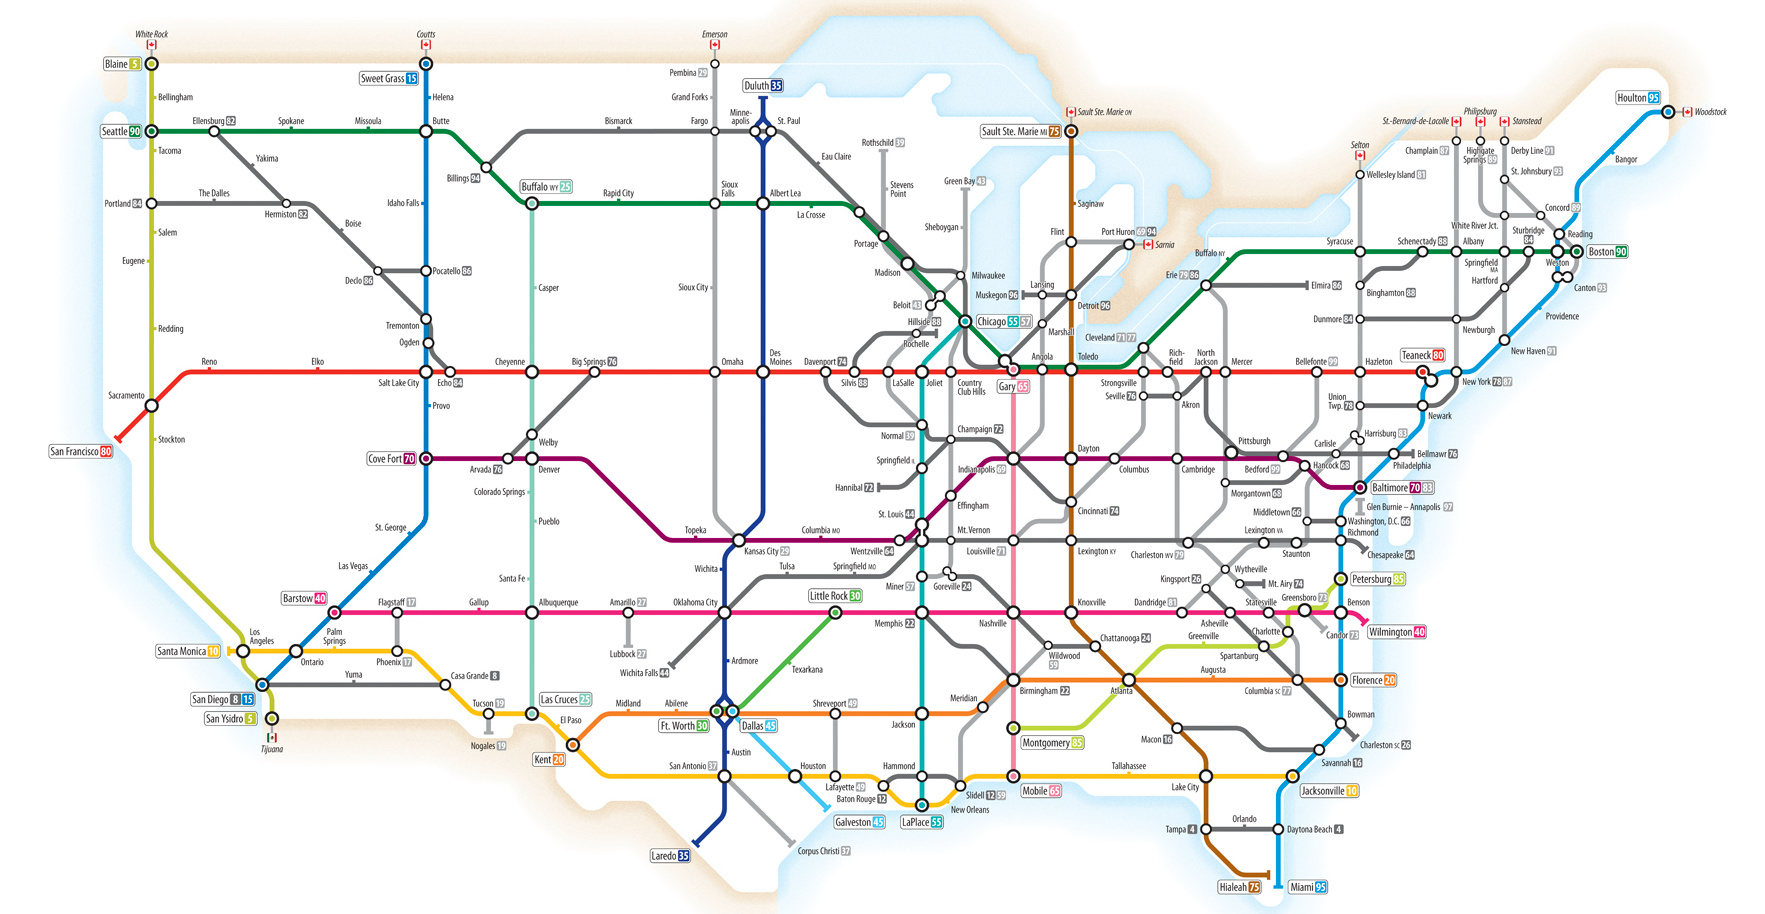
U.S. Interstate Highways, as a Transit Map
View the full-sized version of this infographic
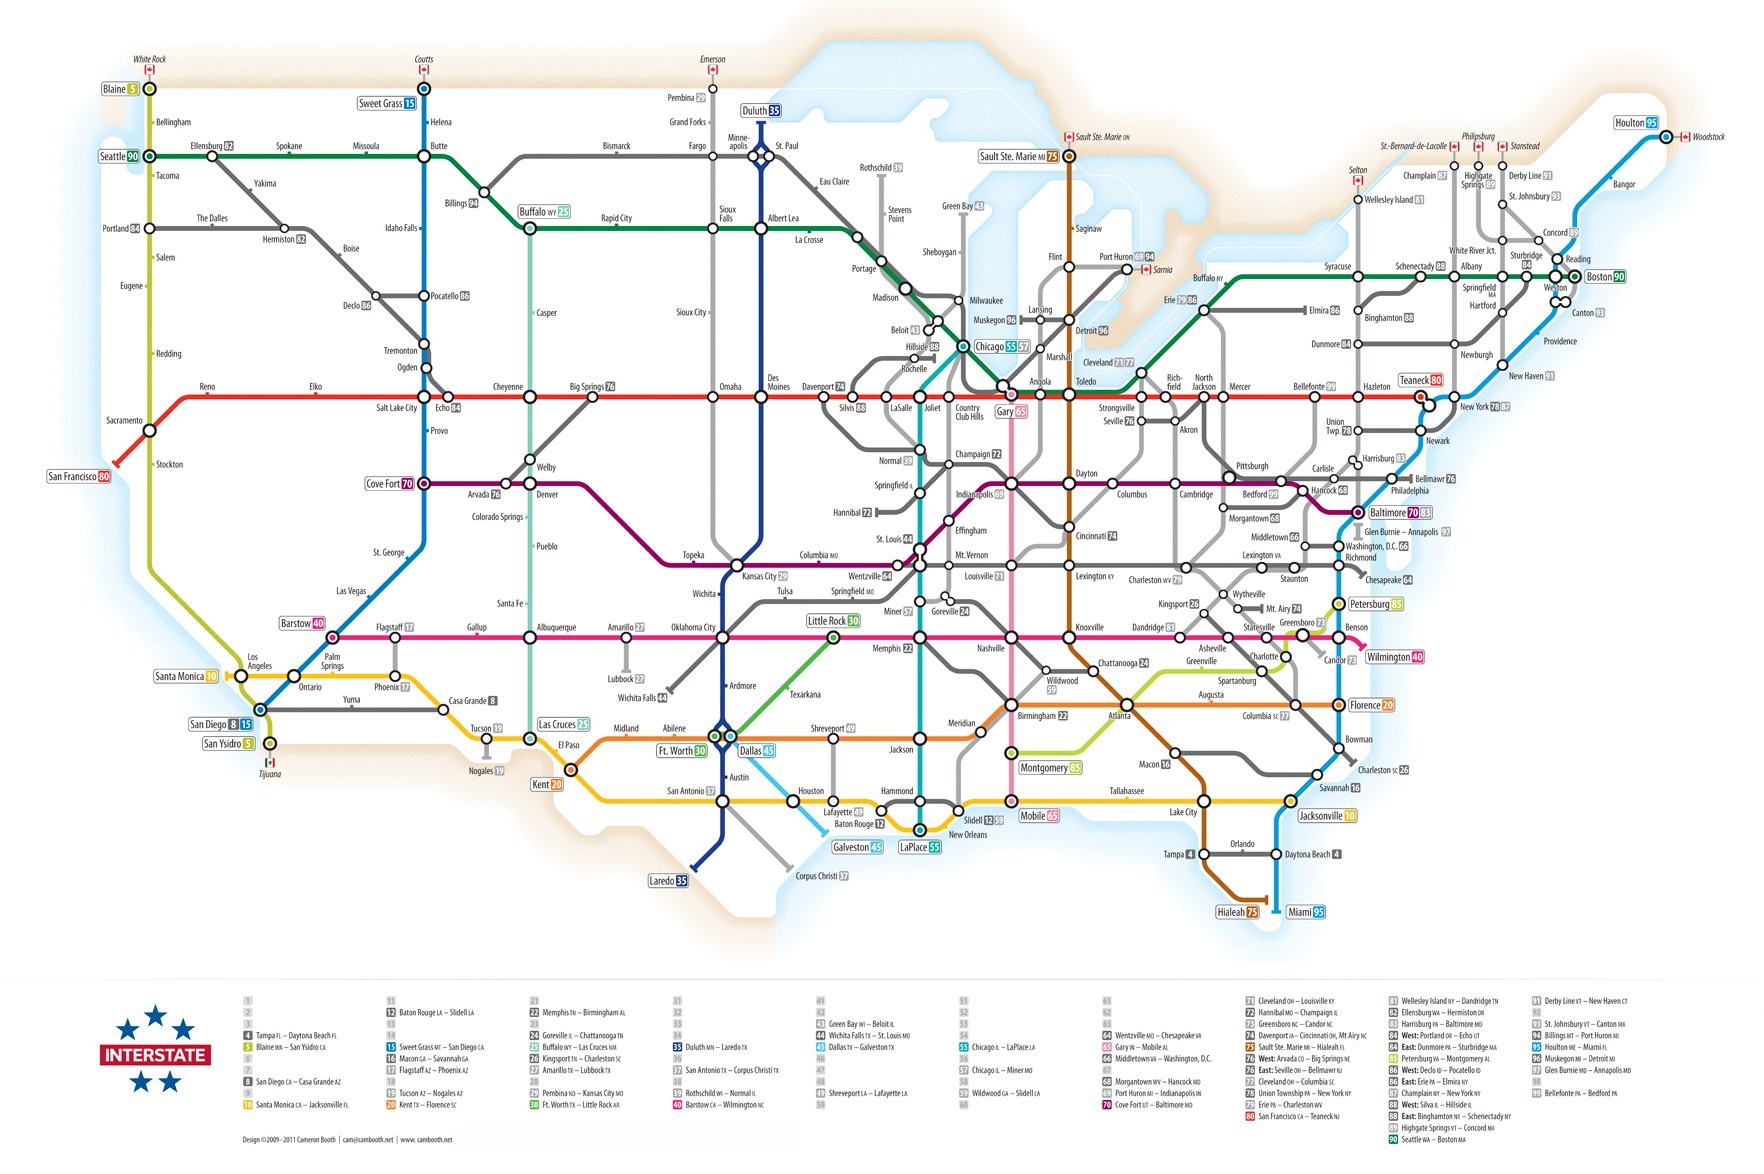
U.S. Interstate Highways, as a Transit Map
View the high-resolution infographic to see the most legible version.
Transit style maps are sort of a “rite of passage” for any upstart information designer.
People tend to be obsessed with them, and for good reason. What the maps lack in attention to fine details, they make up in their sheer ease of use, organization, and ability to reduce complex geography to simple, elegant shapes. They show the big picture in way that’s easy to follow, even for seemingly unrelated topics like the extensive road network of the Roman Empire.
Today’s infographic fits in with this theme, coming from designer Cameron Booth. Showcasing the network of Interstate Highways in the United States, it puts the transit map style to good use.
Note: The design shown is from about five years ago, but here’s an updated 2017 version in poster form.
The Interstate Highway System
You may know the network of roads simply as “the Interstate”, but it actually has a much longer and official sounding title: The Dwight D. Eisenhower National System of Interstate and Defense Highways. That’s because it was championed by President Eisenhower in the 1950s during his first term in office, after he saw the logistical effectiveness of the new Reichsautobahn in Germany.
Here are some facts about the Interstate Highway System that you may not know:
- Part of the justification of building the system was to have a means to evacuate citizens from major cities during nuclear attacks.
- The system was designed so that in an evacuation situation, traffic could be directed to move in all lanes in one direction.
- In today’s dollars, the cost of construction was approximately $526 billion.
- Activists got frustrated with the construction, and stopped highways in New York, Baltimore, Washington D.C., and New Orleans. As a result, some urban routes ended up as “roads to nowhere”.
- In a mile of highway, there are about 3 million tons of concrete. In comparison there are 6.6 million tons of concrete in the Hoover Dam.
- Roughly 374,000 vehicles travel on the I-405 in Los Angeles every day – no wonder it’s the city with the most traffic in the world.
Today, there are now approximately 47,856 miles (77,017 km) of highway in the system – about 6,000 miles (9,700 km) more than originally planned. Meanwhile, the Interstate Highway System accounts for one-quarter of all vehicle miles driven in the country.


Maps
The Largest Earthquakes in the New York Area (1970-2024)
The earthquake that shook buildings across New York in April 2024 was the third-largest quake in the Northeast U.S. over the past 50 years.


The Largest Earthquakes in the New York Area
This was originally posted on our Voronoi app. Download the app for free on Apple or Android and discover incredible data-driven charts from a variety of trusted sources.
The 4.8 magnitude earthquake that shook buildings across New York on Friday, April 5th, 2024 was the third-largest quake in the U.S. Northeast area over the past 50 years.
In this map, we illustrate earthquakes with a magnitude of 4.0 or greater recorded in the Northeastern U.S. since 1970, according to the United States Geological Survey (USGS).
Shallow Quakes and Older Buildings
The earthquake that struck the U.S. Northeast in April 2024 was felt by millions of people from Washington, D.C., to north of Boston. It even caused a full ground stop at Newark Airport.
The quake, occurring just 5 km beneath the Earth’s surface, was considered shallow, which is what contributed to more intense shaking at the surface.
According to the USGS, rocks in the eastern U.S. are significantly older, denser, and harder than those on the western side, compressed by time. This makes them more efficient conduits for seismic energy. Additionally, buildings in the Northeast tend to be older and may not adhere to the latest earthquake codes.
Despite disrupting work and school life, the earthquake was considered minor, according to the Michigan Technological University magnitude scale:
| Magnitude | Earthquake Effects | Estimated Number Each Year |
|---|---|---|
| 2.5 or less | Usually not felt, but can be recorded by seismograph. | Millions |
| 2.5 to 5.4 | Often felt, but only causes minor damage. | 500,000 |
| 5.5 to 6.0 | Slight damage to buildings and other structures. | 350 |
| 6.1 to 6.9 | May cause a lot of damage in very populated areas. | 100 |
| 7.0 to 7.9 | Major earthquake. Serious damage. | 10-15 |
| 8.0 or greater | Great earthquake. Can totally destroy communities near the epicenter. | One every year or two |
The largest earthquake felt in the area over the past 50 years was a 5.3 magnitude quake that occurred in Au Sable Forks, New York, in 2002. It damaged houses and cracked roads in a remote corner of the Adirondack Mountains, but caused no injuries.
| Date | Magnitude | Location | State |
|---|---|---|---|
| April 20, 2002 | 5.3 | Au Sable Forks | New York |
| October 7, 1983 | 5.1 | Newcomb | New York |
| April 5, 2024 | 4.8 | Whitehouse Station | New Jersey |
| October 16, 2012 | 4.7 | Hollis Center | Maine |
| January 16, 1994 | 4.6 | Sinking Spring | Pennsylvania |
| January 19, 1982 | 4.5 | Sanbornton | New Hampshire |
| September 25, 1998 | 4.5 | Adamsville | Pennsylvania |
| June 9, 1975 | 4.2 | Altona | New York |
| May 29, 1983 | 4.2 | Peru | Maine |
| April 23, 1984 | 4.2 | Conestoga | Pennsylvania |
| January 16, 1994 | 4.2 | Sinking Spring | Pennsylvania |
| November 3, 1975 | 4 | Long Lake | New York |
| June 17, 1991 | 4 | Worcester | New York |
The largest earthquake in U.S. history, however, was the 1964 Good Friday quake in Alaska, measuring 9.2 magnitude and killing 131 people.

-

 Technology2 weeks ago
Ranked: The Most Popular Smartphone Brands in the U.S.
-

 Automotive1 week ago
Almost Every EV Stock is Down After Q1 2024
-

 Money1 week ago
Where Does One U.S. Tax Dollar Go?
-

 Green2 weeks ago
Ranked: Top Countries by Total Forest Loss Since 2001
-

 Real Estate2 weeks ago
Visualizing America’s Shortage of Affordable Homes
-

 Maps2 weeks ago
Mapped: Average Wages Across Europe
-

 Mining2 weeks ago
Charted: The Value Gap Between the Gold Price and Gold Miners
-

 Demographics2 weeks ago
Visualizing the Size of the Global Senior Population