Net income among physicians varies widely. Figures in this article are based on data from the Canadian Institute for Health Information (October 2021), and represent average gross clinical income before overhead, taxes and other expenses.
Are you a medical student thinking about choosing your specialty? Maybe you’re in residency wondering where to practise. Or maybe you’re just curious about the average income of a physician in Canada.
Take me to the income tables
This article will list average physician earnings for family medicine and 17 medical and surgical specialties in 10 provinces. But first, let’s define some terms.
How are physicians paid?
In Canada, physicians can be paid in the following ways:
- Fee for service: The physician bills their provincial ministry of health a specified amount for each type of visit or procedure.
- Alternative payment plans: Under these arrangements, the province pays physicians directly using a model other than fee for service, such as salary, sessional (payment on an hourly or daily basis), capitation (payment based on the number of patients on a doctor’s roster), or block funding (in which practice groups are paid for services beyond the clinical, like teaching, research or administration).
In the tables below, we show the “gross clinical payment per full-time equivalent.”
Gross clinical payment: This is the amount that the government pays the physician, whether it is fee for service or an alternative payment plan. From this amount, the self-employed physician will need to pay their overhead expenses (e.g., rent, staff salaries, equipment, insurance) and other deductions. The remaining is the physician’s net clinical revenue, from which they will pay personal taxes and/or corporate taxes if their medical practice is incorporated.
Here is a simplified illustration, using an unincorporated physician:
| Gross clinical payment |
400 000 $ |
| Overhead |
-$150,000 |
| Net clinical revenue |
$250,000 |
| Personal income tax |
-$100,000 |
| Take-home pay |
$150,000 |
Full-time equivalent: Not all physicians work full-time, and part-time earnings can distort the calculation of average income. The “full-time equivalent” metric aims to produce statistics that are comparable between full-time and part-time, across jurisdictions and across specialties.

Tables of physician income in Canada
The figures in the following tables are from the Canadian Institute for Health Information, published in October 2021 based on 2019–2020 data.1
CIHI provides information for family medicine and a select number of medical and surgical specialties.
Note that because of the varying payment methods across Canada, there are limitations to the comparability of this physician payment information. Anesthesia data, in fact, is excluded from service counts because of concerns about the comparability of certain jurisdictions.
An asterisk (*) indicates that data were suppressed to protect confidentiality where there are four or fewer physicians; n/a indicates not applicable and/or there were no physicians for this specialty in the particular province. In general, there were not enough data for Yukon, Northwest Territories or Nunavut.
Average physician gross annual income
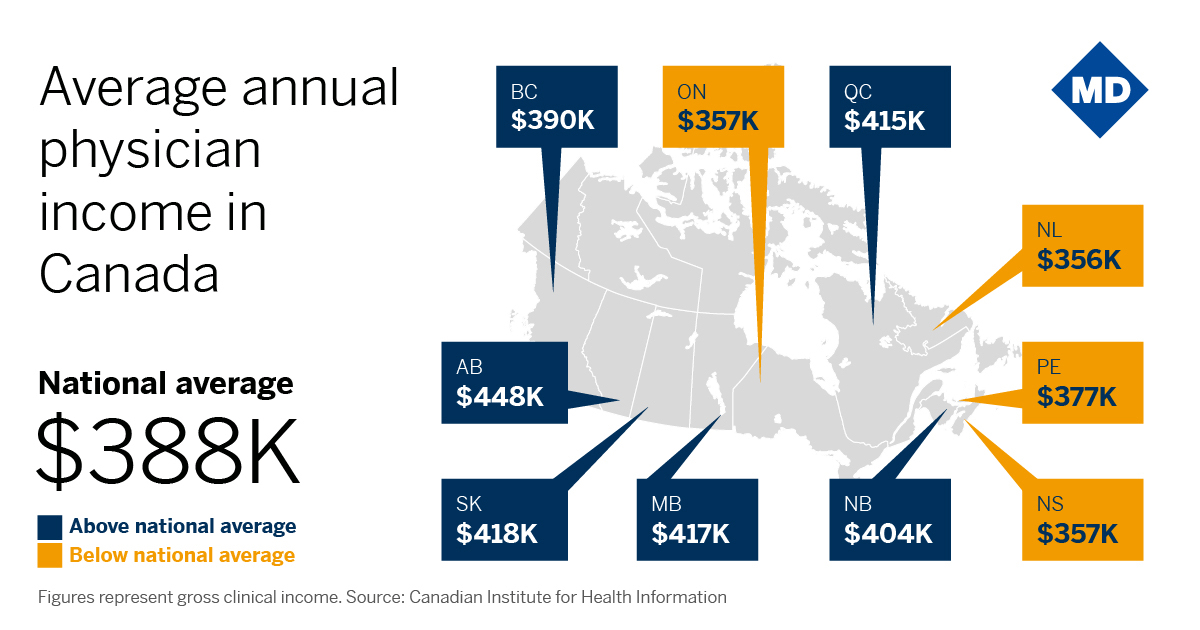
By province
| Province |
Annual income |
| Alberta |
$448,098 |
| Saskatchewan |
$418,060 |
| Manitoba |
$417,413 |
| Quebec |
$415,071 |
| New Brunswick |
$403,677 |
| British Columbia |
$389,716 |
| Prince Edward Island |
$377,211 |
| Nova Scotia |
$357,318 |
| Ontario |
$356,508 |
| Newfoundland and Labrador |
$355,523 |
| Average |
$387,756 |

By specialty
| Specialty |
Annual income |
| Ophthalmology |
$879,858 |
| Thoracic/cardiovascular surgery |
$670,652 |
| Neurosurgery |
$602,130 |
| Surgical specialists |
$573,586 |
| Urology |
$572,164 |
| General surgery |
$539,707 |
| Cardiology |
$531,746 |
| Otolaryngology |
$523,053 |
| Plastic surgery |
$514,086 |
| Orthopedic surgery |
$507,807 |
| Gastroenterology |
$493,060 |
| Obstetrics/gynecology |
$472,548 |
| Internal medicine |
$464,759 |
| Dermatology |
$457,191 |
| Medical specialists |
$404,328 |
| Pediatrics |
$361,623 |
| Neurology |
$356,913 |
| Physical medicine |
$341,008 |
| Family medicine |
$331,615 |
| Psychiatry |
$318,984 |
Gross annual income by province
Cardiology
| Province |
Annual income |
| Alberta |
$643,215 |
| British Columbia |
$599,541 |
| Saskatchewan |
$576,559 |
| Manitoba |
$548,207 |
| Quebec |
$514,500 |
| Ontario |
$508,233 |
| New Brunswick |
$485,973 |
| Newfoundland and Labrador |
$478,812 |
| Nova Scotia |
$357,312 |
| Prince Edward Island |
n/a |
| Average |
$531,746 |
Dermatology
| Province |
Annual income |
| Alberta |
$666,555 |
| Manitoba |
$636,129 |
| New Brunswick |
$581,224 |
| Nova Scotia |
$580,236 |
| Newfoundland and Labrador |
$515,679 |
| British Columbia |
$505,756 |
| Saskatchewan |
$463,633 |
| Quebec |
$448,877 |
| Ontario |
$361,097 |
| Prince Edward Island |
* |
| Average |
$457,191 |
Family medicine
| Province |
Annual income |
| Alberta |
$393,248 |
| Quebec |
$369,185 |
| Manitoba |
$364,825 |
| New Brunswick |
$341,161 |
| Saskatchewan |
$322,026 |
| Prince Edward Island |
$317,968 |
| Nova Scotia |
$312,420 |
| British Columbia |
$308,399 |
| Ontario |
$303,656 |
| Newfoundland and Labrador |
$290,388 |
| Average |
$331,615 |
Gastroenterology
| Province |
Annual income |
| Saskatchewan |
$544,297 |
| British Columbia |
$542,929 |
| Alberta |
$537,539 |
| Manitoba |
$521,276 |
| New Brunswick |
$500,828 |
| Quebec |
$486,144 |
| Ontario |
$478,715 |
| Newfoundland and Labrador |
$435,780 |
| Nova Scotia |
$350,724 |
| Prince Edward Island |
n/a |
| Average |
$493,060 |
General surgery
| Province |
Annual income |
| Alberta |
$637,393 |
| Manitoba |
$628,103 |
| Quebec |
$611,821 |
| Saskatchewan |
$587,697 |
| New Brunswick |
$556,302 |
| Prince Edward Island |
$552,027 |
| British Columbia |
$537,065 |
| Nova Scotia |
$511,467 |
| Ontario |
$481,451 |
| Newfoundland and Labrador |
$468,256 |
| Average |
$539,707 |
Internal medicine
| Province |
Annual income |
| Alberta |
$546,288 |
| British Columbia |
$507,457 |
| Saskatchewan |
$488,589 |
| Manitoba |
$482,233 |
| Quebec |
$470,028 |
| Prince Edward Island |
$447,909 |
| Ontario |
$441,783 |
| New Brunswick |
$438,960 |
| Newfoundland and Labrador |
$422,537 |
| Nova Scotia |
$365,418 |
| Average |
$464,759 |
The figures for internal medicine include all subspecialties of internal medicine, including cardiology and gastroenterology which are also reported as individual specialties.
Neurology
| Province |
Annual income |
| British Columbia |
$456,129 |
| Alberta |
$412,966 |
| Newfoundland and Labrador |
$379,965 |
| Manitoba |
$363,673 |
| Prince Edward Island |
$359,155 |
| Saskatchewan |
$358,399 |
| Ontario |
$342,627 |
| Quebec |
$334,388 |
| New Brunswick |
$311,167 |
| Nova Scotia |
$288,633 |
| Average |
$356,913 |
Neurosurgery
| Province |
Annual income |
| Saskatchewan |
$700,258 |
| Ontario |
$697,647 |
| British Columbia |
$652,253 |
| Newfoundland and Labrador |
$586,906 |
| Manitoba |
$533,423 |
| Quebec |
$529,882 |
| New Brunswick |
$443,023 |
| Nova Scotia |
$347,957 |
| Alberta |
n/a |
| Prince Edward Island |
n/a |
| Average |
$602,130 |
Obstetrics/gynecology
| Province |
Annual income |
| British Columbia |
$568,742 |
| Alberta |
$540,451 |
| Saskatchewan |
$539,522 |
| New Brunswick |
$538,434 |
| Prince Edward Island |
$520,185 |
| Manitoba |
$509,233 |
| Quebec |
$463,067 |
| Nova Scotia |
$450,795 |
| Ontario |
$436,002 |
| Newfoundland and Labrador |
$379,067 |
| Average |
$472,548 |
Ophthalmology
| Province |
Annual income |
| Alberta |
$1,302,765 |
| Manitoba |
$1,162,421 |
| Prince Edward Island |
$1,103,068 |
| Saskatchewan |
$1,069,210 |
| Newfoundland and Labrador |
$969,021 |
| British Columbia |
$962,062 |
| Nova Scotia |
$907,615 |
| Quebec |
$806,676 |
| New Brunswick |
$805,655 |
| Ontario |
$747,346 |
| Average |
$879,858 |
Orthopedic surgery
| Province |
Annual income |
| Newfoundland and Labrador |
$604,053 |
| Alberta |
$595,058 |
| Saskatchewan |
$570,139 |
| Manitoba |
$567,600 |
| Prince Edward Island |
$526,246 |
| British Columbia |
$518,090 |
| Quebec |
$514,266 |
| Ontario |
$473,882 |
| Nova Scotia |
$464,793 |
| New Brunswick |
$461,365 |
| Average |
$507,807 |
Otolaryngology
| Province |
Annual income |
| Alberta |
$683,991 |
| Saskatchewan |
$561,689 |
| Manitoba |
$551,799 |
| New Brunswick |
$537,585 |
| Nova Scotia |
$533,296 |
| Ontario |
$518,968 |
| British Columbia |
$512,028 |
| Newfoundland and Labrador |
$490,704 |
| Quebec |
$469,263 |
| Prince Edward Island |
* |
| Average |
$523,053 |
Pediatrics
| Province |
Annual income |
| British Columbia |
$420,660 |
| Alberta |
$418,964 |
| New Brunswick |
$412,370 |
| Saskatchewan |
$392,600 |
| Quebec |
$389,287 |
| Newfoundland and Labrador |
$378,609 |
| Nova Scotia |
$354,401 |
| Manitoba |
$342,411 |
| Prince Edward Island |
$337,984 |
| Ontario |
$327,477 |
| Average |
$361,623 |
Physical medicine
| Province |
Annual income |
| Saskatchewan |
$416,393 |
| Manitoba |
$413,298 |
| British Columbia |
$394,457 |
| Alberta |
$373,556 |
| New Brunswick |
$348,825 |
| Quebec |
$326,258 |
| Ontario |
$319,091 |
| Nova Scotia |
$234,609 |
| Newfoundland and Labrador |
* |
| Prince Edward Island |
* |
| Average |
$341,008 |
Plastic surgery
| Province |
Annual income |
| Alberta |
$678,847 |
| Manitoba |
$668,551 |
| New Brunswick |
$626,131 |
| Saskatchewan |
$592,275 |
| Quebec |
$541,786 |
| Nova Scotia |
$529,928 |
| British Columbia |
$523,778 |
| Newfoundland and Labrador |
$499,776 |
| Ontario |
$442,706 |
| Prince Edward Island |
* |
| Average |
$514,086 |
Psychiatry
| Province |
Annual income |
| New Brunswick |
$380,303 |
| Prince Edward Island |
$368,343 |
| Saskatchewan |
$360,632 |
| Quebec |
$359,352 |
| Manitoba |
$345,302 |
| Alberta |
$335,040 |
| British Columbia |
$316,395 |
| Nova Scotia |
$293,706 |
| Newfoundland and Labrador |
$282,642 |
| Ontario |
$281,312 |
| Average |
$318,984 |
Thoracic/cardiovascular surgery
| Province |
Annual income |
| Alberta |
$889,030 |
| Saskatchewan |
$762,962 |
| Manitoba |
$754,625 |
| Ontario |
$710,681 |
| British Columbia |
$634,493 |
| Quebec |
$626,372 |
| Newfoundland and Labrador |
$583,493 |
| Nova Scotia |
$545,757 |
| New Brunswick |
$540,196 |
| Prince Edward Island |
n/a |
| Average |
$670,652 |
Urology
| Province |
Annual income |
| Manitoba |
$730,839 |
| Alberta |
$701,111 |
| New Brunswick |
$670,287 |
| Saskatchewan |
$644,047 |
| British Columbia |
$615,056 |
| Nova Scotia |
$606,020 |
| Newfoundland and Labrador |
$585,763 |
| Ontario |
$537,580 |
| Quebec |
$527,298 |
| Prince Edward Island |
* |
| Average |
$572,164 |
1 To find this information, go to https://www.cihi.ca/en/physicians-in-canada. Scroll down to “National Physician Database” and download “Data tables (ZIP).” Go to the file titled “NPDB-historical-payments-data-tables-1999-2019-en-web.xlsx,” and see Table D2 (“Average payments”). Click row 3 (“Type of average payment”) and select “Average gross clinical payment per full-time-equivalent physician” from the drop-down menu.
The above information should not be construed as offering specific financial, investment, foreign or domestic taxation, legal, accounting or similar professional advice, nor is it intended to replace the advice of independent tax, accounting or legal professionals.


