
Dow Jones Industrial Average (DJIA) Live Index Chart

Wall Street
Bullish
 1d
1d
Last updated:
May 3, 2024
| Low | |
| High |
of clients are net long.
of clients are net short.
Average True Range
Total Intraday Range (% of ATR)
Note: Low and High figures are for the trading day.
The Dow Jones Industrial Average (DJIA), Dow Jones or the Dow for short tracks the performance of 30 of the biggest companies in the US including Boeing, Intel, and Dow. It's often used as a barometer for the overall performance of the country's equity markets. Historically it's one of oldest and most followed indices. The chart is a useful measure of US economic health. Follow the Dow Jones live with the real-time chart and view the latest Dow forecasts, news and analysis. Key pivot points and support and resistance will help you trade the Dow Jones today and into the future.
Advertisement
News & Analysis

FTSE 100 on Track for yet Another Record High while Dow and S&P 500 Recover
2024-05-03 10:00:37

FTSE 100 Bucks the Trend and Remains Bid amid Jittery Dow and S&P 500 ahead of FOMC
2024-05-01 12:00:00

Dow and Nasdaq 100 rise but Nikkei 225 hits a speed bump
2024-04-30 12:00:41
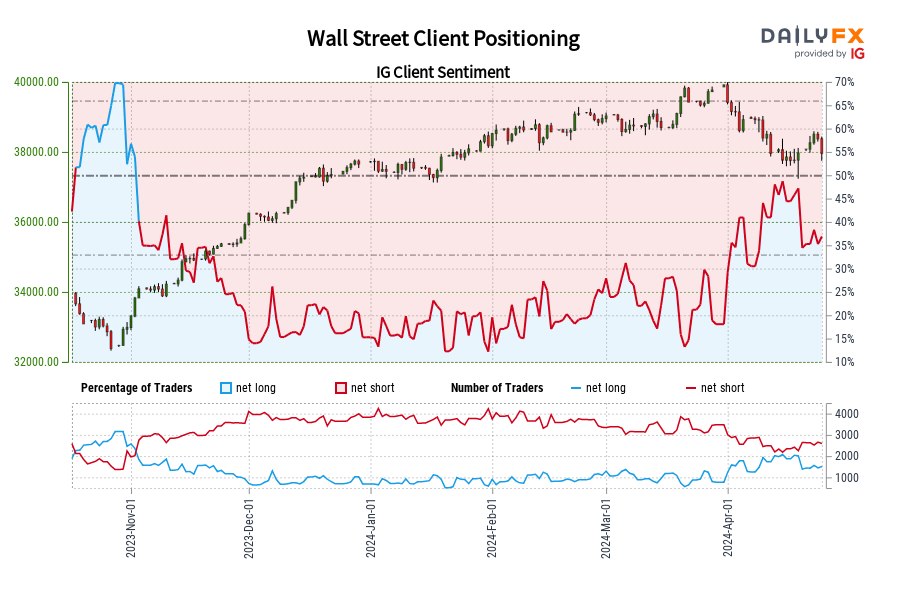
Wall Street IG Client Sentiment: Our data shows traders are now net-long Wall Street for the first time since Nov 02, 2023 when Wall Street traded near 33,825.70.
2024-04-25 16:23:37
Rallies in FTSE 100, DAX 40 and Dow Have Further to Go
2024-04-24 10:00:03
Dow, Nasdaq 100 and Nikkei 225 Make Headway Off Recent Lows
2024-04-23 10:00:30
Dow retreat slows and S&P 500 holds above 5000, while Hang Seng rallies sharply
2024-04-18 10:04:10
Real Time News

May 3, 2024
Follow
Indices Update: As of 20:00, these are your best and worst performers based on the London trading schedule:
US 500: 1.24%
Wall Street: 1.16%
FTSE 100: 0.26%
France 40: 0.23%
Germany 40: 0.17%
View the performance of all markets via https://t.co/2NUaqnUPED https://t.co/D6xxbhDfUO

May 3, 2024
Follow
Indices Update: As of 18:00, these are your best and worst performers based on the London trading schedule:
US 500: 1.26%
Wall Street: 1.22%
FTSE 100: 0.27%
France 40: 0.19%
Germany 40: 0.16%
View the performance of all markets via https://t.co/2NUaqnUPED https://t.co/rlVawy5T32

May 3, 2024
Follow
Indices Update: As of 16:00, these are your best and worst performers based on the London trading schedule:
US 500: 1.09%
Wall Street: 1.09%
FTSE 100: 0.16%
France 40: 0.15%
Germany 40: 0.13%
View the performance of all markets via https://t.co/2NUaqnUPED https://t.co/l3ZfIhv9yq


IG Client Sentiment
Wall Street
Bullish
Daily change in
Longs
-12%
Shorts
11%
OI
3%
Weekly change in
Longs
-20%
Shorts
19%
OI
4%
Advertisement
8 Women in Finance Leading the Way

Why a Rise in Retail Trading May Signal Another Mania

How to Trade FX for Stock Traders

How Will the Election Affect the Stock Market? Dow Jones Forecast

The Dow Jones: What is it & Why is it Relevant to Traders?
Day Trading the Dow Jones: Strategies, Tips & Trading Signals
Advertisement