

LOADING...
 |
| April 11, 2007. New Albany, IN. Duke Marsh |
Forecasts issued by the National Weather Service routinely include a "probability of precipitation" statement (sometimes abbreviated as "POP" or "POPS" in our forecast discussions). For example:
.TUESDAY...MOSTLY CLOUDY WITH A 30 PERCENT CHANCE OF SHOWERS AND THUNDERSTORMS. HIGHS IN THE UPPER 60S.
What does this "30 percent" mean?
Probability of precipitation describes:
- The chance of precipitation...
- ...at a particular point
- ...over a certain period of time.
So, in the example above, there is a 30% chance that at least 0.01" of rain will fall at the point for which that forecast is valid over the period of time given ("Tuesday" in this case). The time periods given in our forecasts are typically 12-hours long. The "Tuesday" period, for instance, is from 7am EST to 7pm EST (8am to 8pm EDT) on Tuesday. "Tuesday night" would run from 7pm EST (8pm EDT) Tuesday evening to 7am EST (8am EDT) Wednesday morning.
On our web site's homepage, there is a clickable forecast map. When you click on the map, a personal forecast is generated for the spot on which you clicked. The probability of precipitation that is given in the forecast is valid only for that spot (technically a 5 kilometer square grid around that spot). Click on a different location on the forecast map, and you will probably get a slightly different forecast.
Let's look at a graphical example of probability of precipitation.
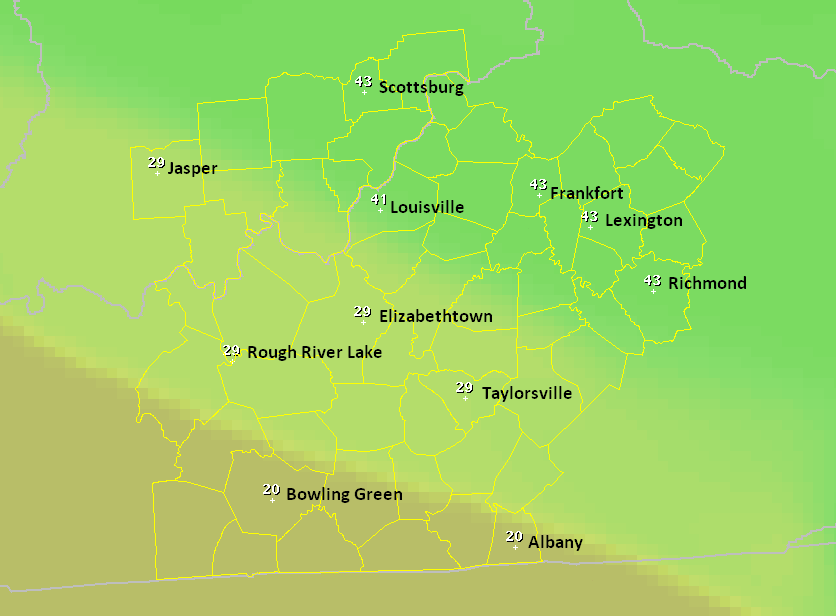 |
This map shows the area that is under the responsibility of the Louisville National Weather Service office. The forecaster has drawn probabilities of precipitation across the region. It is in this way that each click on our clickable forecast map can give a unique forecast to that location. Looking at a point on this graphic will tell us the probability of precipitation at that point. So, for example, there is a 20% chance of precipitation at Bowling Green, a 41% chance of precipitation at Louisville, and a 43% chance of precipitation at Lexington over the 12-hour period that this graphic covers. These graphics are also available on our web site. |
|
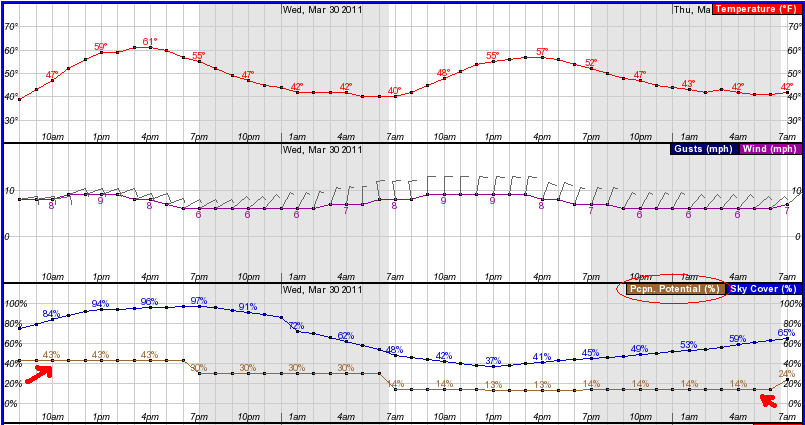
To look at it another way, you can also view precipitation probabilities on a graph. To do this, click on the clickable forecast map, as described above. On the forecast page that appears, scroll down to the bottom, and in the table in the lower right corner of the page click on Hourly Weather Graph. You will then see your forecast displayed on a graph, like the example shown below. |
 |
 Weather Story
 Weather Map
 Local Radar
 Follow us on YouTube