
Karstic Aquifers—Simple or Hybrid Systems? Thermal Stories from Maaras Cave, Greece

1
Department of Geography, University of Bergen, 5020 Bergen, Norway
2
Emil Racoviţă Institute of Speleology, Romanian Academy, 400006 Cluj-Napoca, Romania
3
Stable Isotope Laboratory, Ştefan cel Mare University, 720229 Suceava, Romania
4
Department of Geography, Aegean University, 81100 Mytilene, Greece
*
Author to whom correspondence should be addressed.
Water 2023, 15(3), 488; https://doi.org/10.3390/w15030488
Submission received: 16 December 2022
/
Revised: 17 January 2023
/
Accepted: 18 January 2023
/
Published: 26 January 2023
(This article belongs to the Special Issue Cave Waters: Modern Perspectives for Short to Long-Term Environmental Monitoring)
Abstract
:Karst systems, such as caves, provide a unique opportunity to study the groundwater from the inside in contrast to spring studies, where hydrographs, chemographs, and thermographs show an integrated signal from the entire catchment and aquifer. Studies from karst springs show that recharge and conduit characteristics significantly influence how the temperature signal is transmitted and thus could inform on the structure of underground flow paths. Here, we present monitoring temperature data from a two-year-long study of a 10 km long river cave, Maaras, in northern Greece. Our data from five measuring stations along the cave stream show how different flow paths transform the temperature signal. The catchment area consists of a polje impacting the recharge conditions that change seasonally from diffuse to concentrated. Diffuse recharge stabilizes the temperature regardless of the conduit conditions. However, temperature fluctuations occur on four different time scales: seasonal, event-based, diurnal, and hourly, indicating different passage conditions. Interaction between the cave stream and the in-cave porous aquifer in the clastic sediments strongly impacts the alteration of the thermal signal through the cave: temperature fluctuations are damped, and the temperature is raised.
1. Introduction
In soluble rocks such as marble, limestone, and gypsum, groundwater circulation forms cavities by dissolving joints and bedding planes, resulting in high tertiary porosity. This setting forms karst aquifers where groundwater flows through dissolved conduits with large hydraulic diameters and low restrictions to flow, which translates into fast flow and low residence time in the system. Globally, such karst waters are an essential component of the groundwater (e.g., [1,2]). Although in great abundance, karst aquifers are not fully deciphered, which is mainly due to the high heterogeneity and complex flow dynamics since they integrate both quick flow through conduits and slow flow through matrix and fracture networks (e.g., [3,4]). Karstic aquifers are considered multi-permeability systems with a complex coupling between different flow systems [5]. Several different approaches have been applied to decode the way these systems function involving hydrograph analysis (e.g., [6,7,8]), tracer tests ([9,10] and references within), as well as speleological studies (e.g., [11,12], modelling work (e.g., [13]), and more recently, multiproxy approaches (e.g., [14]). Except for the hydrograph analysis, the rest of the methods are either expensive or time-consuming to apply. Temperature is the easiest and least expensive water property to monitor in streams, springs, and groundwater wells (e.g., [15,16,17]). In karst groundwater and spring studies, the thermal signal is applied as a natural tracer to quantify residence time and flow velocities [18,19], determine flow path and aquifer geometry [20,21,22,23], and gain insight into the interaction between diffuse and concentrated flow [24]. In this context, Luhmann et al. [17] proposes a different cost-effective approach to deciphering the flow dynamics of karst systems using thermographs. Their approach enables them to propose four patterns characterizing the studied systems related to recharge duration and conduit geometry.
The thermal signal in a karst aquifer carries information about the internal aquifer structure [25]. Recharge conditions, conduit geometry, aquifer depth, and conduit–matrix exchange flow have all been suggested to influence the temperature signal at karst springs ([25] and references there). Modelling studies have provided a better understanding of the mechanisms of heat transport and heat exchange in karst (e.g., [25,26]), the relative importance of convection, conduction, and radiation depends on the characteristics of the flow path. Covington et al. [25] demonstrated that under full-pipe conditions and turbulent flow, conduction through the rock surrounding the conduit dominates the heat exchange, although convection between the water and the conduit walls also plays a role, while in open channels, radiative heat exchange is more important. Furthermore, the function of various heat exchange mechanisms seems to be sensitive to the timescale of temperature variations and depends strongly upon hydraulic diameter, which changes along the flow path and with discharge in open channels [25]. However, the models often neglect the presence of sediments in the conduit and, thus, the water and heat exchange between the cave stream and the streambed, i.e., in the hyporheic zone. Heat is transported through a porous streambed by advection and conduction [27], and how deep the temperature fluctuations propagate depends on the timescale, amplitude, and direction of the vertical flow components [28,29].
Karst caves provide a unique opportunity to understand karst aquifers from the inside in contrast to spring studies, where a mixed signal from the entire catchment and aquifer is recorded. Here, we show how different conduit conditions, i.e., sediment fill, and phreatic or vadose conditions, not only size and geometry, may produce different thermal patterns in through-flow water and how the thermal signal is transformed through the large cave conduits. We build upon the approach of Luhmann et al. [17] by employing an extensive network of thermographs along a fluvially active cave in Northern Greece, Maaras cave. We use a total of five data loggers that monitor the fluctuations of the thermal signal along the Maaras river cave. We combine a two-year-long water temperature record with meteorological data from the broader area and the hydrograph from the cave exit/spring of the Aggitis river. The length of Maaras makes the cave an ideal setting to explore the temperature oscillations along the river flow avoiding mixing areas of stream conjunction. Thermal monitoring of the cave waters coupled with extensive speleological investigation of the cave enables us to understand how different conduit settings transform the thermal signal and the implications on the flow dynamics along the system.
2. Setting
2.1. Maaras Cave
The Maaras cave/Aggitis river spring is located in the north part of the Drama Basin in Northern Greece, close to the town of Prosotsani and approximately 160 km from the city of Thessaloniki (Figure 1). The Drama basin is a multi-rift system characterized by two dominant structures, one E-W and one NNW-SSE [30,31]. The Aggitis river spring constitutes the discharge point of an extensive cave system, the Maaras cave. Maaras cave is essentially an underground river developed in pre-Neogene marble [32] that extends for 10,441 m [33]. The cave consists of one main passage with two tributaries. One tributary from the west meets the main passage at 3.6 km from the entrance (Figure 2; cyan halo). This branch (Menikio branch) is under phreatic conditions and has not been explored by divers for more than 1150 m [pers. comm.]. The other tributary lies 6.5 km far from the entrance (see Figure 2e) and flows from the north. This branch (right branch) is more than 2 km long, but one needs to dive a siphon after the first 300 m (Figure 2; magenta halo). The altitudinal difference between the highest point on the cave riverbed and the spring is 71 m (Figure 2). The cave roof follows a looping pattern, and the height varies from a few centimetres up to 60 m [33]. These narrow passages form siphons that separate the cave into seven air-filled parts. The slope varies between 3 and 67% along the riverbed, whilst the highest values occur at the beginning of the cave close to the spring [33]. The cave exhibits an abundance of sediments, such as extensive clastic deposits ranging from silt to boulders comprising breakdown debris cones [34], speleothems hanging from the roof, or formed on top of the clastic deposits and the cave walls. Lønøy et al. [34] investigate the thickness of the clastic sediments on the riverbed and estimate that, in places, their thickness exceeds 45 m suggesting that the sediments occupy 64 to 95% of the volume of the karstic conduit.
2.2. Karstic System Nevrokopi—Maaras
Maaras cave comprises the terminal part of the karstic system that connects the Nevrokopi polje with the Aggitis river spring (Figure 1). The system receives allogenic recharge through ponors (shafts) located at the south margin of the polje. The flow capacity of these shafts is most probably not high enough to adapt to high rainfall events in the catchment area of the polje; hence flooding is common, and an ephemeral lake occurs during snowmelt and high-intensity rain events. The catchment area of the polje is 477 km2 and ranges from 530 to 2224 m a.s.l. The linear distance between the ponor and the spring is approximately 10 km, while the altitudinal difference between them is 360 m (Figure 1i). Novel, Dimadi [36] suggest that the Nevrokopi—Maaras system has high dynamic storage responsible for the large memory effect evident on the hydrographs that reaches up to 50 days and that the impulse response of the system is very complex and not typical of a karstic aquifer. Petalas and Moutsopoulos [37] applied statistical analysis of hydrogeological spring data and concluded that the system is mainly recharged by diffuse infiltration.
2.3. Materials and Methods
Gemini Tinytag data loggers, in combination with an Arduino-based DIY data logger, were installed inside the cave. Two Tinytag Plus 2 TGP-4017 were installed; one at the cave entrance to record the variations in the external air temperature and one inside the cave (Figure 2; S4). Four (Figure 2; S1, S2, M1 and S4) Tinytag Plus 2 TGP-4020 were installed along the riverbed and were connected with the Tinytag Thermistor Probe—PB-5001-1M5 in order to record the water temperature. In addition, an Arduino-based logger (Figure 2; S3) was developed in house in order to record water and air temperature in combination with water level and atmospheric pressure [38]. Each logger was set to log at a one-hour interval. Gemini data loggers recorded temperature with 0.01 °C resolution over the range −40 °C to +85 °C and an accuracy of 0.35 °C in the recorded interval. The Arduino logger was equipped with two Dallas DS18B20 thermistors (one being submergible and fully waterproof) that measure temperatures from −55 °C to +125 °C with ±0.5 °C accuracy from −10 °C to +85 °C. For recording the water level changes, the ultrasonic sensor JSN-SR0T4-2.0 from Dollatek was used. The sensor measures the distance of an object with a 3 mm resolution in a range from 21 cm to 600 cm and can operate from −20 °C to +70 °C.
Mean daily surface temperature, daily maximum and minimum temperatures, and daily precipitation values were obtained for the Nevrokopi polje area (Figure 1) from the Nevrokopi station of the National Observatory of Athens (NOA) meteorological network [35] for a direct comparison between the cave water temperature oscillations and surface events. Additionally, a spring discharge dataset is used for a correlation between the flow rate of the spring and the temperature changes in the cave waters.
The spring discharge is estimated by a Geolux RSS-2-300WL flow meter which measures water level and surface velocity and uses a configured cross-section of the channel to calculate the discharge. Unfortunately, the location of the flow meter on the dam outside the spring (Figure 1iii) is not ideal and makes the spring hydrograph highly unreliable. The location at the dam construction means that the measurements are made in a pool upstream of the dam and not in a confined channel which makes the estimates sensitive to changes in water level, velocity, and in extension of the cross-sectional area. However, the rapid shifts that occur due to intense rainstorms are possible to detect in the spring hydrograph and thus make it possible to detect when the flood reaches the spring. The recording interval varied from 1 min in July 2020, to 30 min intervals from October 2020, to 4 h intervals from November 2021, and finally back to 30 min intervals from April 2022.
All the instruments were logging for the same period from 12 July 2020 to 26 September 2022 except for the Arduino logger, which only recorded for a period of 7 months between 29 August 2020 and 2 April 2021 when it was taken out of the cave.
3. Results
Surface temperature and precipitation are the external forces influencing cave water temperature and discharge variability in cave streams and springs. In the observation period, the mean annual air temperature (MAAT) at the surface in Nevrokopi polje was 11.4 °C, and 14.7 °C by the spring (Table 1). The highest temperatures occurred in July and August, reaching about 40 °C (Figure 3), while the coldest months were January and February, when the temperature dropped below −6 and −15 °C in the spring in the polje, respectively. In Nevrokopi, diurnal temperature fluctuations were up to 24 °C. The mean annual precipitation in the polje was 666.8 mm in the observation period. Rain occurs all year round, but most rainfall occurs during fall and winter. In winter, part of the precipitation also falls as snow. January and December 2021 were the wettest months (167.4 and 197.2 mm, respectively), and the highest daily precipitation recorded was 94.2 mm on 11 December 2021. The most prolonged dry period occurred from August–September 2020 and lasted 39 days.
Discharge was measured in the spring only. The readings are highly variable and present a degree of inconsistency, accordingly only the daily mean values of the dataset are presented for the period 27 October 2020 to 26 September 2022, except for the period 17 February 2022 to 21 April 2022 which is missing due to malfunctioning of the logger. The daily values range from 0.9 to 2.8 m3/s. This range seems very low compared with previous records from 1985 to 2009, when monthly measured spring discharge ranged from 0.144 to 35 m3/s [37]. In our record, the most intense rainfall events are detectable as rapid increases in the spring hydrograph. During our visits in low flow conditions at the cave, we estimated the discharge being around one order of magnitude lower than the recordings of the hydrograph. We believe this inconsistency is related to a water management structure placed on the spring, and as such, we treat the hydrograph data as qualitative instead of quantitative.
The temperature dataset comprises more than two years of hourly measurements from Maaras cave (Figure 3), and basic statistics for all stations are given in Table 1. At the uppermost station in the cave stream, S1 (Figure 2), the surface temperature signal is pronounced, with a strong seasonal pattern and an amplitude of 16.2 °C (Figure 3, dark blue). The highest values are measured from June–July and the lowest in January, in phase with temperature changes at the surface. During the winter–spring wet seasons, temperature fluctuations are distinct and follow larger trends in mean daily surface temperature. Diurnal temperature fluctuations frequently exceeding 1 °C are superimposed on long-term temperature fluctuations. During dry late summer, the temperature stabilizes, and an in-phase drop occurs as a response to the seasonal temperature drop during autumn; though short-lived, warm spikes protrude during rainfall events. At station S2, 3 km downstream, a similar seasonal pattern is also visible, with strong temperature fluctuations during winter and spring when diurnal fluctuations are also recorded (Figure 3, light blue). However, the water temperature is more stable throughout summer and fall, and only on rare occasions do rainfall events cause moderate temperature changes. At S2, the amplitude is 10.6 °C, which is lower than at S1. The water becomes warmer with a rise in mean annual water temperature (MAWT) from 12.5 °C to 14.3 °C, and the temperature stabilizes around 16.6 °C at S2 (Table 1). After the heavy rainstorm in December 2021, the temperature pattern of S2 deviates from S1. The lack of short-term (daily) oscillations superimposed on long-term (weekly to monthly) temperature fluctuations in 2022 may be due to the sensor being buried in the streambed.
Station M1 is in the siphon draining the Menikio branch (Figure 2) where the temperature signal strongly deviates from S1 (Figure 3). A seasonal pattern is poorly perceptible, with nearly constant summer temperatures and fluctuating, albeit with a reduced amplitude, winter-spring wet season temperatures. Hourly fluctuations occur most of the year, while diurnal fluctuations appear occasionally during spring. The annual amplitude in this branch is 4.6 °C and the temperature stabilizes at about 12.6 °C during summer, at a significantly lower level than in S1 and S2.
S3 is located 1.1 km downstream of the junction between the Menikio branch and the main passage. The temperature variability resembles that of S2, although with lower amplitudes, being cooler during summer and warmer during winter, likely due to mixing with water from the Menikio branch (Figure 3, purple curve). Contemporaneous logging of water temperature and water level in S3 demonstrates that stable water temperatures are linked to low-flow conditions while temperature fluctuations accompany high-flow conditions and abrupt discharge changes. Moreover, during high flow, diurnal temperature fluctuations are discernible to this location.
Station S4, 2 km downstream of S3 (Figure 2), has a damped temperature signal (amplitude 7.4 °C) devoid of diurnal fluctuations (Figure 3, green curve). The water is warmer than in S3 (Table 1). During dry seasons, the temperature in S4 tends to stabilize around 14.9 °C, close to the mean annual air temperature (MAAT) at the spring. The water temperature also approaches MAAT periodically during the wet seasons. Sensor S4 seem to have been buried at a shallow depth in the streambed in 2022 (Figure 3). Figure 4 displays typical wet and dry season transformation and mixing of the water temperature signal along the flow path inside Maaras.
Temperature recordings of cave air at stations S3 and S4 illustrate that the cave air temperature follows the water temperature (Figure 3, pink and yellow curve). The cave air thermographs display seasonal patterns like the water thermograph, with lower temperatures and cold spells during flood events in winter–spring wet seasons, and stable temperatures during the rest of the year.
4. Discussion
4.1. Thermal Patterns
Cave streams provide a unique opportunity to study water flow underground in situ. While springs mix the signal of hydrological and geological processes over an entire catchment and aquifer (e.g., [15,17]), caves offer the ability to study karst aquifers from the inside. In Maaras cave, it is possible to study how thermal signals are transmitted and transformed due to recharge conditions and aquifer/conduit characteristics. Luhmann et al. [17] identified four distinct thermal patterns and divided them into two groups: those with flow paths through conduits with ineffective heat exchange (characterized by event-scale fluctuations and in-phase seasonal fluctuations), and those with flow through fractures and pores in the rock matrix with effective heat exchange (characterized by out of phase seasonal fluctuations and long-term stability). The overall thermal pattern of station S1 reflects the general pattern of the mean daily outside air temperature in the recharge area (i.e., event-scale fluctuations; Figure 3). The thermograph in S1 is characterized by seasonal and long-term (days to weeks) temperature fluctuations that we believe represent concentrated recharge through the ponor. Temperature excursions due to intense rainfall events protrude all-year round. In autumn, diurnal fluctuations deplete in S1, and the temperature signal becomes more stable or is in phase with the seasonal surface temperature signal. This shift probably reflects a transition to diffuse-dominated recharge of the system. This thermal pattern indicates an inefficient heat exchange along the flow path from the ponor to S1. The inefficient heat exchange is probably due to fast flow through conduits with a low contact surface. Station S1 is about halfway between the ponor and the spring (Table 1), and between the upstream siphon and S1 (about 1.2 km) the cave floor is dominated by large breakdown material. The channel-reach morphology is dominated by cascades with turbulent flow and some pools between blocks, providing short contact time and low heat exchange between water and rock. The lag time between the surface air temperature and the water temperature at S1 was measured manually between peaks and troughs in the thermographs and is typically between 18 and 22 h (Figure 5.), though this lag must be taken with reservation since air and water temperatures at the surface are not in phase. However, travel times between 15 and 30 h are found in previous studies [36,37,39], and transmission of temperature fluctuations on shorter timescales than a day also implies that the flow path consists of larger conduits that carry turbulent flow [22].
Inside Maaras cave, from S1 to S4, the water flows on a sandy streambed in a large conduit, and the general transformation of the temperature signal is that fluctuations are damped and the water is heated (Figure 4). The amplitude of diurnal fluctuations are halved from S1 to S2 and then again halved to S3 and do not reach S4 (Figure 5). The delay between S1 and S2 was roughly 2 h, while the delay between S2 and S3 is similar to the measuring interval (i.e., 1 h). During baseflow conditions, the temperature increase from S1 to S2 may be up to 3.5 °C, and from S3 to S4, the temperature increase is about 1 °C. Between S2 and S3, water from the Menikio branch is mixed into the cave stream. Under high and increasing flow rates, there is negligible temperature change from S1 to S2 and further on to S3. Under low flow rates, the temperature in S3 is significantly lower than in S2 and clearly influenced by water from M1, suggesting that the flow rate in the Menikio branch is less variable than the main passage and thus contributes with a larger proportion of the flow during baseflow conditions.
Even under flood recession during the winter–spring wet seasons, the temperature in S4 almost reaches the stable temperature that dominates during the dry season (Figure 3). Accordingly, there is an anomaly between the S4 thermograph and the other stations during these phases (Figure 6). Increasing water temperature during a recession shows that the flood water reaches a higher temperature with a discrepancy compared with the upstream stations (Figure 5, vertical bars). During flooding, there is high sediment mobility in the cave (cave guides report on high turbidity and sediment transport during flooding). The lack of short-term fluctuations in recordings from S2 and S4 in 2022 makes us assume that the sensors had been buried in the streambed, thus recording the temperature in the hyporheic flow. The thermal pattern of S2 and S4 displays a combination of event-scale fluctuations during the wet season and long-term (months) stability during the dry season (Figure 6), which may have been attributed to the shift in recharge conditions if the upstream thermographs did not exist. The contrast between the thermograph of S1 and S2 is striking (Figure 6), considering the surface temperature signal that reaches S1 after more than 5 km of underground flow is blurred within the next 3 km. The transformation of the thermal signal should be attributed to the flow conditions inside Maaras cave. Between stations S1 and S4, the cave stream flows on a low-gradient sand-bed channel dominated by dune–ripple morphology. Dune–ripple channels exhibit high bed mobility where significant sediment transport occurs at most stages [40], suggesting an effective heat exchange between the water and the sediments. Effective heat exchange may also be attributed to hyporheic flow in the streambed [28], which equilibrates the water temperature with the temperature of the sediments. While effective heat exchange is normally assigned to small conduit geometry and/or diffuse recharge [17], the thermographs from Maaras demonstrate that a similar transformation of the thermal signal may occur in large cave conduits when the cave stream interacts with a porous aquifer in the streambed. Furthermore, comparing the dry season temperature patterns from the various stations (Figure 6) reveals that the thick cave deposits must have a relatively high temperature that strongly impacts the water temperature.
The thermal pattern of the Menikio branch is characterized by long-term stability during summer and fall, extending into winter (Figure 3 and Figure 5, red curve). During winter and spring, the temperature fluctuates in response to long-term shifts in mean daily temperature on a timescale from days to weeks (Figure 5). Fluctuations directly responding to intense rainfall events are harder to detect (Figure 7). A conspicuous feature in the M1 thermograph is the frequent oscillations exceeding 0.5 °C, which are evident in all seasons and not related to any specific flow conditions (e.g., July–August 2020, and from January–September 2021, Figure 3). The explored part of the Menikio branch comprises a large water-filled conduit, clean of sediments. The M1 sensor is placed in the junction where the water from the siphon enters the cave stream. The cross-section of the siphon is about 5 m in diameter. The noisy signal may be due to turbulent water mixing from the main channel and the Menikio affluent. Alternatively, the frequent oscillations are due to minor shifts in the current from the siphon. When the water flux through a large water-filled conduit is relatively low compared with the total water volume in the conduit, there might be a minor thermal gradient between a piston flow and a boundary layer along the conduit walls. Small shifts in the position of the main current flowing out of the siphon may be reflected as rapid oscillations in the water temperature. In February–March 2022, the M1 thermograph displays weak diurnal fluctuations, typically less than 0.2 °C (Figure 8). The lag time is 4–6 h longer than in S1 (15–17 h). In contrast, the delay from S1 to S2 tends to be around 2 h, which implies that the fluctuations in M1 are not caused by influence from the cave stream but by the external forcing from the air temperature in the recharge area, probably related to snowmelt.
While the mean annual temperature of M1 is slightly lower than S1 (Table 1), the value where the temperature stabilizes is considerably lower (Figure 3 and Figure 6). The stable temperature and damped response to rainstorms suggest that Menikio branch is not fed by ponors in the polje or any other point recharge. The recharge is probably diffuse infiltration, and the low temperature suggests recharge at a high altitude, possibly somewhere in the adjacent Menikio mountain. Diurnal temperature fluctuation during snowmelt shows that the residence time may be similar in the two branches (Figure 8), although not fed by the same recharge area. The thermal pattern implies that the heat exchange along this flow path is more efficient than in the rest of the cave, despite similar residence times. In active stream caves, the stream water controls the heat flow through the karstic system, and the geothermal heat flux may be reduced by order of magnitude in active karst systems and only explains a slight warming of the karst water [20,41,42]. The temperature difference between the dry season temperature in M1 and S2 is substantial (about 4 °C; Figure 4 and Figure 6) despite these two stations being only 80 m apart. We suggest that the low and stable temperature in the Menikio branch implies that the temperature equilibrates in fracture networks at shallow depths, possibly in the epikarst or the upper vadose zone, i.e., in the homothermic zone where the temperature is close to the surface MAAT though not affected by seasonal temperature changes [41]. The high water flux in karstic systems reduces the geothermal gradient significantly, especially in the phreatic zone comprising karst conduits [20]. We, therefore, suggest that the thermal signal of the Menikio branch is controlled by diffuse recharge at high altitudes and efficiently transmitted through large, water-filled conduits (clean of sediment) with minor changes in the temperature along the path. The lack of sediments in the Menikio branch is attributed to higher flow rates (preventing sedimentation) or a lack of sediment supply (possibly due to diffuse recharge).
4.2. Multi Permeability System and Hybrid Aquifers
Karst aquifers often comprise both dual permeability and dual flow systems [43] with diffuse water circulation in the rock matrix and fissure networks, in addition to concentrated flow in the karst conduits (e.g., [44,45]). The marble bedrock in Maaras suggests that the matrix porosity is low and thus that the conduit–matrix exchange is also negligible in the inaccessible parts of the system. Still, there might be a dual permeability of the karst aquifer due to coupling between conduits and fracture networks, revealed by diffuse infiltration and speleothem formations in the cave. However, the temperature signal at S1 does not seem to be influenced by a slow flow component when recharged through the ponor. Heat exchange through conduction by hyporheic flow within the sediments in the streambed [28] seems to be significant in dune–ripple morphology. In addition, high bed mobility suggests that conduction between water and sediment may be even more efficient in this kind of “live bed” condition (e.g., [46]) and not only related to the hyporheic exchange [28].
The system described in Maaras cave is a multi-porosity or multi-permeability system but contrasts other karstic systems in that a porous aquifer is located inside the large karst conduits. A triple permeability model of karst aquifer usually refers to the permeability of the matrix, fractures, and conduits [5]. The multi-permeability of karst aquifers is usually related to the multi porosity in the rock itself, with a high hydraulic conductivity in conduits and a moderate to low hydraulic conductivity in fracture networks and the matrix in contrast to the Maaras system. In Maaras, the karstic rock has a low matrix porosity due to metamorphosis, although there is a certain porosity in fracture networks. However, the hydraulic conductivity in the rock surrounding the cave conduits of Maaras is orders of magnitude less than in the clastic sediments inside the cave conduits. We believe the temperature rise along the cave stream occurs because of conductive and advective heat exchange between the cave sediments and the cave stream. When the flow rate increases, cold water flows from the cave stream into the porous aquifer in the streambed and the fluvial terraces along the stream. During the recession, the flow is reversed, and heat is released from the sediments into the stream (Figure 9) along longitudinal and transversal flowlines in the porous aquifer. This flow pattern is an analogue to how previous authors (e.g., [5]) have explained coupling in ordinary heterogeneous karst aquifers where fracture/matrix systems are recharged from conduits during flood and drained into conduits during base flow. However, the high porosity of the cave sediments and the intensified heat exchange due to sediment mobility and hyporheic flow make the porous aquifer’s thermal imprint on the karst aquifer’s thermal signal exceptional. Consequently, the thermal pattern of the cave stream in Maaras is not typical of a karstic aquifer but distorted and transformed through water and heat exchange with the porous aquifer in the clastic cave sediments that fills up as much as 64–95% of the conduits [34]. Maaras may be seen as a hybrid aquifer where the karstic aquifer holds a porous aquifer. This shows that the transformation of thermal signals from karst springs may be quite complex due to the integrations of highly different signals.
5. Conclusions
This study contributes to our understanding of how thermal signals are transmitted through karst waters and aquifers. Deploying an extensive network of water thermographs along the Maaras cave and monitoring the temperature fluctuations over two years enabled us to:
- Recognize that although effective heat exchange is typically assigned to small conduit geometry and/or diffuse flow, inside Maaras, it is evident that a similar transformation of the thermal signal occurs in large cave conduits due to the interaction between the cave stream and a porous aquifer in the streambed.
- Decode the thermal signal of the Menikio branch that is controlled by diffuse recharge at high altitudes. The temperature transformation probably occurs through fracture flow at shallow depths, while water flow through large, water-filled conduits (clean of sediment) possibly transmits the signal efficiently with minor changes in temperature along the path.
- Understand that in caves/karst aquifers with an abundance of clastic sediments on riverbeds, heat exchange between water and sediment is highly efficient due to the combined effect of high bed mobility, hyporheic exchange flow, and a sizeable porous aquifer with a stable temperature.
Author Contributions
Conceptualization, R.Ø.S. and C.P.; methodology, R.Ø.S. and C.P.; formal analysis, R.Ø.S. and C.P.; investigation, C.P. and Y.S.; writing—original draft preparation, R.Ø.S. and C.P.; writing—review and editing, A.P. and Y.S.; visualization, R.Ø.S. and C.P. All authors have read and agreed to the published version of the manuscript.
Funding
Part of this research was funded by Romanian Ministry of Education and Research, CNCS-UEFISCDI grant number PN-III-P4-ID-PCE-2020-2723.
Data Availability Statement
Data available upon request.
Acknowledgments
The International Union of Speleology is thanked for providing a grant through the Maaras expedition 2018 for logger acquirement. We thank Omiros Koutris and the Aggitis S.A. for providing the spring discharge data. Ioannis Koletsis from the National Observatory of Athens is highly acknowledged for sharing the meteorological data from the Ochiro station. The Hellenic Ministry of Culture is thanked for providing permission to perform the study and allowing the execution of the fieldwork. Permission is granted to Christos Pennos (reference number: ΥΠΠOA/ΓΔAΠΚ/EΠΣ/ΤAΠIΠ/307618/181597/5084/2126). A.P. acknowledges support by the project PN-III-P4-ID-PCE-2020-2723. The authors are also grateful for the facilities made available by the municipal cooperation of Prosotsani. Kiriakos Papadopoulos, Dimitris Stergiakos, and Nikos Diafas are highly acknowledged for their help. Cavers Stavros Zachariadis, Tasos Polihroniadis, Argiris Manolas, and Thodoros Papapostolou are acknowledged for assisting in the fieldwork. C.P. and Y.S. dedicate this work in loving memory of Eugenia Kiourexidou, a true and inspiring friend and a great caver with a passion for Maaras cave. We thank two anonymous reviewers, whose comments helped improved the manuscript.
Conflicts of Interest
The authors declare no conflict of interest.
References
- Stevanović, Z. Karst waters in potable water supply: A global scale overview. Environ. Earth Sci. 2019, 78, 662. [Google Scholar] [CrossRef]
- Goldscheider, N.; Chen, Z.; Auler, A.; Bakalowicz, M.; Broda, S.; Drew, D.; Hartmann, J.; Jiang, G.; Moosdorf, N.; Stevanovic, Z.; et al. Global distribution of carbonate rocks and karst water resources. Appl. Hydrogeol. 2020, 28, 1661–1677. [Google Scholar] [CrossRef] [Green Version]
- Olarinoye, T.; Gleeson, T.; Hartmann, A. Karst spring recession and classification: Efficient, automated methods for both fast- and slow-flow components. Hydrol. Earth Syst. Sci. 2022, 26, 5431–5447. [Google Scholar] [CrossRef]
- Kiraly, L. Karstification and Groundwater Flow. Speleogenesis Evol. Karst Aquifers 2003, 1, 155–192. [Google Scholar]
- White, W.B. Karst hydrology: Recent developments and open questions. Eng. Geol. 2002, 65, 85–105. [Google Scholar] [CrossRef]
- Kovács, A.; Perrochet, P.; Király, L.; Jeannin, P.-Y. A quantitative method for the characterisation of karst aquifers based on spring hydrograph analysis. J. Hydrol. 2005, 303, 152–164. [Google Scholar] [CrossRef] [Green Version]
- Fiorillo, F. The Recession of Spring Hydrographs, Focused on Karst Aquifers. Water Resour. Manag. 2014, 28, 1781–1805. [Google Scholar] [CrossRef]
- Shuster, E.T.; White, W.B. Seasonal fluctuations in the chemistry of lime-stone springs: A possible means for characterizing carbonate aquifers. J. Hydrol. 1971, 14, 93–128. [Google Scholar] [CrossRef]
- Jones, W.K. Chapter 134—Water tracing in karst aquifers. In Encyclopedia of Caves, 3rd ed.; White, W.B., Culver, D.C., Pipan, T., Eds.; Academic Press: Cambridge, MA, USA, 2019; pp. 1144–1155. [Google Scholar]
- Benischke, R. Review: Advances in the methodology and application of tracing in karst aquifers. Hydrogeol. J. 2021, 29, 67–88. [Google Scholar] [CrossRef]
- Gabrovšek, F.; Peric, B.; Kaufmann, G. Hydraulics of epiphreatic flow of a karst aquifer. J. Hydrol. 2018, 560, 56–74. [Google Scholar] [CrossRef]
- Vysoká, H.; Bruthans, J.; Falteisek, L.; Žák, K.; Rukavičková, L.; Holeček, J.; Schweigstillová, J.; Oster, H. Hydrogeology of the deepest underwater cave in the world: Hranice Abyss, Czechia. Hydrogeol. J. 2019, 27, 2325–2345. [Google Scholar] [CrossRef]
- Geyer, T.; Birk, S.; Liedl, R.; Sauter, M. Quantification of temporal distribution of recharge in karst systems from spring hydrographs. J. Hydrol. 2008, 348, 452–463. [Google Scholar] [CrossRef]
- Nannoni, A.; Piccini, L. Mixed Recharge and Epikarst Role in a Complex Metamorphic Karst Aquifer: The Pollaccia System, Apuan Alps (Tuscany, Italy). Hydrology 2022, 9, 83. [Google Scholar] [CrossRef]
- Manga, M. Using Springs to Study Groundwater Flow and Active Geologic Processes. Annu. Rev. Earth Planet. Sci. 2001, 29, 201–228. [Google Scholar] [CrossRef] [Green Version]
- Anderson, M.P. Heat as a Ground Water Tracer. Groundwater 2005, 43, 951–968. [Google Scholar] [CrossRef]
- Luhmann, A.J.; Covington, M.D.; Peters, A.J.; Alexander, S.C.; Anger, C.T.; Green, J.A.; Runkel, A.C.; Alexander, E.C., Jr. Classification of Thermal Patterns at Karst Springs and Cave Streams. Groundwater 2011, 49, 324–335. [Google Scholar] [CrossRef]
- Martin, J.B.; Dean, R.W. Temperature as a natural tracer of short residence times for groundwater in karst aquifers. Karst Model. Karst Waters Inst. Spec. Publ. 1999, 5, 236–242. [Google Scholar]
- Screaton, E.; Martin, J.B.; Ginn, B.; Smith, L. Conduit properties and karstification in the unconfined Floridan aquifer. Groundwater 2004, 42, 338–346. [Google Scholar] [CrossRef]
- Jeannin, P.Y.; Liedl, R.; Sauter, M. Some concepts about heat transfer in karstic systems. In Proceedings of the 12th International Congress of Speleology, La Chaux de Fonds, Switzerland, 10–17 August 1997; pp. 195–198. [Google Scholar]
- Genthon, P.; Bataille, A.; Fromant, A.; D’Hulst, D.; Bourges, F. Temperature as a marker for karstic waters hydrodynamics. Inferences from 1 year recording at La Peyrére cave (Ariège, France). J. Hydrol. 2005, 311, 157–171. [Google Scholar] [CrossRef]
- Covington, M.D.; Luhmann, A.J.; Wicks, C.M.; Saar, M.O. Process length scales and longitudinal damping in karst conduits. J. Geophys. Res. Atmos. 2012, 117, F01025. [Google Scholar] [CrossRef] [Green Version]
- Luo, M.; Chen, Z.; Zhou, H.; Jakada, H.; Zhang, L.; Han, Z.; Shi, T. Identifying structure and function of karst aquifer system using multiple field methods in karst trough valley area, South China. Environ. Earth Sci. 2016, 75, 824. [Google Scholar] [CrossRef]
- Doucette, R.; Peterson, E.W. Identifying water sources in a karst aquifer using thermal signatures. Environ. Earth Sci. 2014, 72, 5171–5182. [Google Scholar] [CrossRef]
- Covington, M.D.; Luhmann, A.J.; Gabrovšek, F.; Saar, M.O.; Wicks, C.M. Mechanisms of heat exchange between water and rock in karst conduits. Water Resour. Res. 2011, 47, W10514. [Google Scholar] [CrossRef] [Green Version]
- Birk, S.; Liedl, R.; Sauter, M. Karst Spring Responses Examined by Process-Based Modeling. Groundwater 2006, 44, 832–836. [Google Scholar] [CrossRef] [PubMed]
- Stonestrom, D.A.; Constantz, J. Heat as a Tool for Studying the Movement of Ground Water Near Streams; US Department of the Interior, US Geological Survey: Reston, VA, USA, 2003; Volume 1260. [Google Scholar]
- Dogwiler, T.; Wicks, C.M. Sediment entrainment and transport in fluviokarst systems. J. Hydrol. 2004, 295, 163–172. [Google Scholar] [CrossRef]
- Constantz, J. Heat as a tracer to determine streambed water exchanges. Water Resour. Res. 2008, 44, W00D10. [Google Scholar] [CrossRef]
- Vavliakis, E.; Psilovikos, A.; Sotiriadis, L. The epigenetic Valley of the Aggitis river and its relation with the evolution of Drama and Serres basins. Geol. Geophys. Stud. (IGME) 1986, 6, 5–14. [Google Scholar]
- Psilovikos, A. Neotectonic impact on the modification of drainage networks of the Southwestern Rhodope. Bull. Geol. Soc. Greece 1990, XXII, 171–182. [Google Scholar]
- Christanis, K.; Georgakopoulos, A.; Fernández-Turiel, J.; Bouzinos, A. Geological factors influencing the concentration of trace elements in the Philippi peatland, eastern Macedonia, Greece. Int. J. Coal Geol. 1998, 36, 295–313. [Google Scholar] [CrossRef]
- Pennos, C.; Lauritzen, S.; Pechlivanidou, S.; Sotiriadis, Y. Geomorphic constrains on the evolution of the aggitis river basin northern Greece (a preliminary report). Bull. Geol. Soc. Greece 2017, 50, 365–373. [Google Scholar] [CrossRef] [Green Version]
- Lønøy, B.; Pennos, C.; Tveranger, J.; Fikos, I.; Vargemezis, G.; Lauritzen, S.-E. Delimiting morphological and volumetric elements of cave surveys as analogues for paleokarst reservoir modelling–A case study from the Maaras cave system, northern Greece. Mar. Pet. Geol. 2021, 129, 105091. [Google Scholar] [CrossRef]
- Lagouvardos, K.; Kotroni, V.; Bezes, A.; Koletsis, I.; Kopania, T.; Lykoudis, S.; Mazarakis, N.; Papagiannaki, K.; Vougioukas, S. The automatic weather stations NOANN network of the National Observatory of Athens: Operation and database. Geosci. Data J. 2017, 4, 4–16. [Google Scholar] [CrossRef]
- Novel, J.-P.; Dimadi, A.; Zervopoulou, A.; Bakalowicz, M. The Aggitis karst system, Eastern Macedonia, Greece: Hydrologic functioning and development of the karst structure. J. Hydrol. 2007, 334, 477–492. [Google Scholar] [CrossRef]
- Petalas, C.P.; Moutsopoulos, K.N. Hydrogeologic Behavior of a Complex and Mature Karst Aquifer System under Drought Condition. Environ. Process. 2019, 6, 643–671. [Google Scholar] [CrossRef]
- Pennos, C. Aquabug, a Multiparameter Logger to Monitor Cave Streams. 2020. GitHub repository. Available online: https://git-hub-app.website/desktop-app/index.html (accessed on 15 December 2022).
- Reile, P. EXPEDITION 10—Le karst du massif du Falakro et la résurgence de Aggitis cave (Maaras)—Résultats des travaux hydrogéologiques et topographiques, Province de Drama—Macedoine, Grèce du Nord. Spelunca. 2011. Available online: https://www.researchgate.net/publication/234063379_Austropotamobius_torrentium_Schrank_1803_in_the_Aggitis_Cave_northern_Greece_Is_it_a_cave-dwelling_species (accessed on 15 December 2022).
- Montgomery, D.R.; Buffington, J.M. Channel-reach morphology in mountain drainage basins. GSA Bull. 1997, 109, 596–611. [Google Scholar] [CrossRef]
- Luetscher, M.; Jeannin, P.-Y. Temperature distribution in karst systems: The role of air and water fluxes. Terra Nova 2004, 16, 344–350. [Google Scholar] [CrossRef]
- Huckinghaus, D.; Liedel, R.; Sauter, M. Characterization of karst aquifers by heat transfer. In Proceedings of the 12th International Congress of Speleology, La Chaux de Fonds, Switzerland, 10–17 August 1997; pp. 145–148. [Google Scholar]
- Kiraly, L. Modelling karst aquifers by the combined discrete channel and continuum approach. Bull. Cent. D’hydrogéologie 1998, 16, 77–98. [Google Scholar]
- Liedl, R.; Sauter, M.; Hückinghaus, D.; Clemens, T.; Teutsch, G. Simulation of the development of karst aquifers using a coupled continuum pipe flow model. Water Resour. Res. 2003, 39, 1057. [Google Scholar] [CrossRef]
- Dreybrodt, W.; Gabrovšek, F.; Romanov, D. Processes of a Speleogenessis [sic]: A Modeling Approach; Založba ZRC: Ljubljana, Slovenia, 2005; Volume 4. [Google Scholar]
- Henderson, F.M. Stability of alluvial channels. Trans. Am. Soc. Civ. Eng. 1963, 128, 657–686. [Google Scholar] [CrossRef]
Figure 1.
Geological map of the broader area of the Nevrokopi—Maaras karstic system (based on Pennos et al. [33] and references within). The magenta circle shows the position of the NOA station [35]. (i) Shows a topographic cross section from the ponor (A) to the spring (A’) and the red dashed line corresponds to the longitudinal projection of Maaras cave. (ii) View of the Nevrokopi Polje from the area of the meteorological station. (iii) View of the Aggitis spring (i.e., entrance of Maaras cave).

Figure 2.
Plan view of Maaras cave (from Pennos et al. [33]). Inlets (a)–(f) are photographs from the cave which correspond to points a–f along the cave. S1–S4 and M1 are the name of the monitoring stations and correspond to the positions the loggers were placed. The cyan halo shows the Menikio branch; the magenta halo highlights the right branch (see text for explanation).

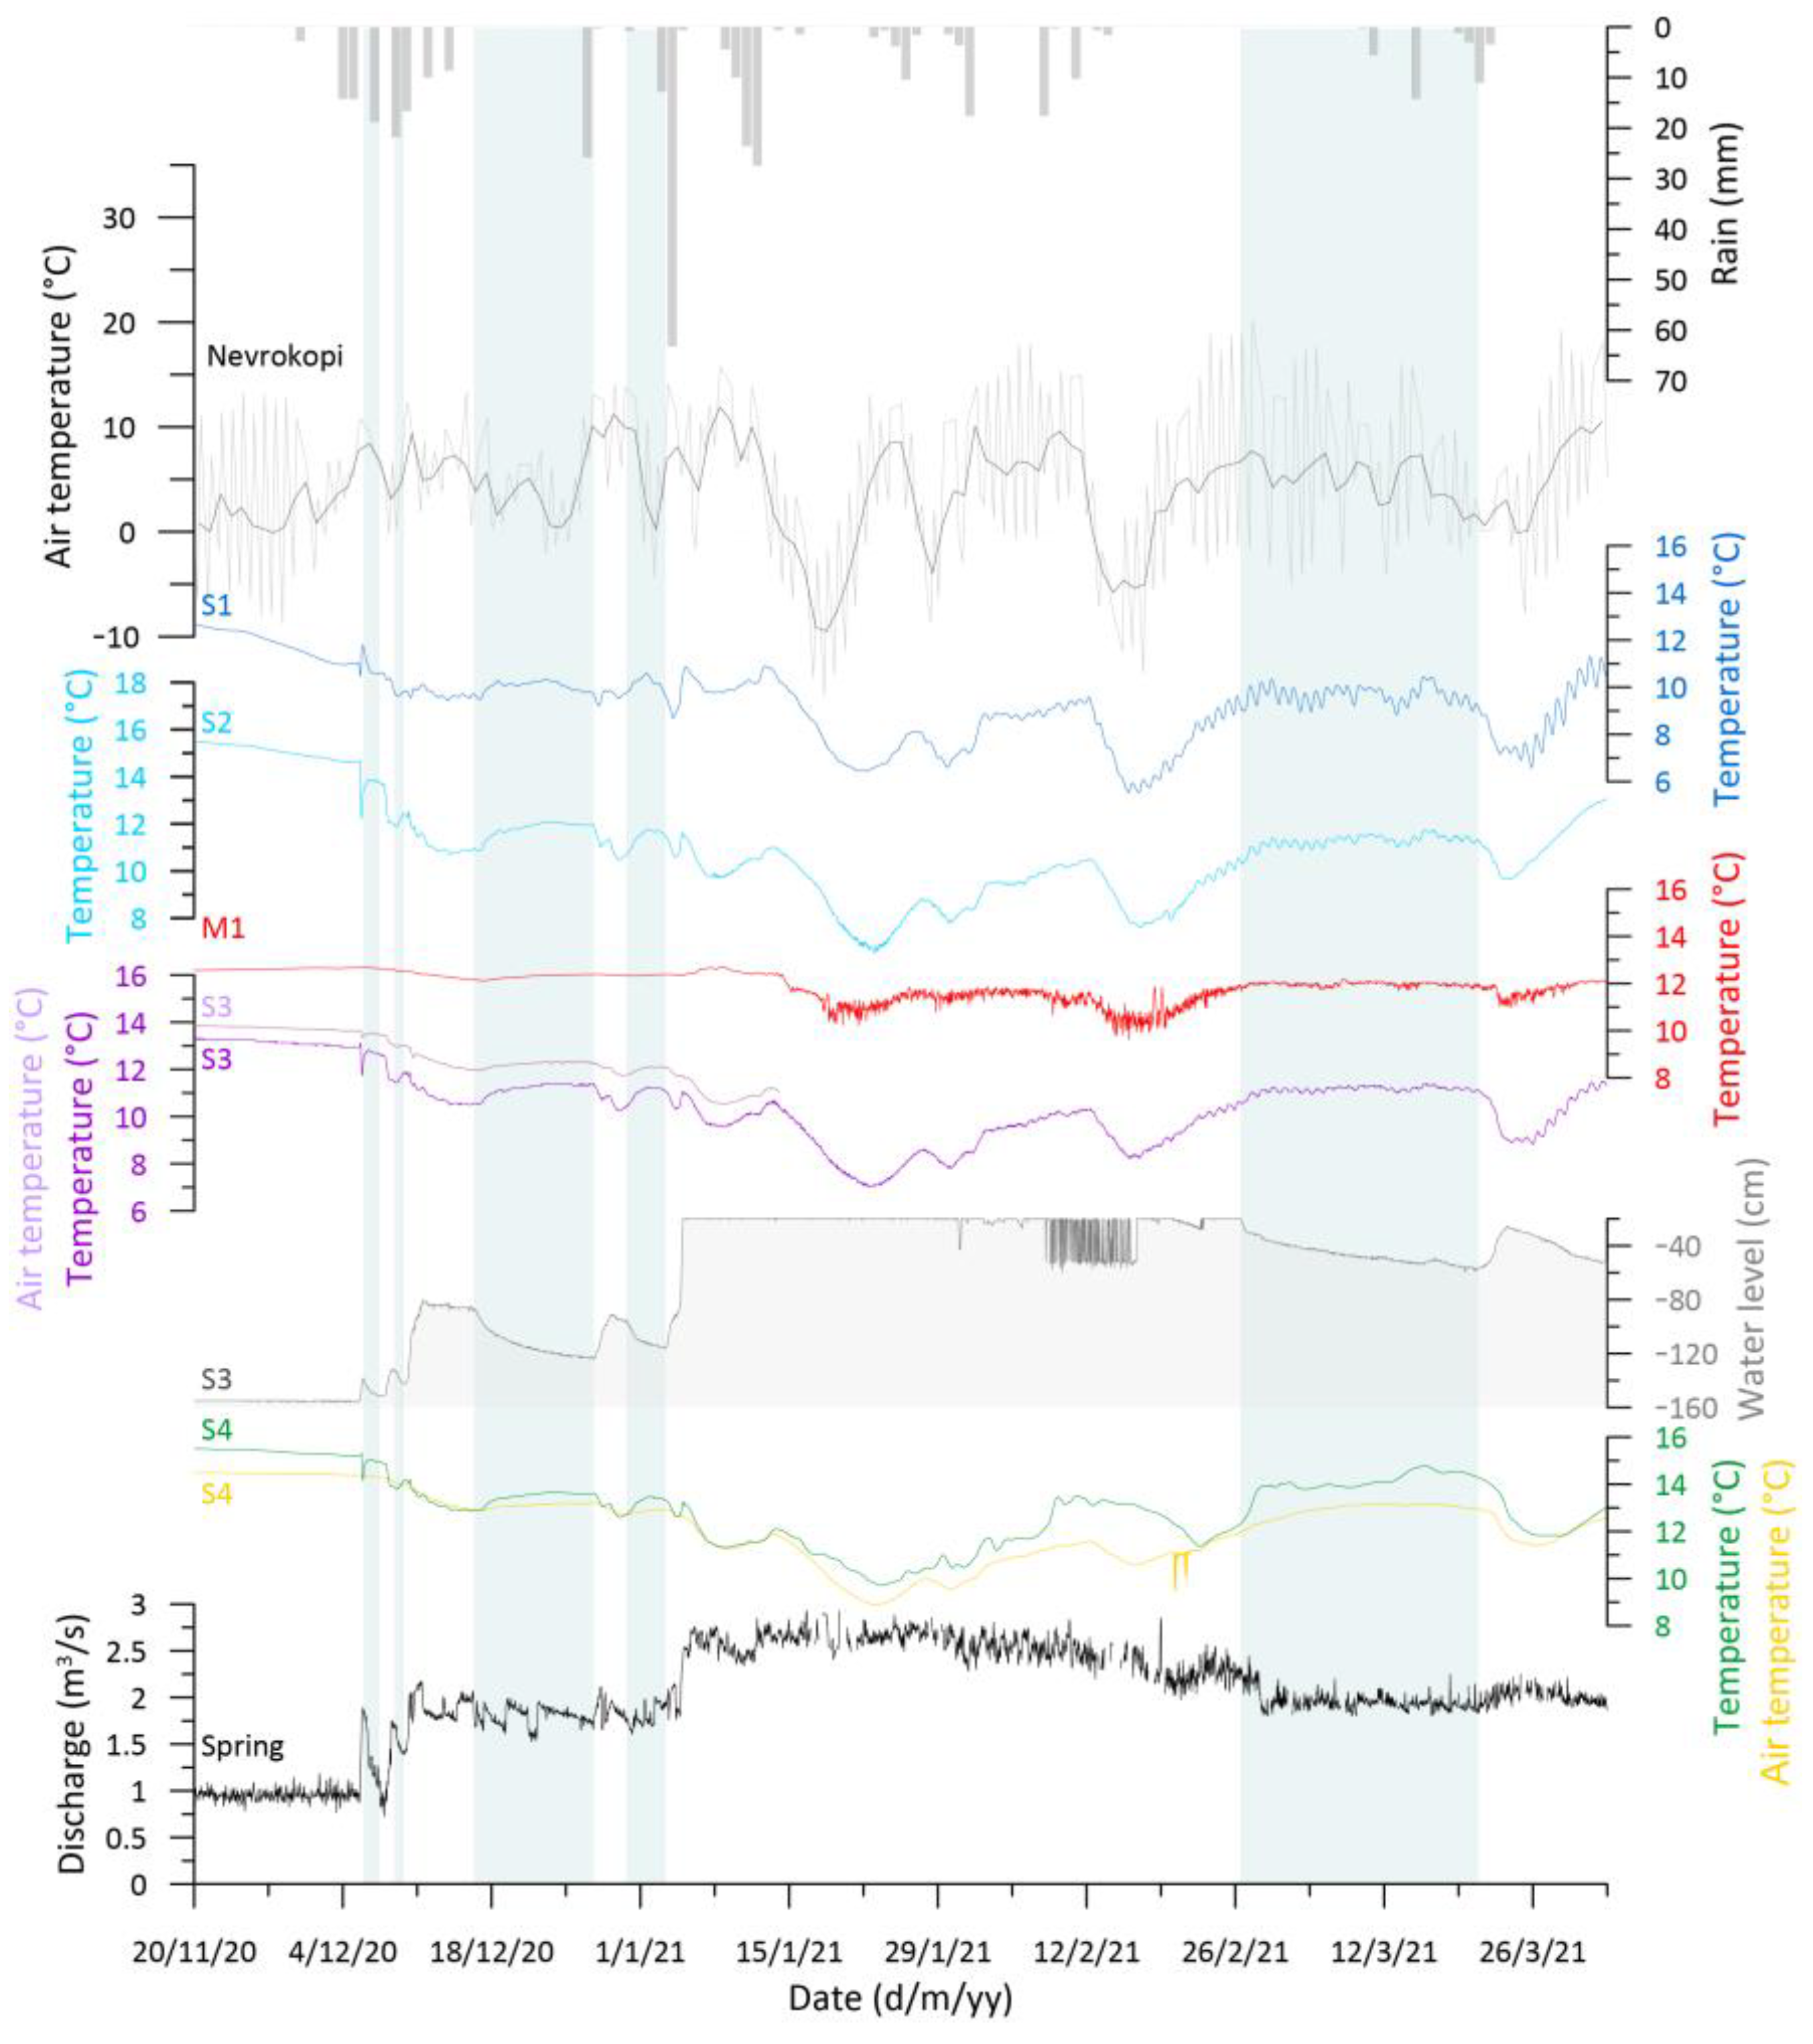
Figure 3.
Graphs with the complete records of water temperature, water level, and air temperature inside the cave, precipitation and air temperature at Nevrokopi polje close to the ponor, and air temperature and discharge at the spring. Air temperatures outside are shown as daily mean in addition to daily maximum and minimum temperatures for the Nevrokopi record. Discharge data are shown as daily mean values though the values are not reliable; however, abrupt rises indicate rapid increases in flow rate. The flat top of the water level curve is an artefact because the level was out of the range of the sensor. Blue colour bars represent the winter–spring wet season (W-Sp Wet), while brown bars represent the summer–autumn dry season (Su-A Dry). The dotted horizontal lines mark the stable temperature (defined by September 2021).

Figure 4.
The graph presents typical dry and wet season input temperature (S1 and M1) and temperature evolution along the cave path in Maaras represented by the temperature measurements on 1 November 2020 and 1 March 2021, respectively.
Figure 4.
The graph presents typical dry and wet season input temperature (S1 and M1) and temperature evolution along the cave path in Maaras represented by the temperature measurements on 1 November 2020 and 1 March 2021, respectively.

Figure 5.
November 2020 to April 2021 recordings. Blue vertical bars indicate recession periods based on water level at station S3.
Figure 5.
November 2020 to April 2021 recordings. Blue vertical bars indicate recession periods based on water level at station S3.

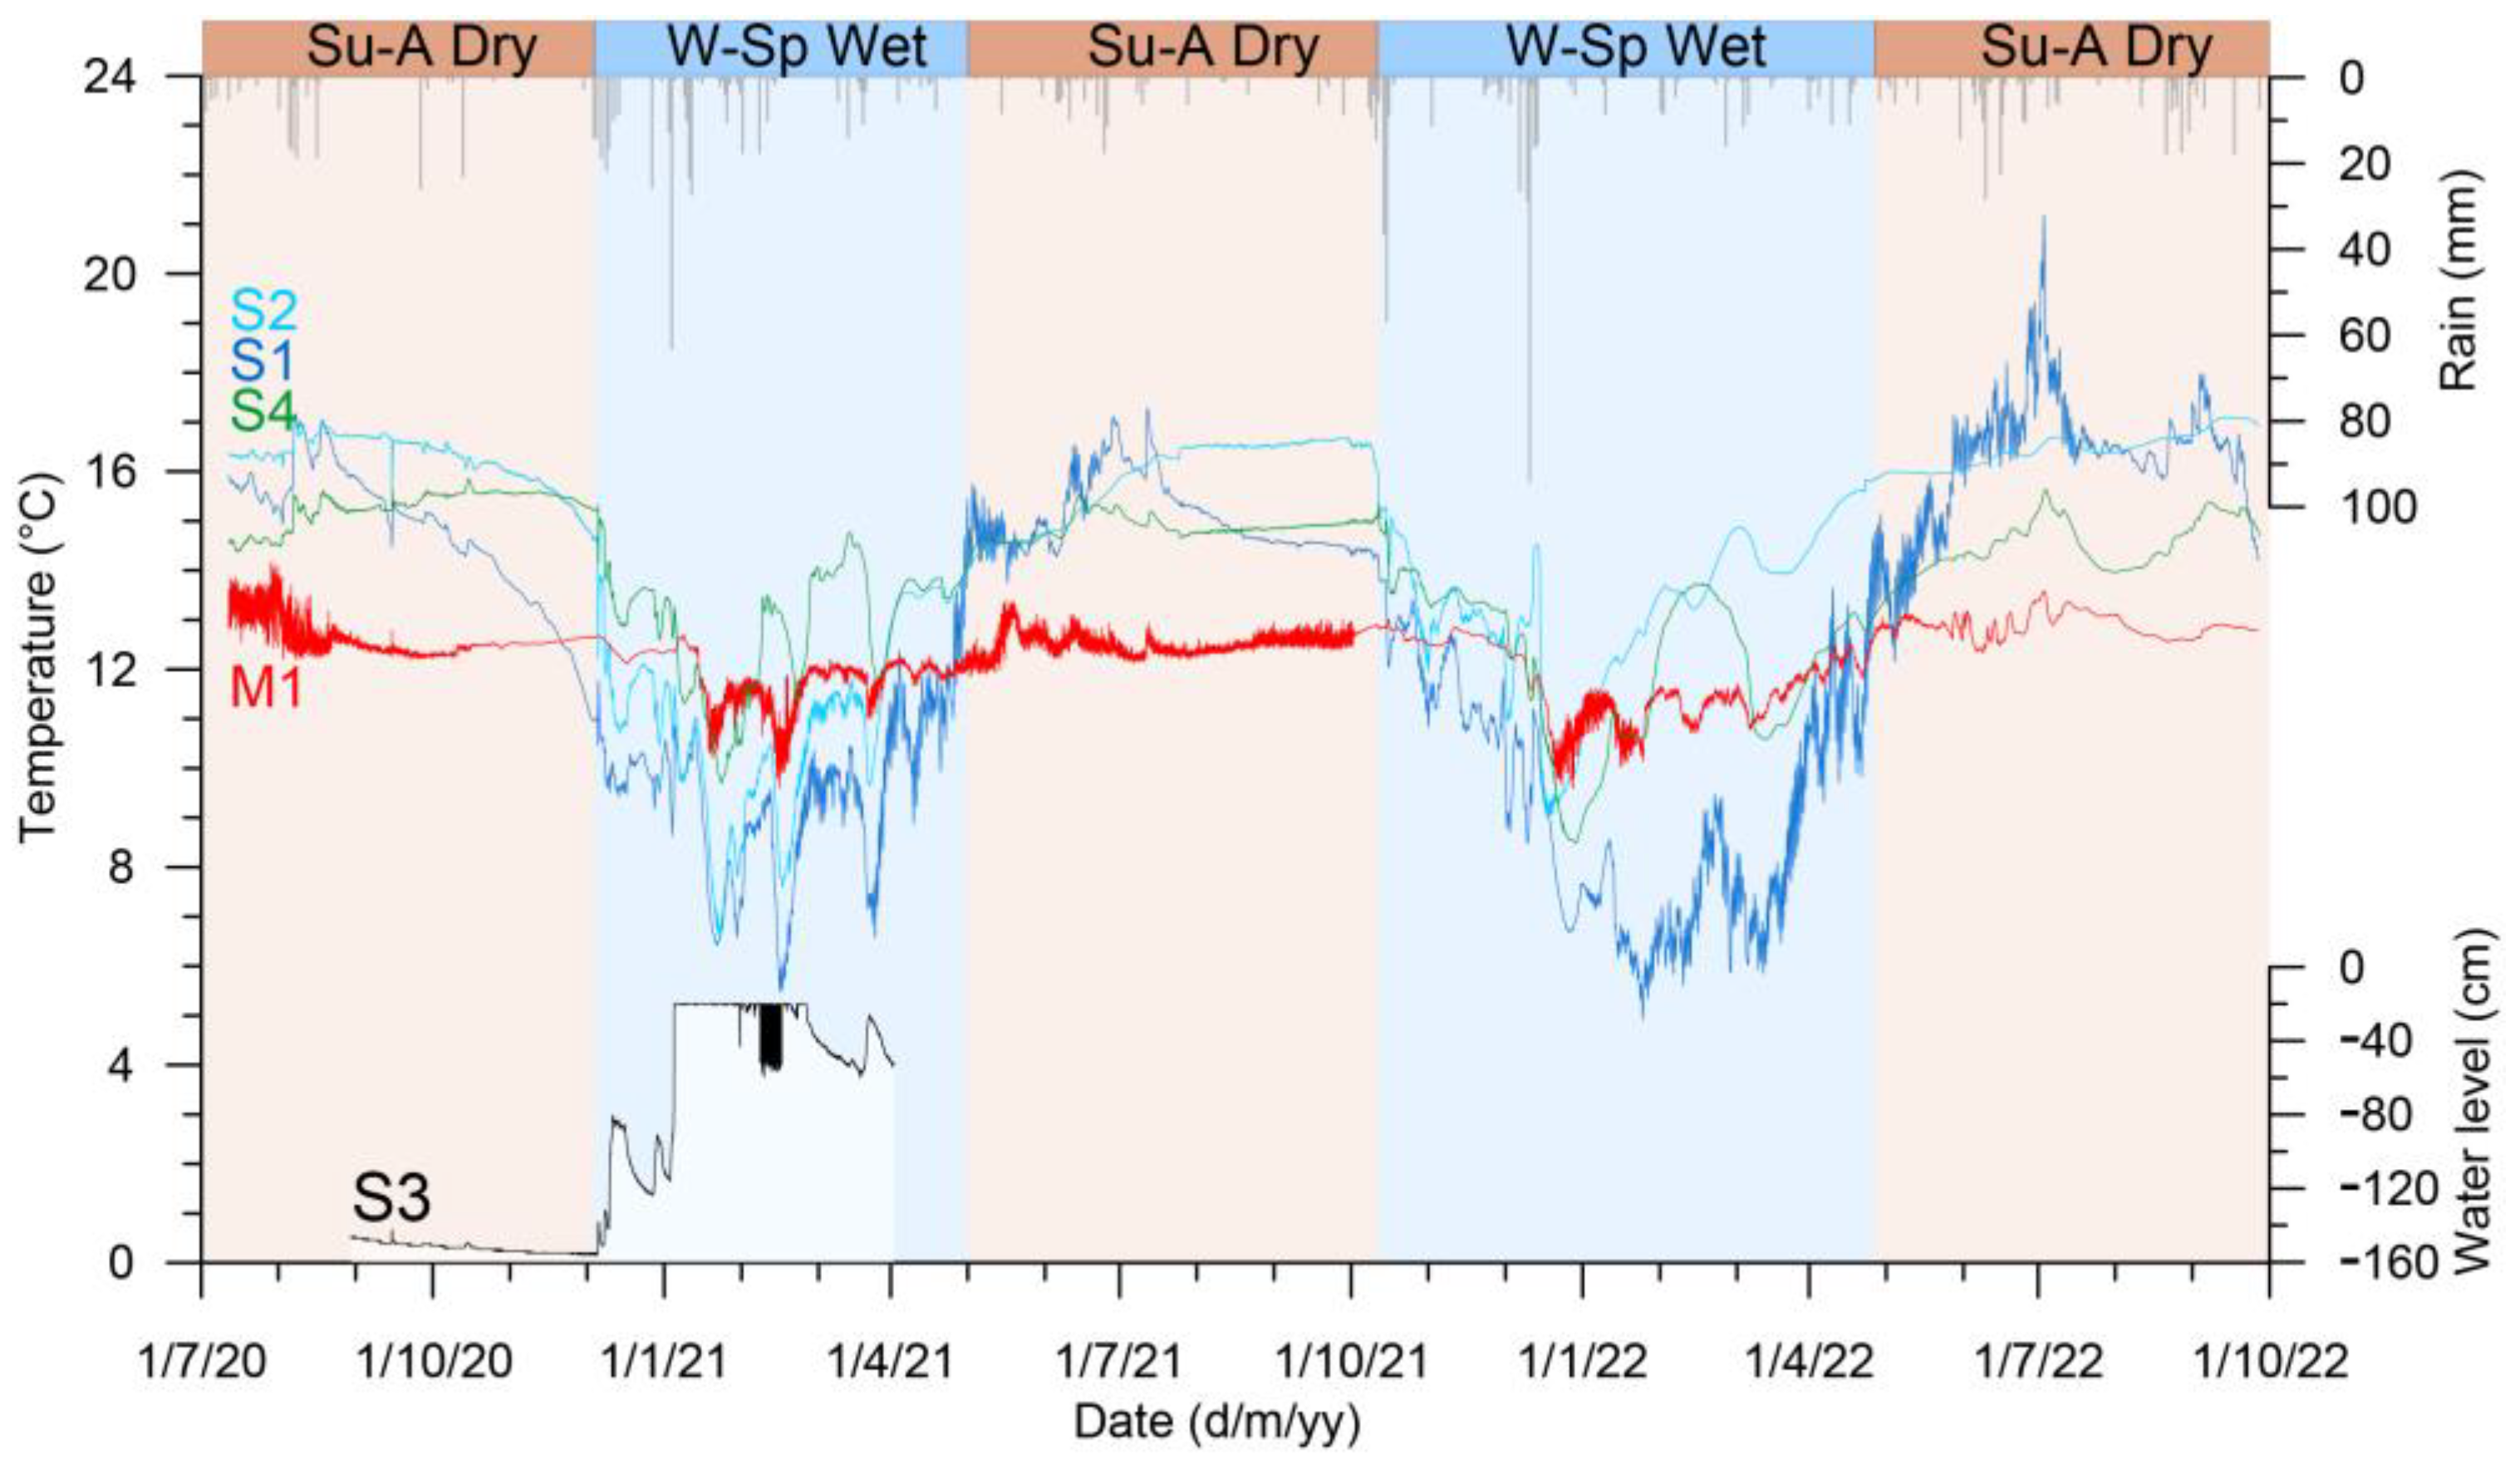
Figure 6.
The curves display the discrepancy in the thermal signal between the four main monitoring stations and their relation to flow changes. S2 (light blue) and S4 (green) show the temperature transformation along the main channel of Maaras with a sandy streambed. A significant temperature increase is evident in the late dry season and during flow recession in winter. Sensor S2 was buried in the streambed after the flood in December 2021, thus measuring the hyporheic flow in 2022. Sensor S4 may also have been slightly buried.

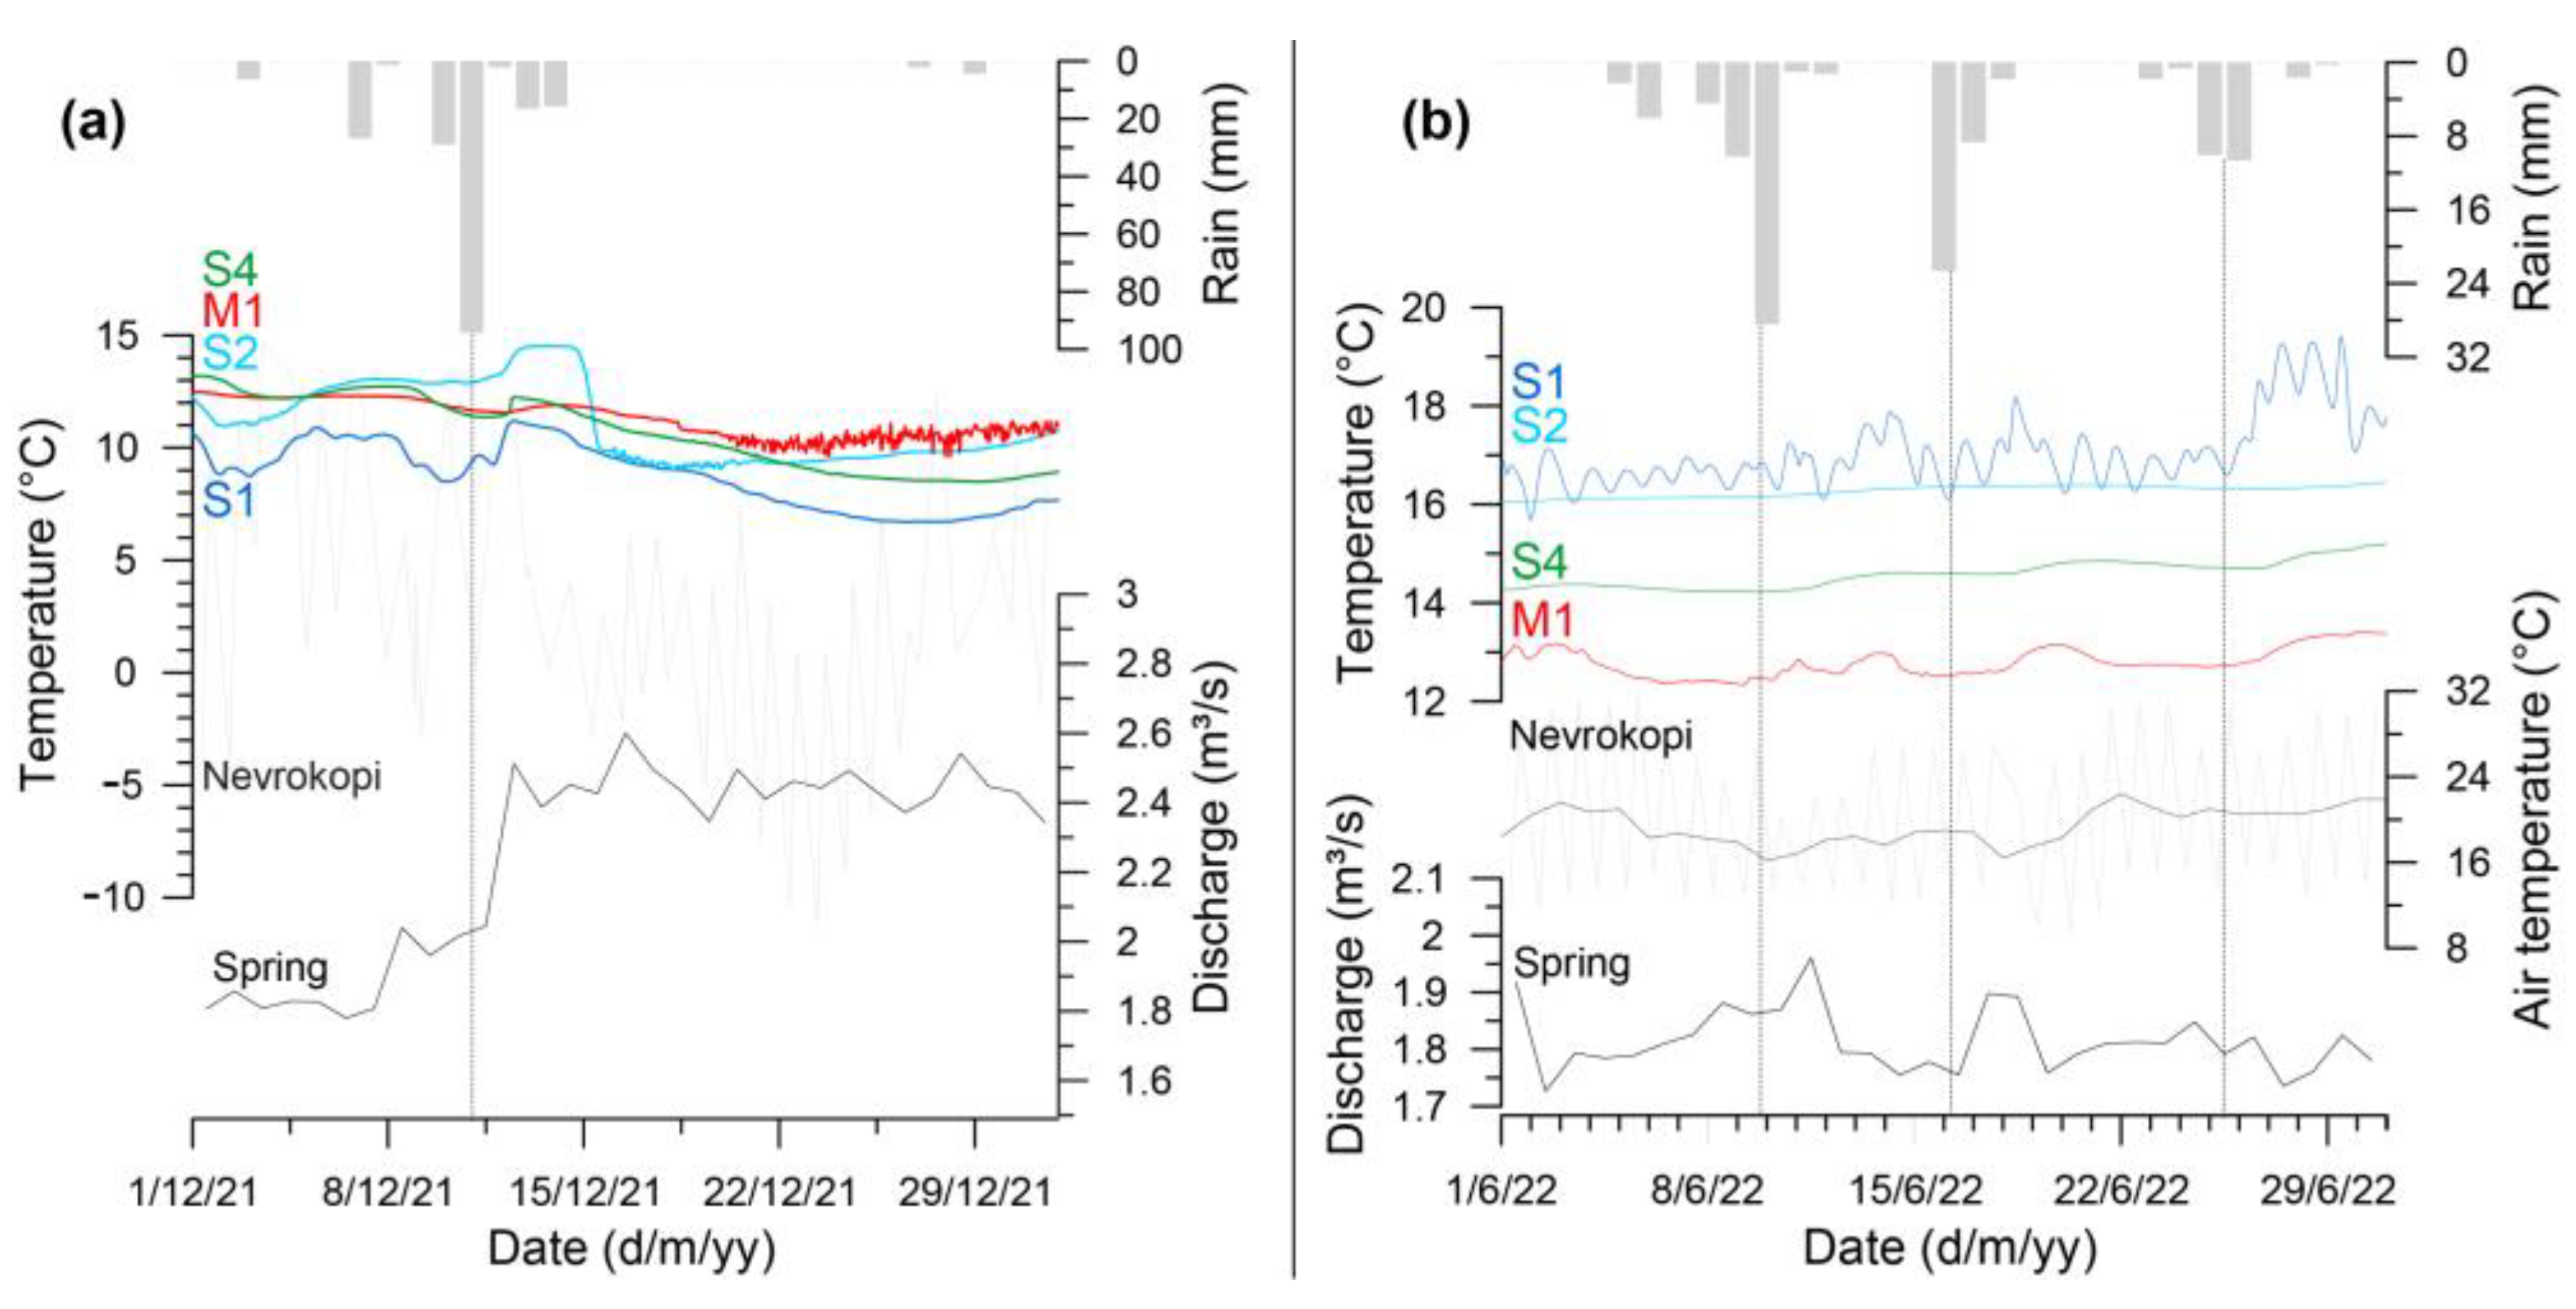
Figure 7.
Intense rainfall in December 2021 (a) and June 2022 (b) and the corresponding flood hydrograph from the spring and related response in thermographs of the different monitoring stations.
Figure 7.
Intense rainfall in December 2021 (a) and June 2022 (b) and the corresponding flood hydrograph from the spring and related response in thermographs of the different monitoring stations.

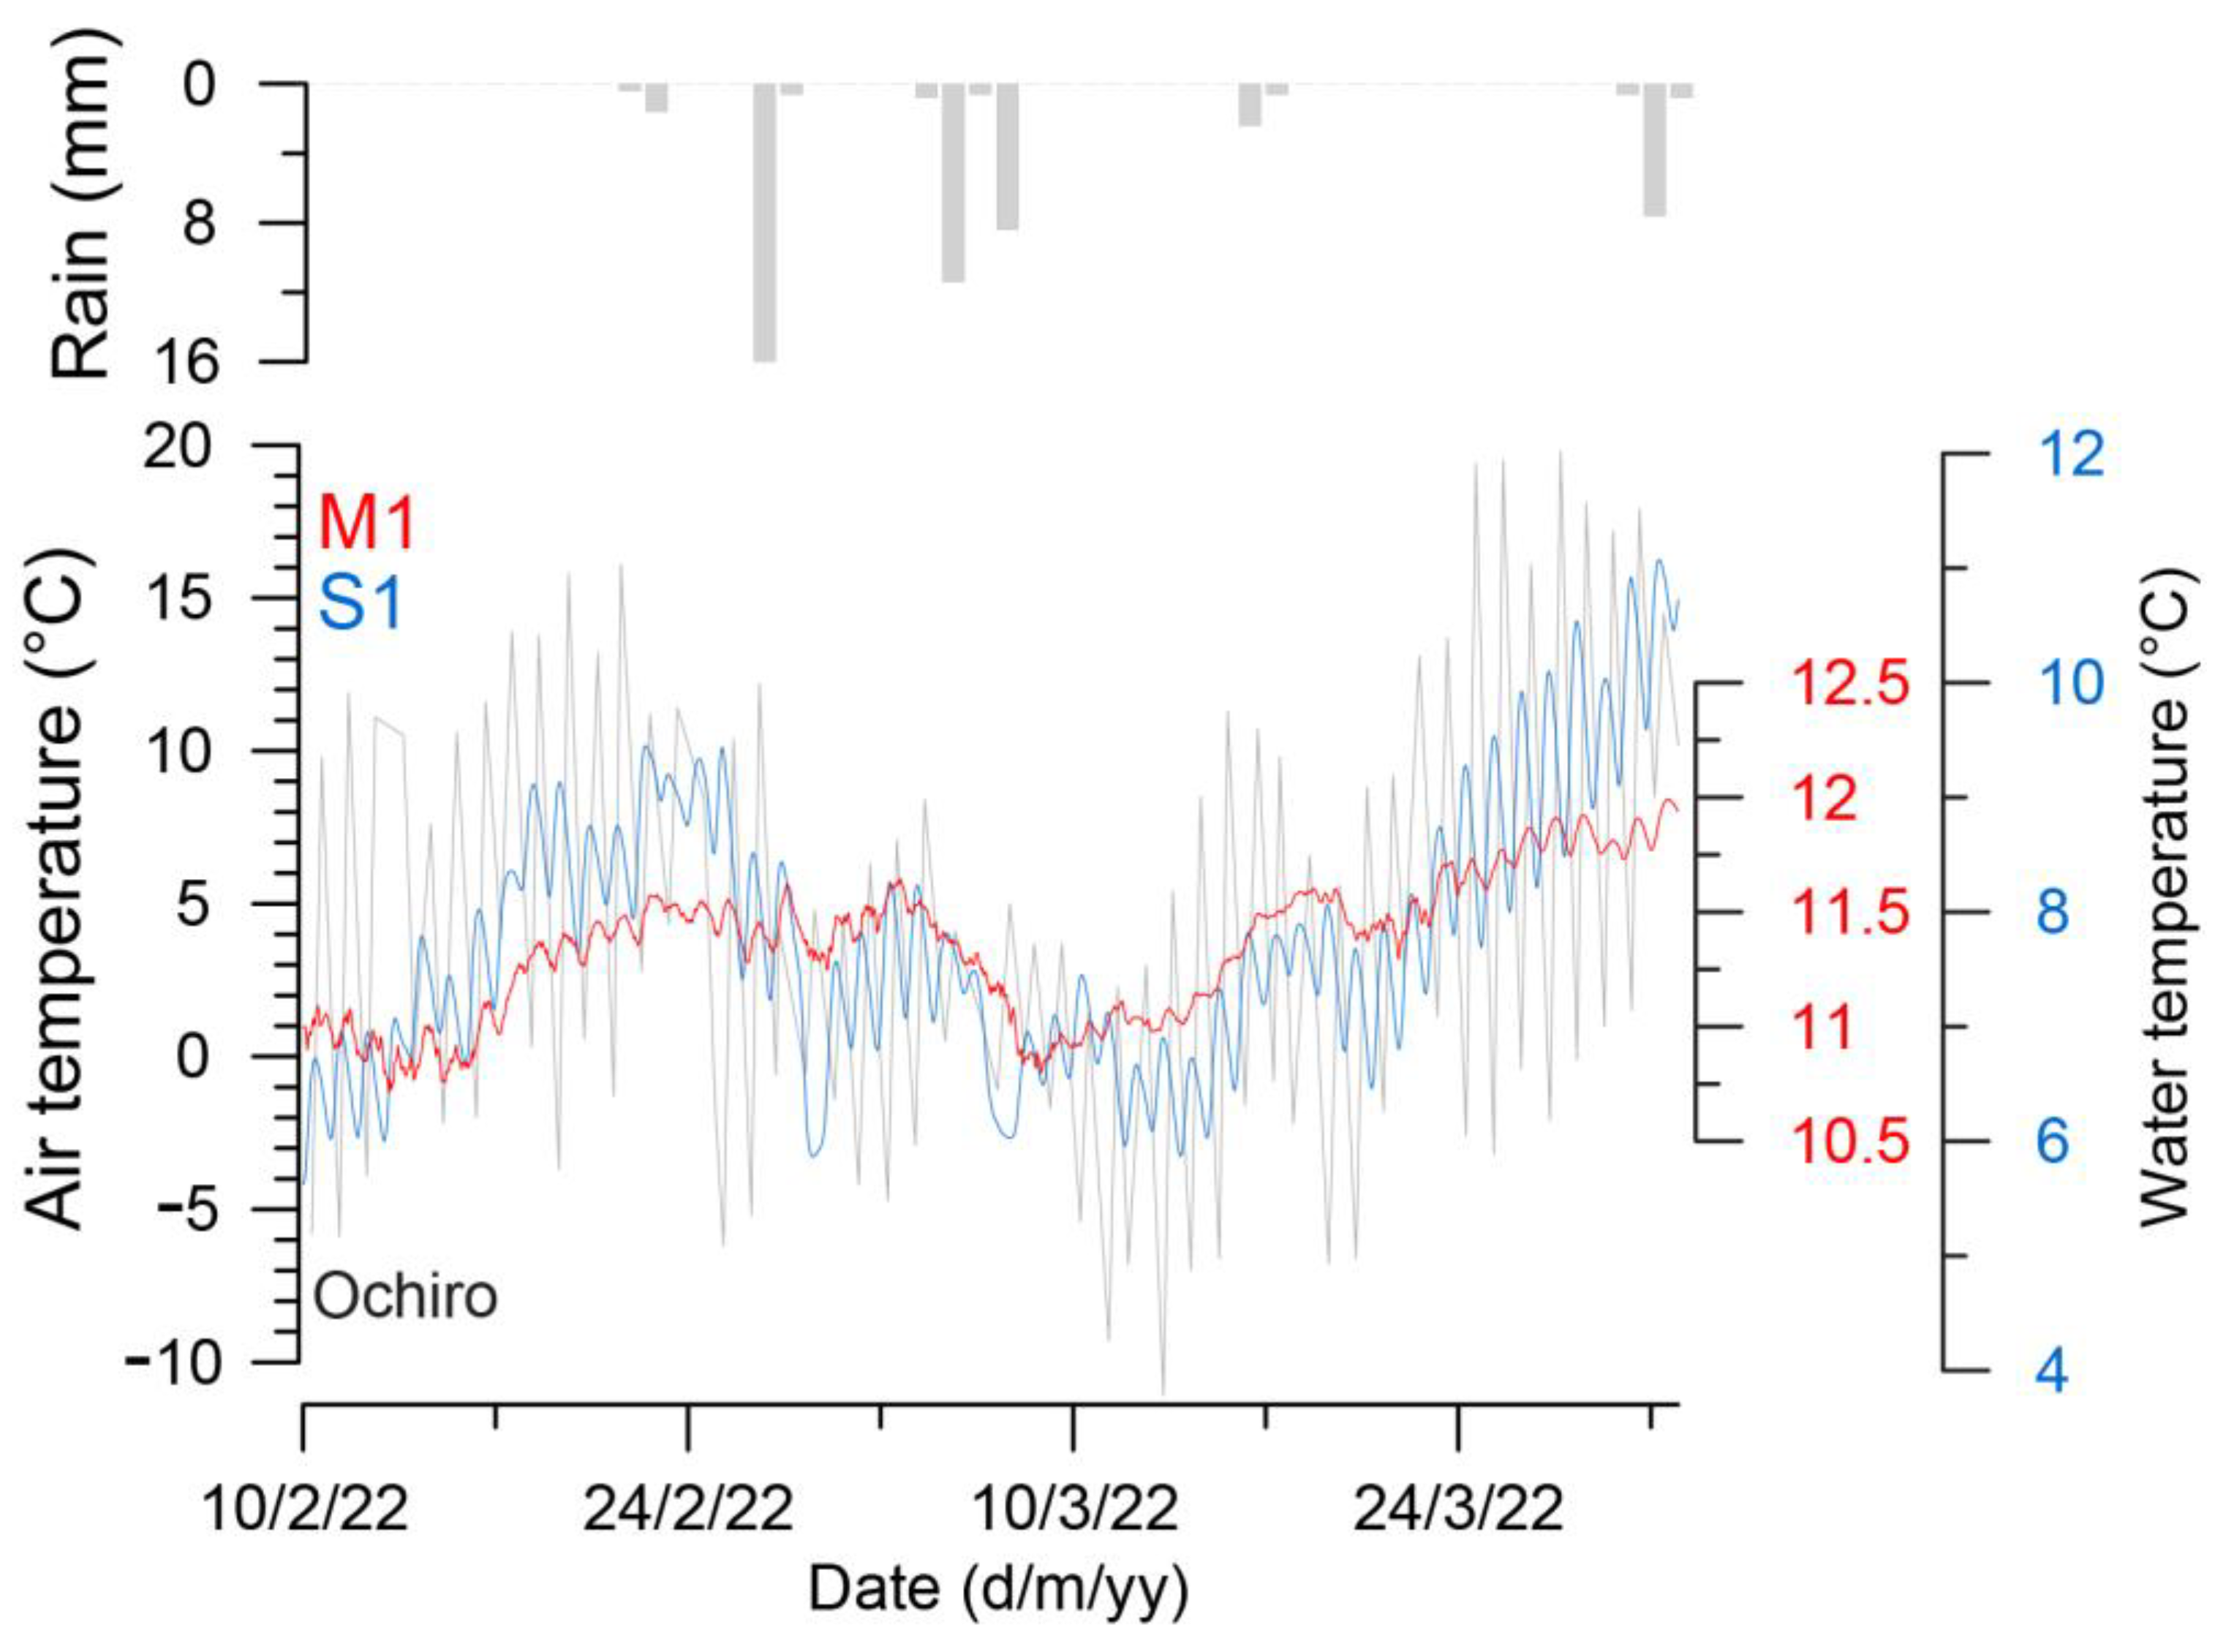
Figure 8.
Diurnal temperature fluctuations in station S1 and M1 in February and March 2022. Note that the temperature scales are different for the three curves.
Figure 8.
Diurnal temperature fluctuations in station S1 and M1 in February and March 2022. Note that the temperature scales are different for the three curves.

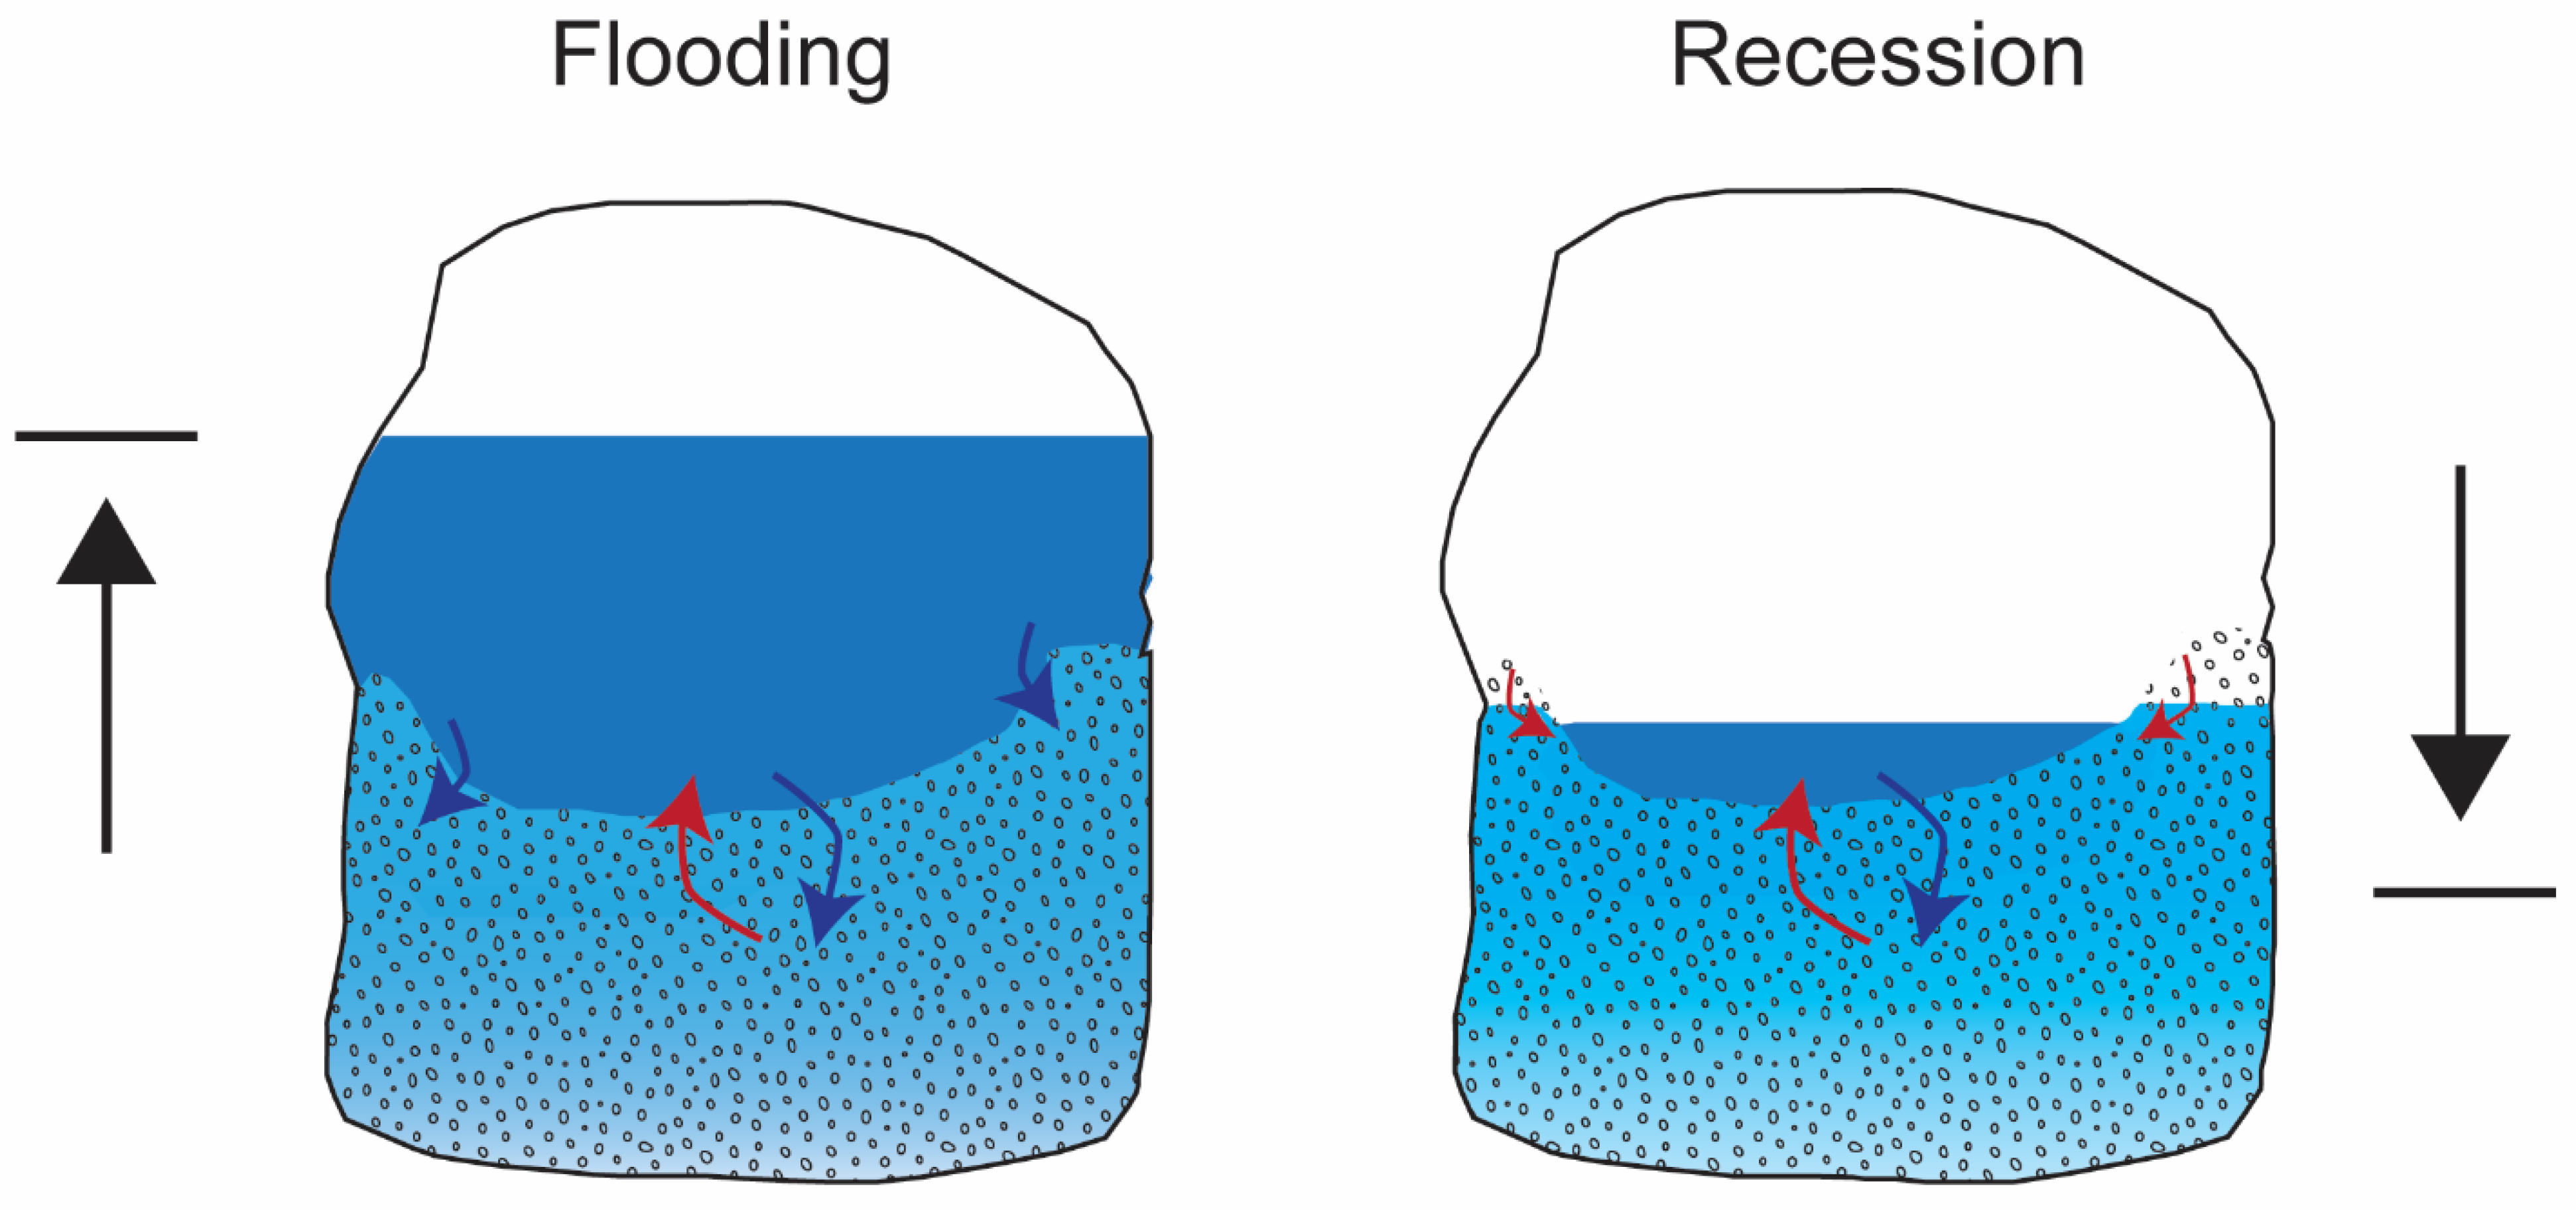
Figure 9.
Cross section of a Maaras cave conduit showing a conceptual model of how heat transfer functions during flooding and recession inside the cave. Red arrows show positive heat exchange while blue arrows indicate negative heat exchange.
Figure 9.
Cross section of a Maaras cave conduit showing a conceptual model of how heat transfer functions during flooding and recession inside the cave. Red arrows show positive heat exchange while blue arrows indicate negative heat exchange.


Table 1.
List of observation stations with elevation, distance to spring (along flow path), distance to the ponor (direct), and basic statistics for the recorded datasets and the mean annual water temperature (MAWT) and mean annual air temperature (MAAT) from the observation stations for two consecutive hydrological years from 1 September 2020–31 August 2022. Statistics for shorter records are in italics.
| Station | Elevation (m a.s.l.) | Direct Distance from Ponor (km) | Flow Distance to Spring (km) | MAAT/MAWT (°C) | σT (°C) | Tmax (°C) | Tmin (°C) | Tstable (°C) |
|---|---|---|---|---|---|---|---|---|
| Air Nevrokopi * | 585 | - | - | 11.4 | 8.3 | 39.1 | −15.7 | - |
| S1 | 182 | 4.95 | 6.7 | 12.5 | 3.4 | 21.2 | 4.9 | 14.5 |
| S2 | 181 | 6.4 | 3.68 | 14.3 | 2.4 | 17.1 | 6.5 | 16.6 |
| M1 | 180 | 6.48 | 3.6 | 12.2 | 0.7 | 14.2 | 9.6 | 12.6 |
| S3 ** | 177 | 7.14 | 2.5 | - | 1.8 | 13.8 | 7.0 | 13.4 |
| S3 air *** | - | 0.9 | 14.8 | 10.5 | 13.9 | |||
| S4 | 156 | 8.62 | 0.52 | 13.7 | 1.6 | 15.8 | 8.5 | 14.9 |
| S4 air **** | 13.3 | 1.3 | 14.5 | 8.9 | 14.5 | |||
| Air Aggitis spring ***** | 135 | 9.12 | 0 | 14.7 | 8.7 | 43.0 | −6.5 | - |
Note: * Average and σT are based on daily mean values. ** Seven months, 29 August 2020–2 April 2021. *** Four and a half months, 29 August 2020–14 January 2021. **** Twelve months 12 July 2020–24 July 2021. ***** One hydrological year, 1 September 2021–31 August 2022.
Disclaimer/Publisher’s Note: The statements, opinions and data contained in all publications are solely those of the individual author(s) and contributor(s) and not of MDPI and/or the editor(s). MDPI and/or the editor(s) disclaim responsibility for any injury to people or property resulting from any ideas, methods, instructions or products referred to in the content. |
© 2023 by the authors. Licensee MDPI, Basel, Switzerland. This article is an open access article distributed under the terms and conditions of the Creative Commons Attribution (CC BY) license (https://creativecommons.org/licenses/by/4.0/).
Share and Cite
MDPI and ACS Style
Skoglund, R.Ø.; Pennos, C.; Perşoiu, A.; Sotiriadis, Y. Karstic Aquifers—Simple or Hybrid Systems? Thermal Stories from Maaras Cave, Greece. Water 2023, 15, 488. https://doi.org/10.3390/w15030488
AMA Style
Skoglund RØ, Pennos C, Perşoiu A, Sotiriadis Y. Karstic Aquifers—Simple or Hybrid Systems? Thermal Stories from Maaras Cave, Greece. Water. 2023; 15(3):488. https://doi.org/10.3390/w15030488
Chicago/Turabian StyleSkoglund, Rannveig Øvrevik, Christos Pennos, Aurel Perşoiu, and Yorgos Sotiriadis. 2023. "Karstic Aquifers—Simple or Hybrid Systems? Thermal Stories from Maaras Cave, Greece" Water 15, no. 3: 488. https://doi.org/10.3390/w15030488
Note that from the first issue of 2016, this journal uses article numbers instead of page numbers. See further details here.