Assessment of Water Quality Along the Southeast Coast of India During COVID-19 Lockdown
 K. Vijay Prakash1
  Ch. S. Geetha Vimala2
  T. Preethi Latha3
  Chiranjivi Jayaram4
  P. V. Nagamani5*
  Ch. N. V. Laxmi2
- 1Department of Ocean Engineering, Indian Institute of Technology Madras, Chennai, India
- 2School of Spatial Information Technology, Jawaharlal Nehru Technological University, Kakinada, India
- 3Amaravathi Metropolitan Region Development Authority, Vijayawada, India
- 4Regional Remote Sensing Centre-East, National Remote Sensing Centre, Kolkata, India
- 5National Remote Sensing Centre, Hyderabad, India
The COVID-19 pandemic has affected the entire world and has had a devastating impact on both lives and livelihoods in India. The only way to defeat the rapid spread of COVID-19, is to shut down socio-economic activities and to maintain minimal human interaction with the implementation of a lockdown. Such lockdowns have manifested in a pollution curtailment in almost all spheres of the planet, including in marine pollution. Quantifying this decrease in pollution levels enables the scientific community to assess the contribution of anthropogenic (especially non-essential) activities to global/regional pollution levels. This paper aims to study the impact of the stringent lockdown period (phase 1 and 2) on coastal water quality along the Chennai coast of India, by analyzing suspended matter concentration (SPM), a key element of water quality and diffuse attenuation coefficient, Kd(490), using LANDSAT-8 Operational Land Imager (OLI) data. LANDSAT-8/OLI, L1TP scenes were subjected to radiometric calibration and atmospheric correction to derive surface reflectance values from raw digital numbers using ACOLITE software and a brief insight has been given for the Dark Spectrum Fitting algorithm used in ACOLITE. SPM concentration decreased by 15.48 and 37.50% in the Chennai and Ennore ports, respectively, due to minimal vessel movement and cargo handling. The stringent lockdown led to the operation of fewer thermal plant units, thus less fly ash was emanated, resulting in a 28.05% reduction in SPM levels over Ennore creek. As industrial and commercial activities subsided, the city’s water bodies became clearer than they were just a fortnight prior to the lockdown, with a reduction of 22.26% of SPM in Adyar and 33.97% in Cooum riverine estuaries. Decrease in Kd(490) showed a positive relationship with SPM and thus improved coastal water quality because of the reduction of SPM during this period. The variations in PM2.5 and PM10 concentrations were studied using National Air Quality Monitoring Programme (NAMP) data and reduced levels in particulate matter concentration (PM2.5 and PM10) for the Adyar residential area (24.38 and 28.43%) and for the Nungampakkam commercial area (36.09 and 67.18%) were observed. A significant reduction in PM2.5 concentration (45.63%) was observed in the Ennore-Manali Industrial region.
Introduction
COVID-19 has had an impact the entire world, and India has also felt this impact. The spread of COVID-19 has been so vast that the World Health Organization (WHO) declared it a pandemic and has designated it as medical emergency. To overcome the rapid and far-reaching spread of the disease, in the absence of proven medications, social distancing measures were put in place as the only way to minimize the human interaction. Inevitably, the country was put under lockdown. In this regard, the Indian Government took a strong stand against social life around the entire country starting in mid-March 2020. The prevalence of the pandemic, caused by the severe acute respiratory syndrome coronavirus 2 (SARS-CoV-2) named by International Committee on Taxonomy of Viruses (ICTV), continued to spread around the world and by mid-June 2020, around 213 countries has been affected. To date, more than 10 million cases of the virus infection have been reported worldwide, with the majority of fatalities being reported in the USA, Spain, and Italy (Worldometers.info, 2020).
Lockdown has substantially restricted public life in almost all sectors. There has been a cessation of aviation services, railways, including sub-urban electric trains and metro trains, buses, cars, and taxis with the exception of essential cargos. Other than services falling in the essential category, most industrial activities were suspended. The entertainment and hospitality industry, educational institutions, private and government offices, as well as religious and social gatherings were all placed under total lockdown.
Power generation in India decreased by as much as 26.5% during the country-wide lockdown, including a 33% decrease in coal-based power generation (Saraswat and Saraswat, 2020). The Scripps Institute of Oceanography estimated that fossil fuel consumption around the world will decline by about 10% due to COVID-19 (SCRIPPS, 2020). Since the activities of citizens and industries were shut down for weeks, the Air Quality Index (AQI) across major cities improved, particularly due to the reduction in NO2, PM10, and PM2.5 caused by vehicles and industry (Central Pollution Control Board-India, 2020; Laxmipriya and Narayanan, 2020; Navinya et al., 2020; Sharma et al., 2020). These environmental benefits are a result of the halting of industrial and economic activity and not because of proactive action to control pollution or to mitigate climate change. The lockdown also brought a unique opportunity to assess the effect of anthropogenic activities on air, water quality, and atmospheric greenhouse gas concentrations and its influence on global temperatures. Quantifying the pollution status in various spheres during the lockdown period is an important activity for researchers to understand the short and long-term effects the spread of COVID-19 might have on the climate.
Coastal regions are dynamic in nature because of river discharges, industrial effluents, ship traffic, dredging, waste dumping, and sewage disposal etc. Population growth, climate change and variability, and changing land use practices all contribute to the stress of coastal water quality. The anthropogenic activities along the coastal regions are major contributors to marine water pollution. Due to the shutdown of anthropogenic activities, improvements in coastal water quality (decrease in Suspended matter concentration) were observed along the west coast of India (Yunus et al., 2020) and in the Hooghly estuarine region in the northern Bay of Bengal (Jayaram et al., unpublished data). An attempt has been made to study the water pollution in the Chennai coastal waters during the COVID-19 lockdown period, through the water quality parameters. Ocean color remote sensing techniques are useful and adapted to perform spatio-temporal studies on coastal water quality. Water quality can be measured in terms of biological, physical, and chemical indicators such as turbidity, chlorophyll-a, algae (harmful and non-harmful), pollution-sediment, temperature, metals, dissolved oxygen, nutrients (primarily phosphorus and nitrogen), and many other contaminants.
This study mainly focused on the Suspended Particulate Matter (SPM) concentration derived from satellite remote sensing measurements. The term “suspended matter” does not apply to a single type of material, but to a whole family of materials with their own individual characteristics (Sathyendranath, 2000). These particulates include anything drifting or floating in the water, from sediment, silt, and sand to plankton and algae (Fondriest Environmental Inc, 2014). SPM concentration levels are largely governed by the pollution load from anthropogenic origin, especially in connection with coastal waters situated within reach of metropolitan/industrial cities. SPM has therefore been considered to assess the variation in pollution levels, i.e., water quality in Chennai coastal waters. In addition to SPM, diffuse attenuation coefficient Kd(490), an apparent optical property, also defines optical water quality (Kirk, 1988). It shows how strongly light intensity at a specified wavelength (490 nm) is attenuated within the water column and also indicates turbidity of the water column. It is directly related to the presence of scattering particles in the water column, either organic or inorganic, and is therefore an indication of water clarity. To assess the anticipated atmospheric fallout, reduction in particulate matter concentrations of PM2.5 and PM10 were also reported on during this lockdown period.
Study Area
Chennai (“The Detroit of India”), the metropolis of the Indian state of Tamil Nadu, is located on the Coromandel Coast off the Bay of Bengal (BoB), and has two major ports (Chennai and Ennore) and numerous coastal Industries. The study area is situated in between 80.25°E–80.50°E and 13°N–13.35°N, as shown in Figure 1. Littoral regions are of great concern, due to the fact that they are not only the most productive areas but also hot spots of pollution. Massive populations and the congregation of industries in Chennai are impairing the rivers of Kosasthalaiyar, Cooum, and Adyar by ceaseless depositing of treated/untreated sewage. These rivers ultimately discharge into BoB. Dumping of dredged material is a major threat to Ennore Creek (EC), which further leads to the blockage of water flow. This creek receives wastewater, which includes treated effluents and untreated wastewater from industrial sources in Ennore-Manali areas. The two power plants in Chennai (Kalpakkam and Ennore) emanate thermal effluents into the sea, which leads to a rise in temperature levels over several square kilometers. In addition to this, direct dumping of waste as well as harbor activities such as dredging, cargo handling, ship traffic, oil spillages etc., also accompany the marine pollution. All of this waste discharge results in ecological changes including a marginal decrease in dissolved oxygen, pH, and primary productivity (Ramesh et al., 2008). The sites that are prone to marine pollution, such as the ports of Chennai and Ennore, the river mouths of Kosasthalaiyar (Ennore creek), Cooum, and Adyar were therefore considered in this study (Gowri and Ramachandran, 2001; Shanmugam et al., 2007).
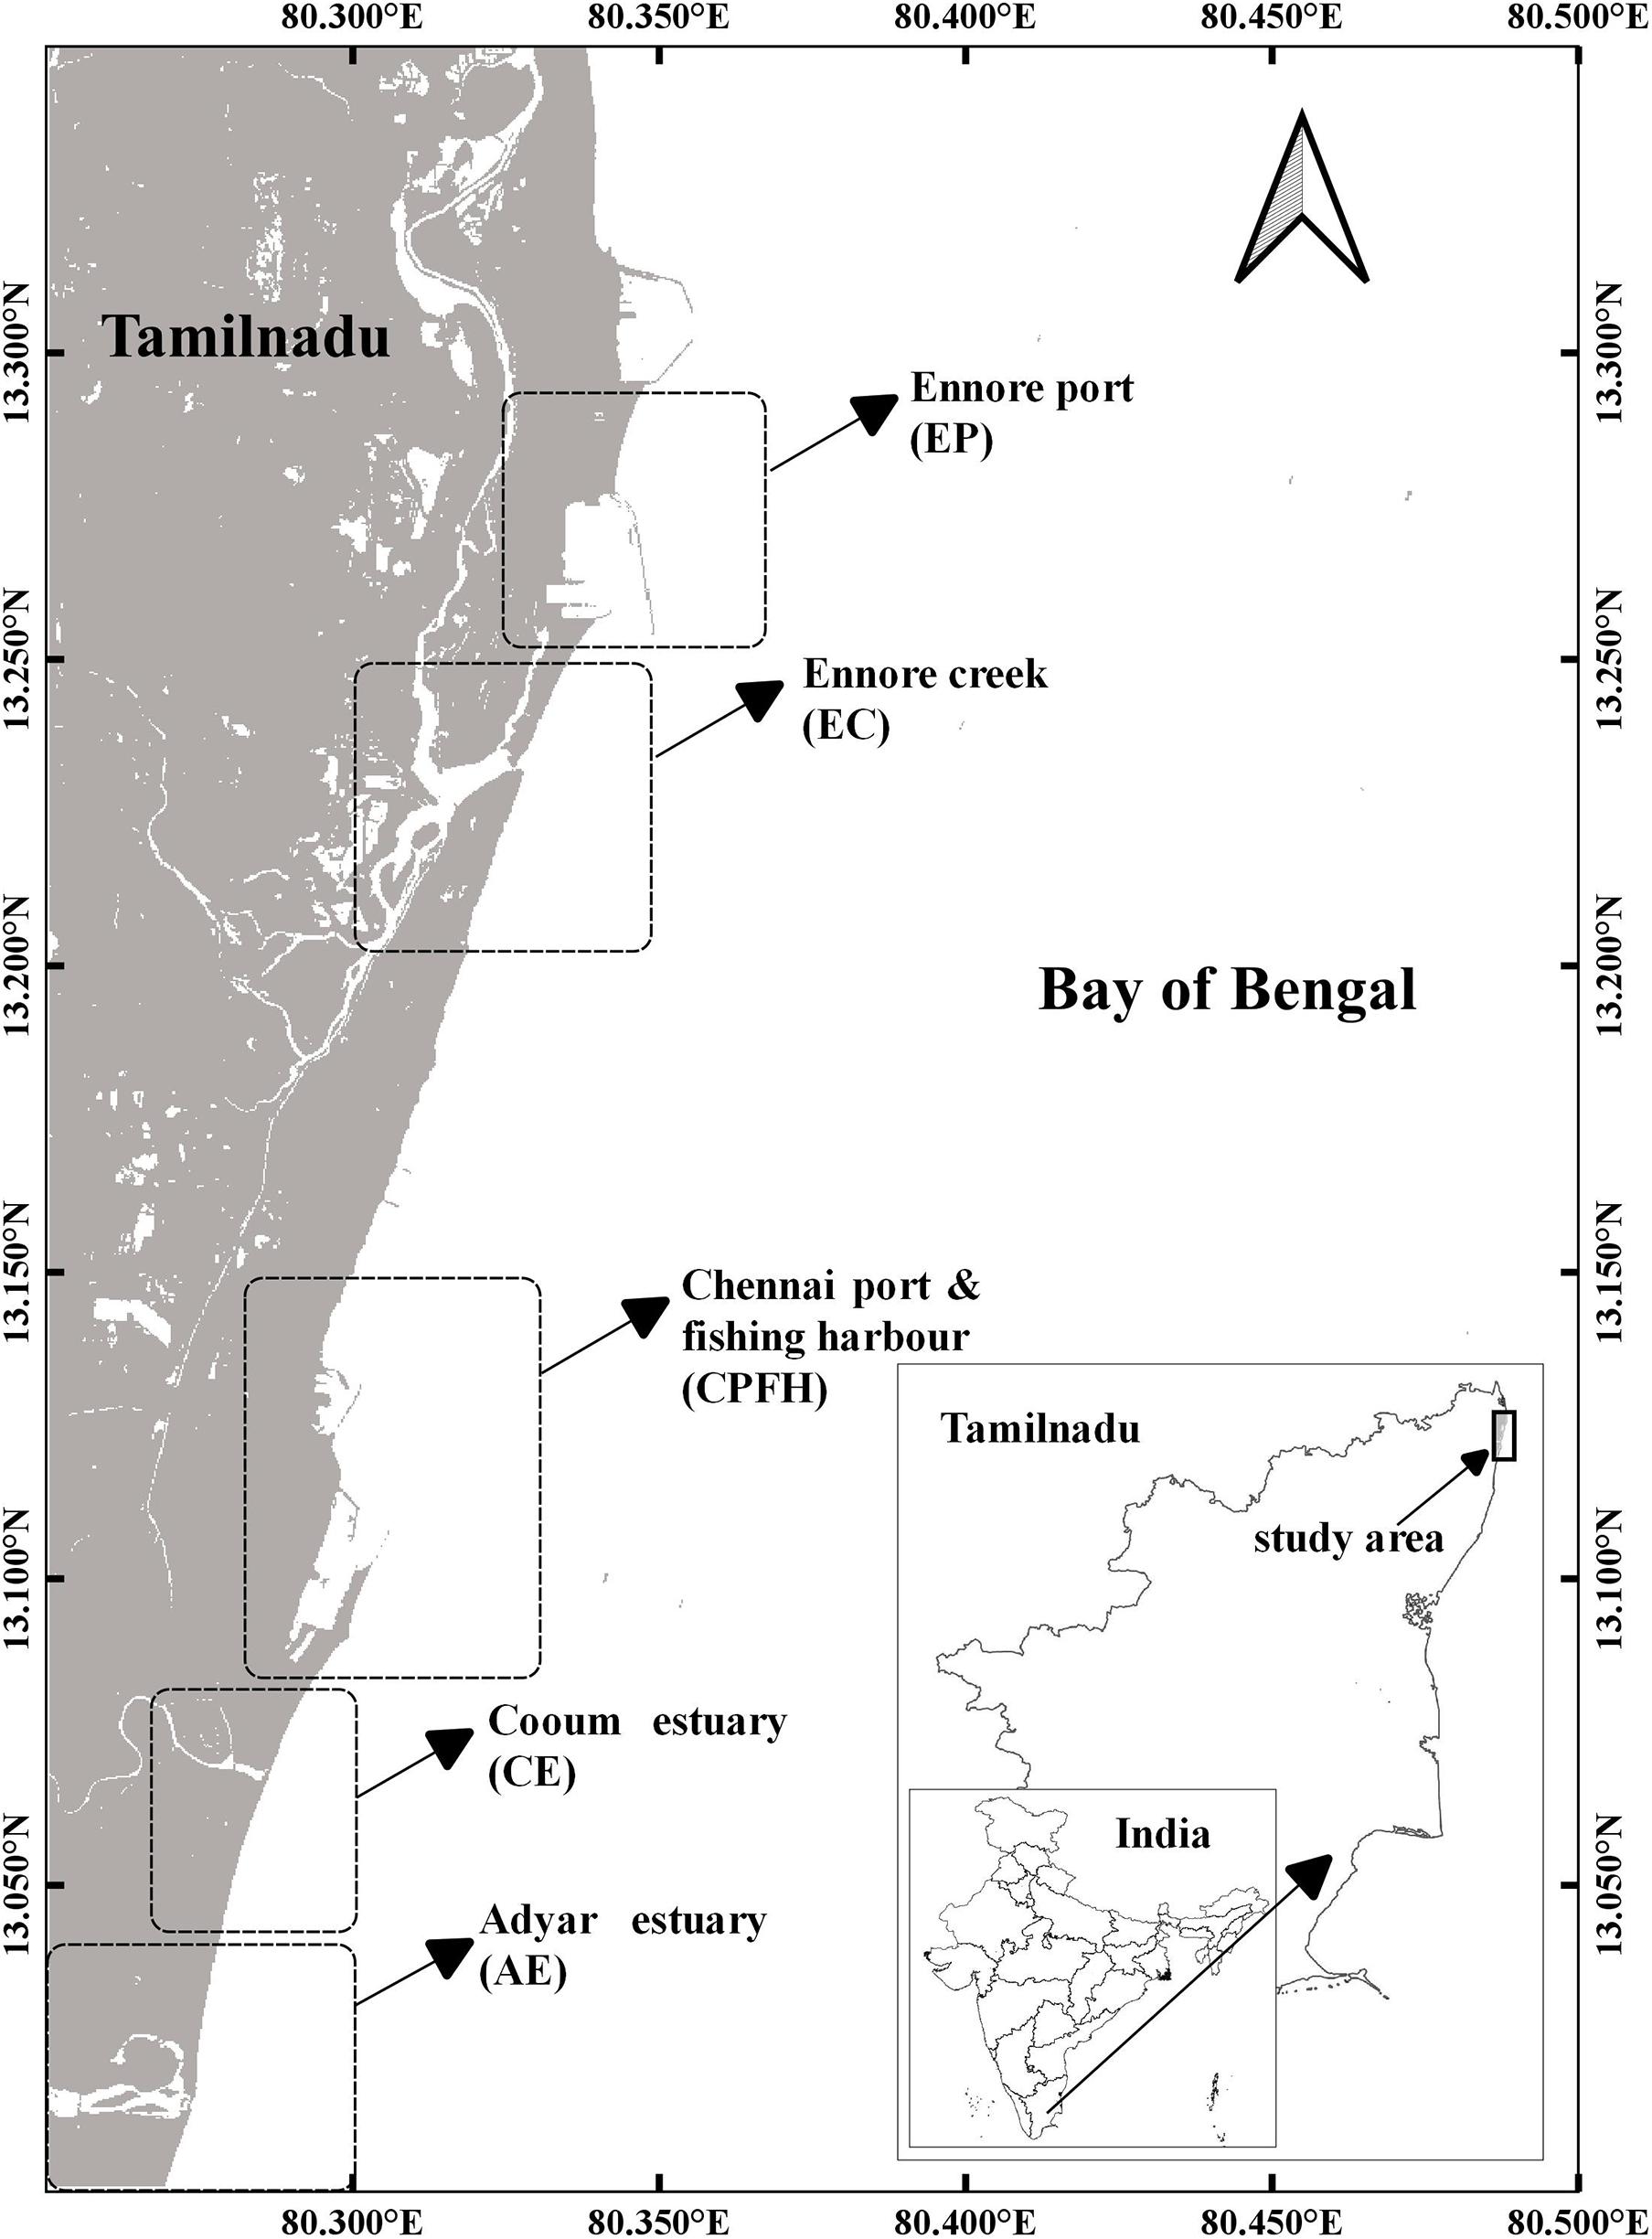
Figure 1. Study area and prominent regions prone to marine pollution along the Chennai coast.
The Chennai coast is characterized by a semi-diurnal tide with a maximum ∼1.2 m tidal range (Mishra et al., 2015). The mixing and sediment transport phenomena are highly dependent on tidal ebbing and flooding conditions (Kalaivani and Krishnaveni, 2015). Sediment transport is northerly from April to October and southerly from November to March. The sediment transport rate is high throughout the year, with a maximum of about 2 × 10⁵ m3 per month in June and a minimum of about 0.7 × 10⁵ m3 per month in March (Chandramohan et al., 1990). Mishra et al. (2015) conducted field campaigns along the Chennai coast (January 2013–December 2014) and reported SPM concentration ranges in between 11 and 160.5 g m–3 with a mean value of 34.8 g m–3 in the dry season (January–June).
Data and Methodology
Data
Landsat-8/OLI has spectral bands with central wavelengths close to that of dedicated ocean color sensors. The resolution of current ocean color sensors is one of the key limiting factors for water quality applications in near-shore regions, as they are unable to accurately resolve coastal ocean characteristics (Mouw et al., 2015). Optical sensor OLI has native spatial resolution of 30 m and is therefore better suited to resolve detailed features of SPM in the near-shore region compared to conventional ocean color sensors. Additionally, improved sensor signal-to-noise ratio and radiometric resolution of OLI, permits the application of this land-designed sensor for marine applications (Trinh et al., 2017). It provides the capability to optically map active components of the upper water column in inland and coastal waters with minimized coastal contamination. These characteristics indicate that Landsat-8/OLI images are suitable and were found to provide appropriate data for retrieval, estimation, and monitoring of water quality parameters on a regional scale (Lim and Choi, 2015; Vanhellemont and Ruddick, 2015; Wei et al., 2018). However, Landsat-8/OLI data may not be advisable when studying extremely dynamic and large-scale features due to its low temporal resolution and synoptic coverage compared to MODIS, AVHRR, VIIRS etc. To study the impact different phases of lockdown (Supplementary Table 1) had on water quality along the Chennai coast, April (stringent lockdown period) was chosen and Landsat-8/OLI instrument L1TP (Level 1 and Terrain Precision) scenes of path/row-142/051 were downloaded from NASA’s USGS Earth-Explorer website for the period of 2013–2020.
Pre-processing
Landsat-8/OLI, L1TP scenes were subjected to radiometric calibration and atmospheric correction to derive surface reflectance values from raw digital numbers using the ACOLITE package, developed by the Royal Belgian Institute of Natural Sciences (Vanhellemont and Ruddick, 2018). It is an image-based Atmospheric Correction algorithm that estimates radiance by correcting for molecular and aerosol scattering in the atmosphere using the Gordon and Wang (1994) approach. Molecular reflectance correction, based on viewing and illumination geometries, is performed with a 6SV-based look-up table.
ACOLITE employs the Dark Spectrum Fitting (DSF) algorithm (Vanhellemont and Ruddick, 2018; Vanhellemont, 2019) for atmospheric correction. The DSF algorithm considers the atmosphere as homogenous and estimates atmospheric path reflectance by assuming approximate zero water-leaving radiance for the pixels, in at least one of the sensor bands of the scene. Figure 2 provides a brief insight into DSF aerosol correction. The aerosol model and best fitting band combination, which gives the lowest RMSD between observed dark spectrum (ρdark) and estimated atmospheric path reflectance (ρpath), is selected for the atmospheric correction. ACOLITE performs glint correction to obtain glint-free surface reflectance by estimating sun glint reflectance from the SWIR bands, significantly improving the data availability for this nadir viewing sensor (Harmel et al., 2018; Vanhellemont, 2019).
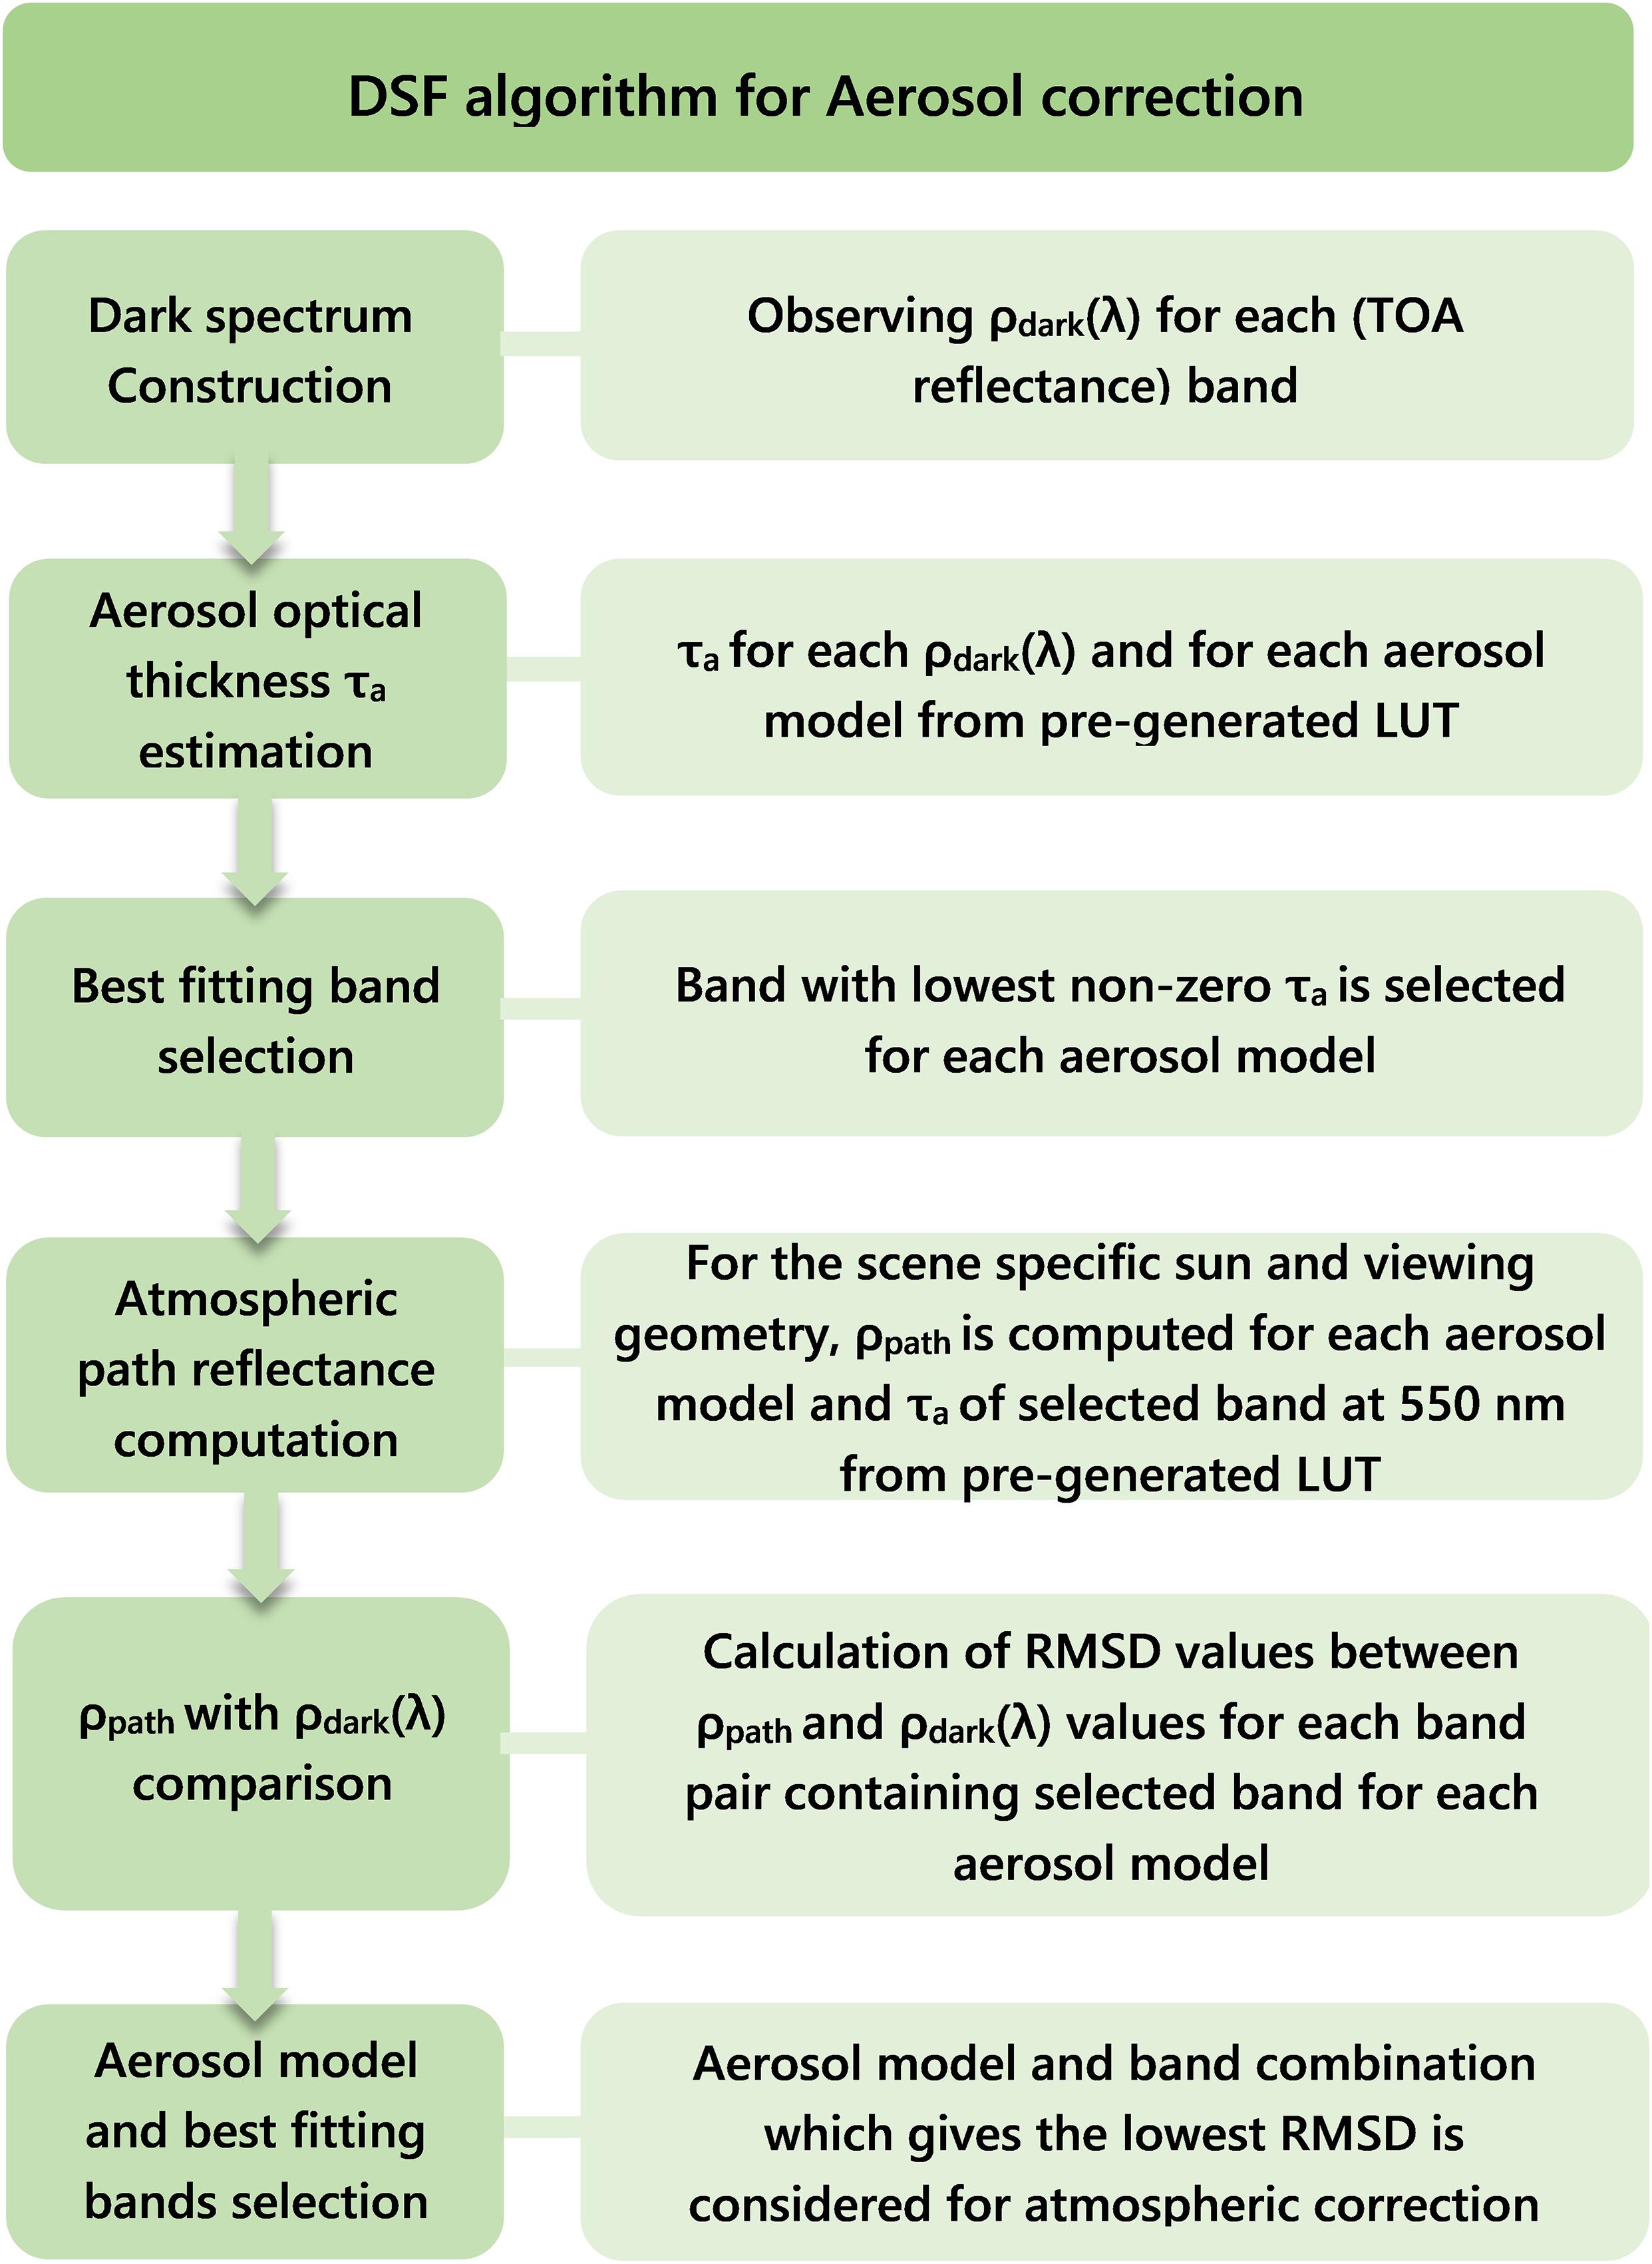
Figure 2. Flow chart representing aerosol correction procedure in DSF algorithm.
SPM Retrieval
SPM plays a vital role in Primary production, pollutant transport, and other biogeochemical processes in coastal marine environments (Kravchishina et al., 2018). Curran et al. (1987) and Novo et al. (1989) investigated the form of the relationship between SPM and water-leaving reflectance in coastal waters and showed that single band algorithms may be adopted where SPM increases with increasing reflectance. Ahn et al. (2001) pointed out that single bands at longer wavelengths in visible portions are highly useful for deriving SPM concentrations in turbid waters. After performing the atmospheric correction for the scenes, to retrieve the suspended particulate matter (SPM), a generic multi-sensor SPM algorithm for turbid waters developed by Nechad et al. (2010) was adapted for this study. The algorithm is based on a reflectance model (Gordon et al., 1988) and is calibrated using in-situ reflectance and SPM measurements made over the southern North Sea area from 2001 to 2006. Nechad et al. (2010) proposed an algorithm based on Inherent Optical Properties (IOP) for turbid waters (case 2 waters). SPM is related to the ratio of total backscattering (bb) to total absorption (a). Assumptions made in this algorithm derivation are that particulate backscattering (bbp) and particulate absorption are proportional to the SPM concentration, that spatio-temporal variability of non-particulate absorption (anp) is negligible, and that non-particulate back-scattering is zero.
ρw is the water-leaving reflectance which can be derived from the remote sensing reflectance (Rrs), ρw = πRrs. Aρ is obtained from a non-linear regression analysis using in-situ reflectance and SPM data and Cρ is calibrated using standard IOP data (Mobley, 1994; Babin et al.,2003a,b; Lubac and Loisel, 2007). For Ladsat-8 data, Rrs at red band (central wavelength = 655nm) is used for SPM retrieval. Generic coefficients (corresponding to 655nm) were taken from Table 1 and Table 4 of Nechad et al. (2010), Aρ = 289.29 and Cρ = 0.1686. Mathematical formulations for these calibration coefficients are given below,
Where A and C are calibration parameters, and b^*bp and a^*p are SPM specific particulate backscattering and absorption, respectively. R is the constant and represents reflection and refraction effects at the sea surface = 0.529 (Morel and Gentili, 1996), f’ is a varying dimensionless factor (Morel and Gentili, 1991) and Q is the ratio of subsurface upwelling irradiance to the subsurface upwelling radiance. f’/Q = 0.13 for sediment-dominated waters (Loisel and Morel, 2001).
Kd(490) Retrieval
Diffuse attenuation coefficient (Kd) has strong relationship with IOPs such as absorption coefficient (a) (Smith and Baker, 1981; Lee et al., 2002; Lee et al., 2005; Lee et al., 2015) and back scattering coefficient (bb) (Gordon et al., 1988; Lee et al., 2002; Sun et al., 2014). A semi analytical approach developed by Lee et al. (2002), and a Quasi Analytical Algorithm (QAA) has been adapted to redeem Kd(490) for this study. Kd(490) retrieval involves calculation of a(490) and bb(490) by analytically inverting remote sensing reflectance (Lee et al., 2005). These IOPs are further used to calculate Kd(490) from the Eq. 3.
Where m0 = 1 + 0.005θa, θa is the solar zenith angle in air. The values for model constants m1, m2, and m3 are 4.18, 0.52, and 10.8, respectively (Lee et al., 2005). These values remain constant for different waters and different wavelengths and it is to be noted that a and bb changes with water mass and wavelength, as well as with solar zenith angle.
Results and Discussion
The long-term mean was calculated using L8 scenes of April (2013–20) and April-2020 (2nd & 18th, April-2020) scenes were used to compute mean values for the stringent lockdown period. Negative anomalies were observed in the majority of locations/pixels in all prominent regions of the study area. Mean, percentage, and root mean square differences (RMSD) were computed. The entire region was considered while computing mean differences and their percentages, whereas pixels with negative anomalies were isolated and computed RMSDs for those pixels.
Variation in Suspended Particulate Matter
The potential variances in SPM concentration, are either due to anthropogenic activities or biogeochemical processes taking place in the system (Kuppusamy and Giridhar, 2006). The seasonal and biogeochemical processes remained the same whereas anthropogenic activities were shut down (exemption was given to essential services) during the COVID-19 lockdown. Delineating the contribution of anthropogenic activities to SPM levels has therefore been assessed in this study. An anticipated decrease of SPM concentration is clearly observed in all prominent regions of the study area and their corresponding statistical inferences are presented in Table 1.
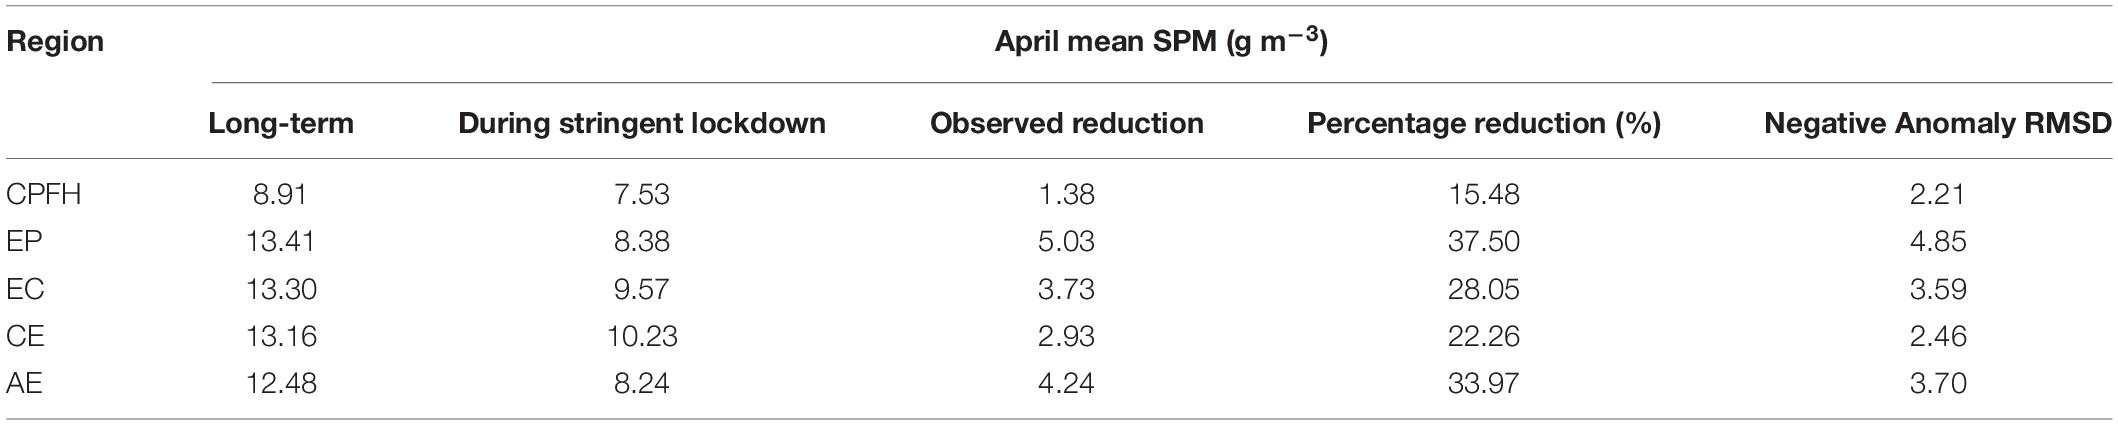
Table 1. Statistical parameters of SPM for all prominent regions in the study area.
The statistics revealed by the Chennai port (Chennai Port—Tamil Nadu, 2020) says that, there was a 40% decrease in cargo handled and a 36% decrease in vessel traffic during April 2020 (Supplementary Figure 1). Fishing activities were completely paused due to the absence of ice and because of the workforce being in lockdown (ThePrint, 2020). It was observed that SPM concentration at the CPFH region decreased about 15.48% (refer Table 1). The Ennore port handled 3228 kilotons of cargo, which is much less compared to Chennai port during the months of April and May 2020. Due to this, SPM concentration during the stringent lockdown period at EP drastically reduced by 37.5% (refer to Table 1). It was noticed that the pause in port and fishing activities contrived the coastal water quality (refer to Figure 3).
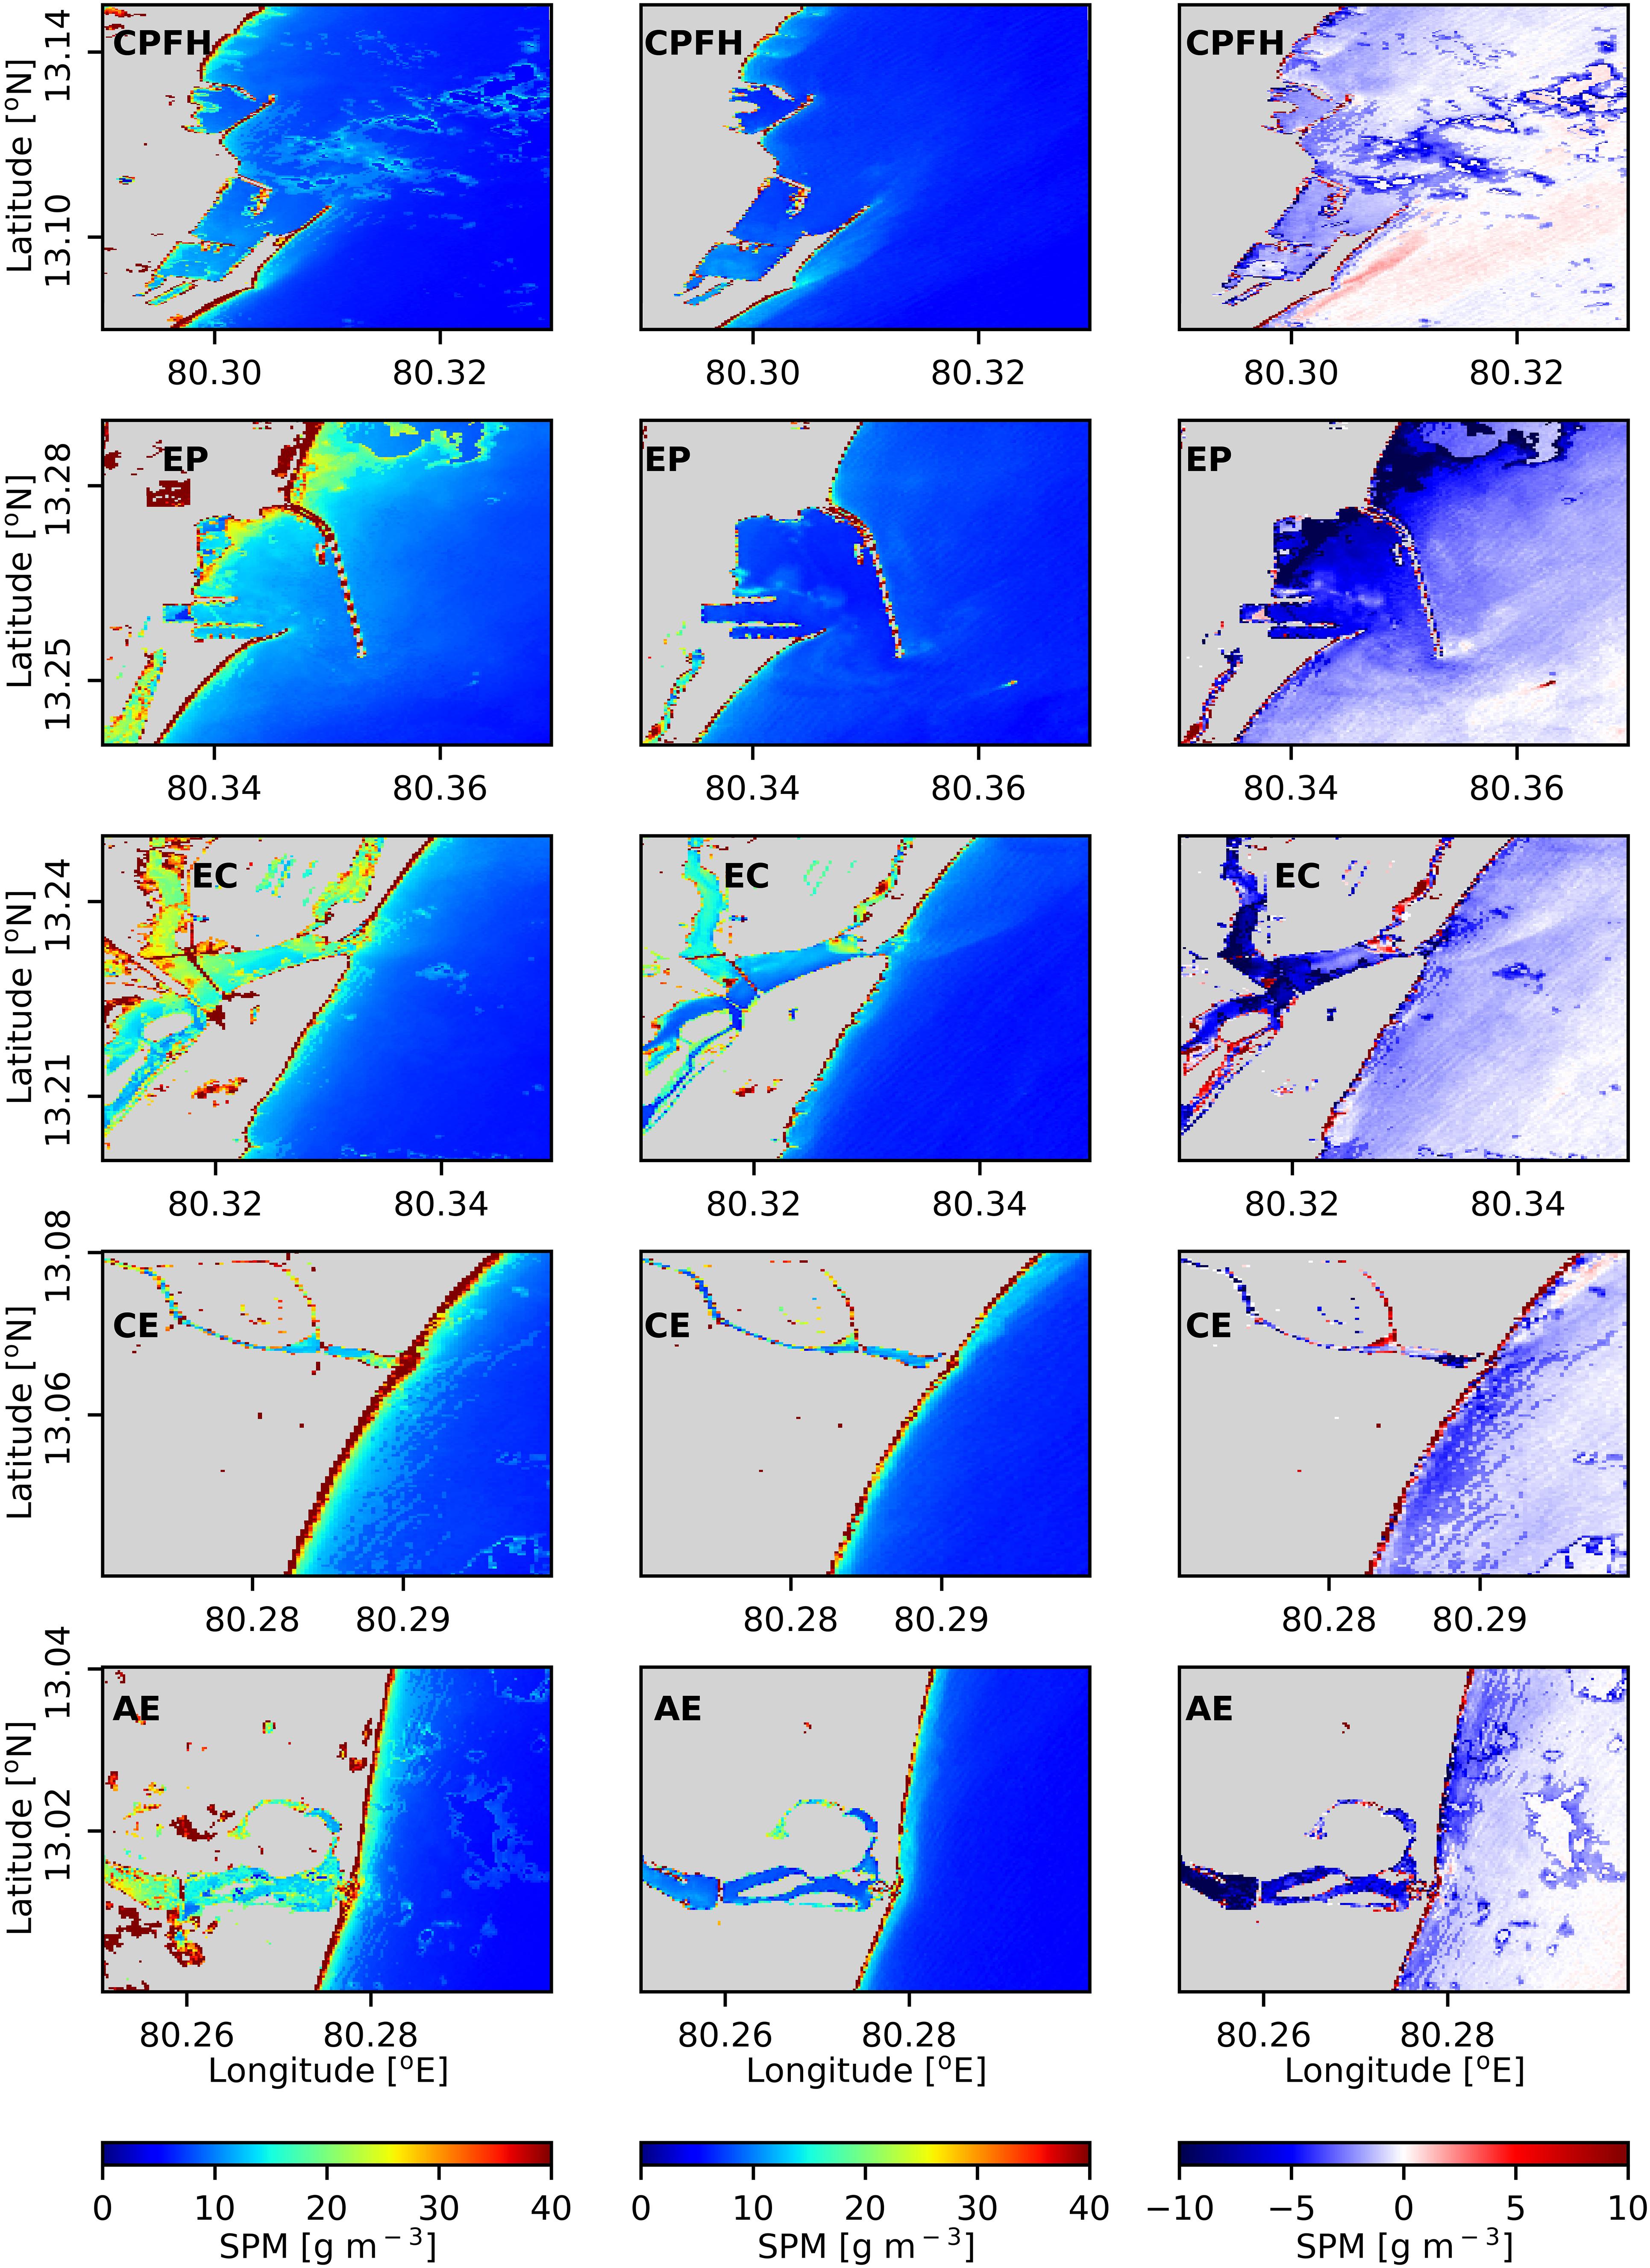
Figure 3. Long-term (left), April 2020 (middle), and April 2020 anomaly (right) mean distributions of SPM over prominent regions in the study area.
The Tamil Nadu State’s peak electricity demand plummeted with the shutdown of commercial and industrial units and led to a drastic drop (about 30%) in power demand. All of these factors led to a reduction in SPM of around 28.05% over EC (refer to Table 1 and Figure 3). As industrial and commercial activities subsided during the lockdown period, the city’s water bodies became clearer than they were just a fort-night prior to the lockdown, with no industrial effluents flowing in from closed factories. The Adyar river now carries 70 cusecs of relatively clean water and no froth has been noticed anywhere along the river due to the absence of chemicals. The flow of 60 cusecs of gray water from the units has now come down to 10 cusecs (The Times of India, 2020) and SPM concentrations were decreased by 22.26 and 33.97% at CE and AE, respectively (Table 1); corresponding maps are presented in Figure 3.
Variation in Diffuse Attenuation Coefficient
The impact the COVID-19 lockdown had on Kd(490) was also studied along with SPM, and the observed results for the five prominent units selected in the Chennai coastal waters are outlined in Table 2. Comparable variability was observed in Kd(490) concentrations due to a decline of suspended and dissolved solids contributed from respective sources.
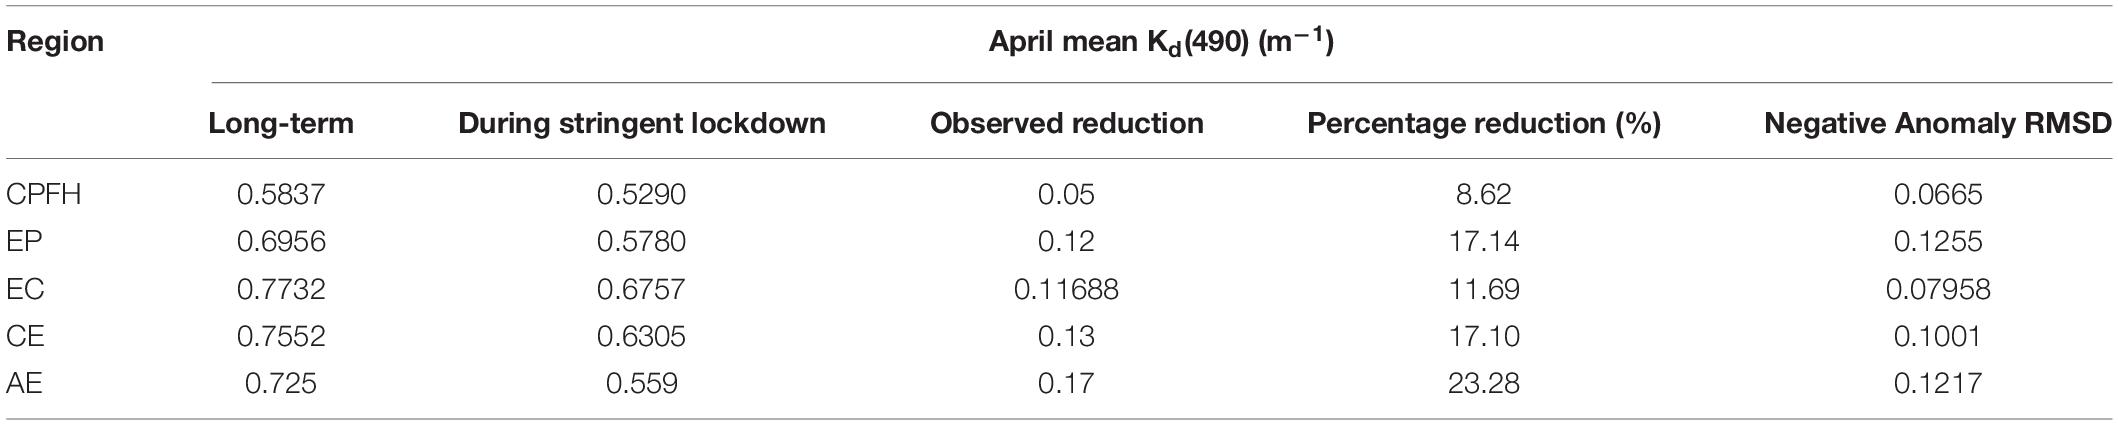
Table 2. Statistical parameters of Kd(490) for all prominent regions in the study area.
A decrease of cargo and vessel movement in the Chennai port, and also in relation to the decrease of SPM up to 15.48%, Kd(490) shows high transparency levels at the fishing harbor and port (Figure 4) with an 8.62% decrease in the light attenuation varying from ∼0.45 to ∼0.7 m–1 leading to water clarity. This observation shows the impact of lockdown with a pause in port and fishing activities. The EP showed a 11.69% decrease in the light attenuation, resulting in high transparency during the lockdown period, as shown in Figure 4. The Kd(490) varies from ∼0.45 to ∼0.7 m–1 as observed in the CPFH region. This indicates that port regions of EP and CPFH had a maximum decrease in both SPM distribution and Kd(490) light attenuation, showing the impact lockdown had.
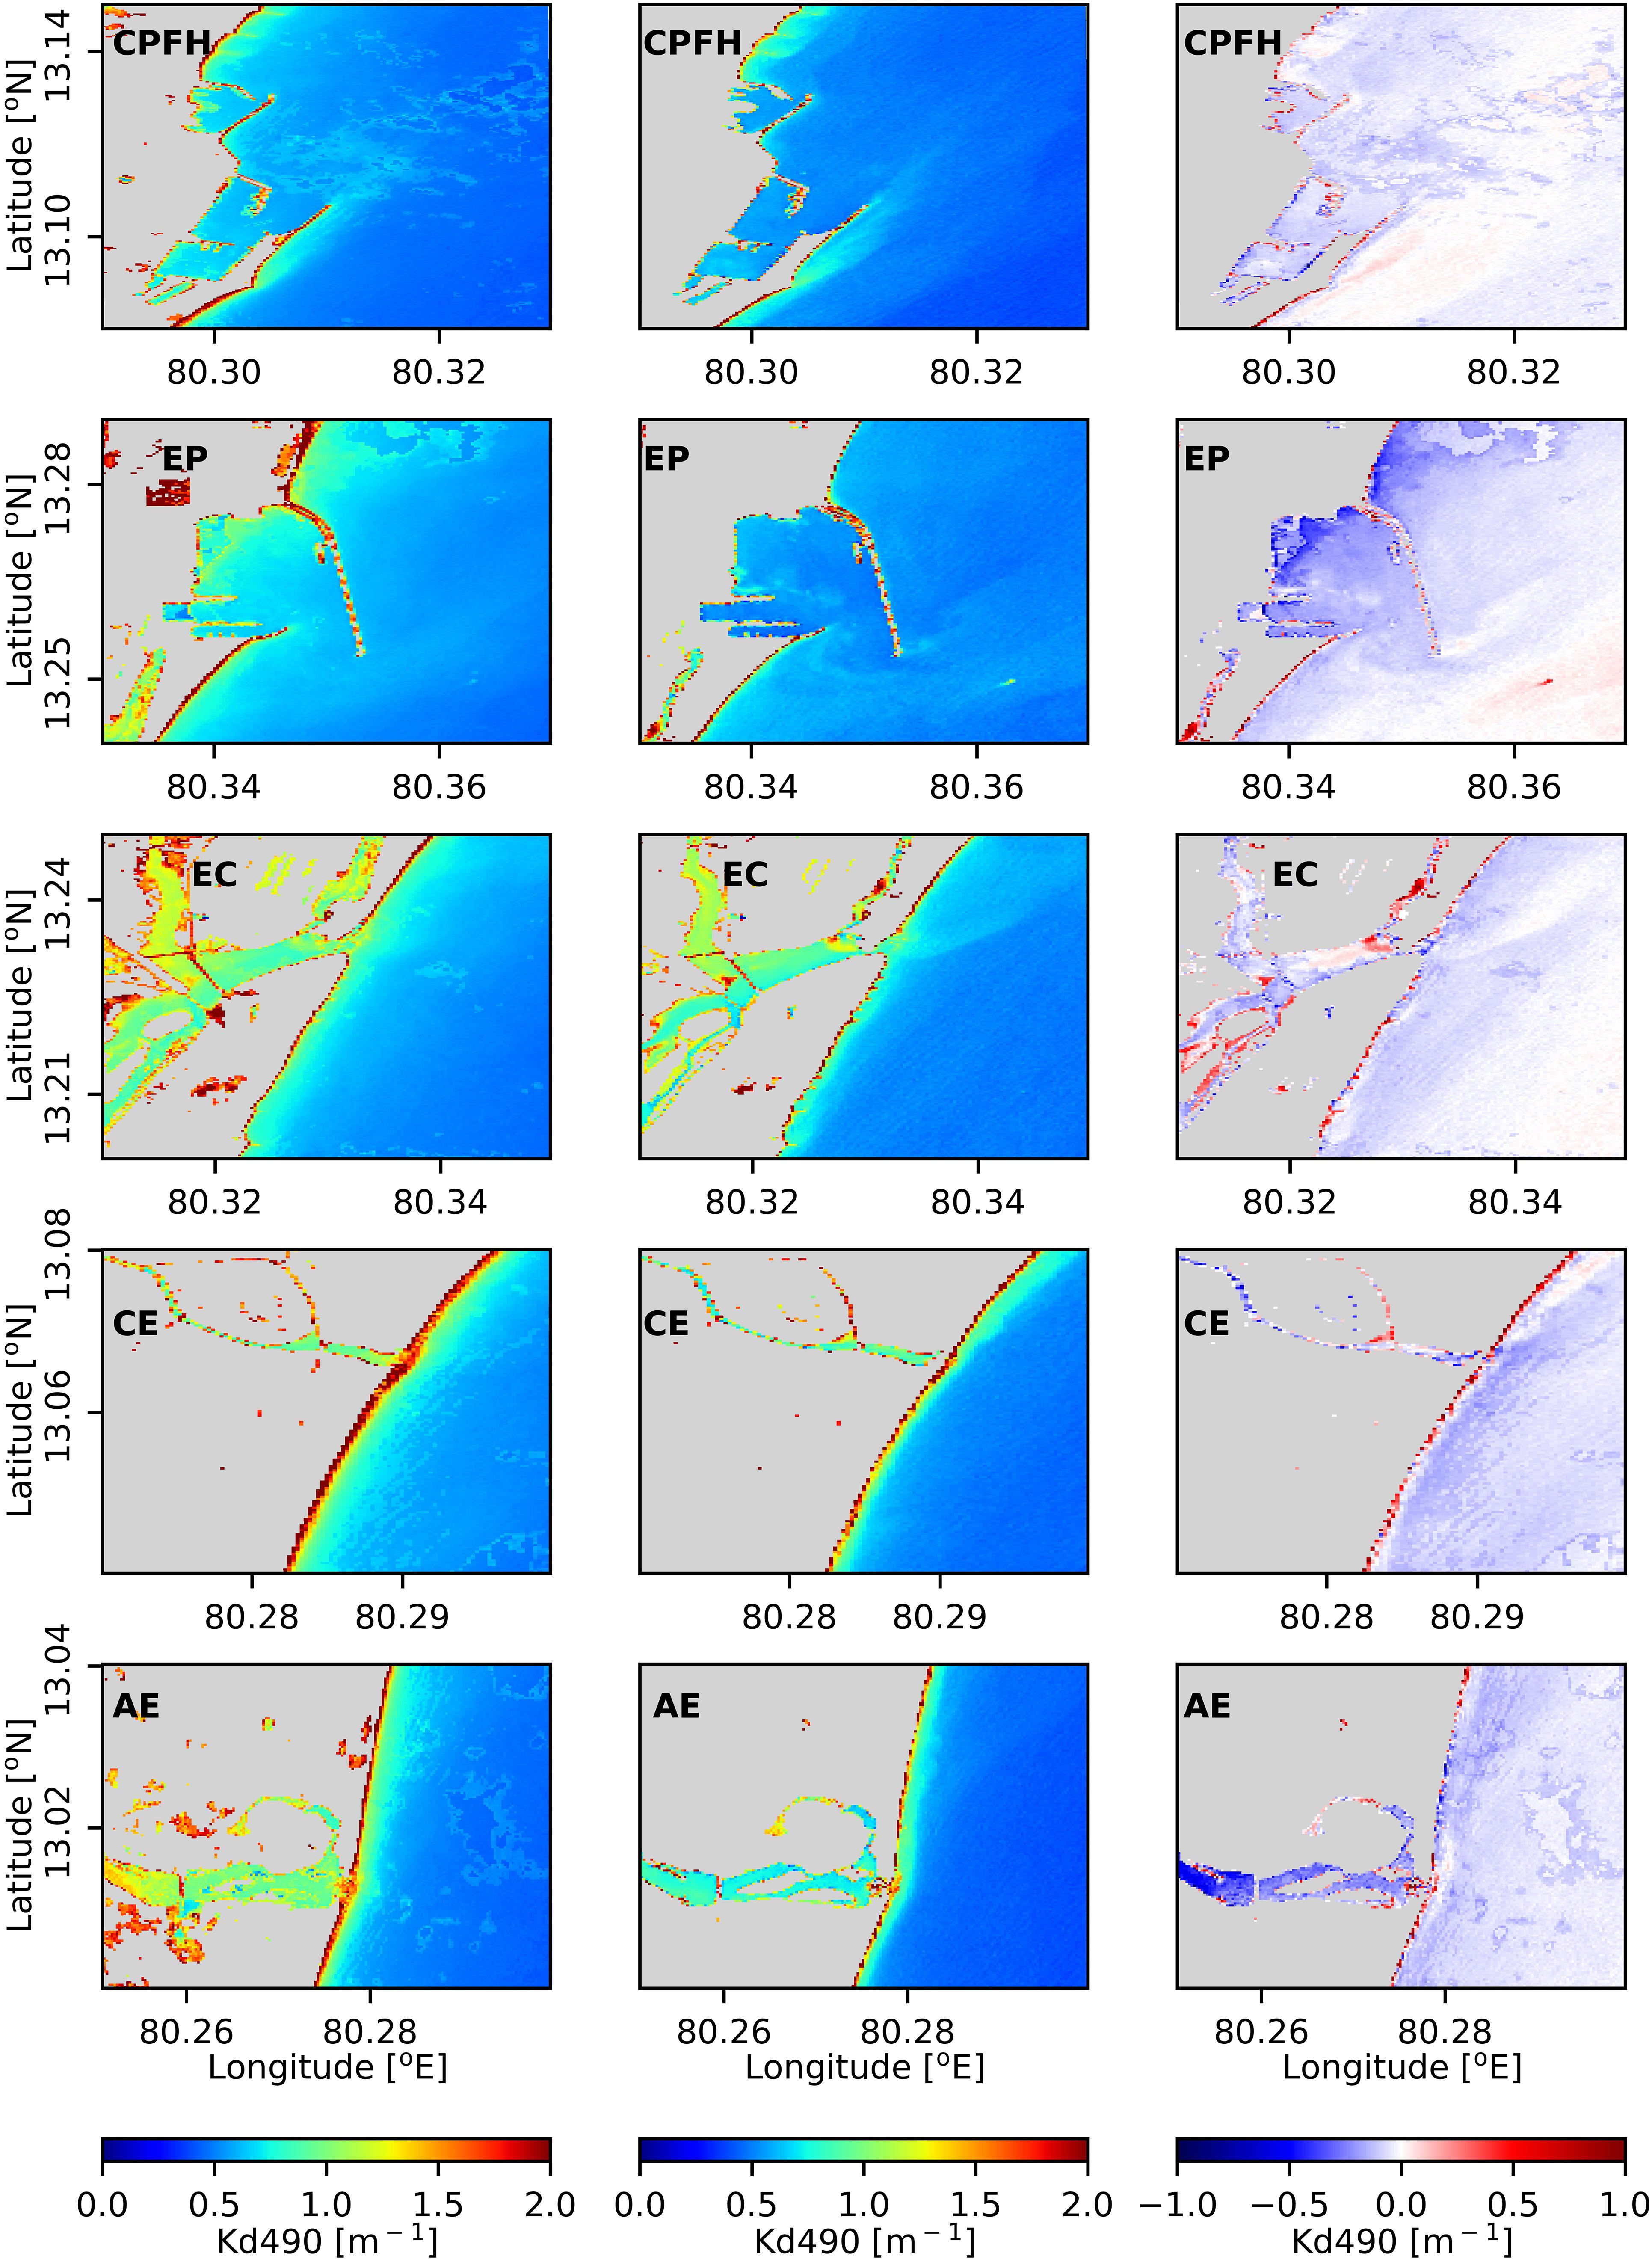
Figure 4. Long-term (left), April 2020 (middle), and April 2020 anomaly (right) mean distributions of Kd(490) over prominent regions in the study area.
SPM distribution over EC showed a maximum 28.05% decrease during the lockdown period which was also observed with a 17.14% decrease in the light attenuation from Kd(490), showing clear waters along the coast compared to the long-term mean. This can be attributed to the shutdown of industrial and dredging activities which resulted in reduced pollution and thus increasing coastal water quality in the EC.
The AE region located south of the Chennai port, indicates a maximum decrease of 23.28% difference compared to the long-term mean, which is also correlated to the maximum 33.97% decrease of SPM. The Kd(490) varies <1 m–1 showing reasonable transparency compared to the long-term distribution of Kd(490). Whereas in the CE region, located in between the CPFH and AE, Kd(490) distribution is observed with a 17.10% decrease along the coast. These estuarine regions are more susceptible to marine pollution, revealing the impact of lockdown in the reduced SPM concentrations and Kd(490) distribution in the coastal waters.
PM2.5 and PM10 Concentrations
The major sources for PM2.5 and PM10 concentrations in atmosphere are industries, dust and vehicular emissions. The variations in PM2.5 and PM10 concentrations in the Chennai local atmosphere were studied for this lockdown period by considering three National Air Quality Monitoring Programme (NAMP) stations at different LULC zones. The PM2.5 and PM10 data of Adyar (residential), Nungampakkam (commercial), and Manali (industrial) stations have been acquired from the pollution control boards of the State and Central governments for the period of 2018–2020. PM10 data is not available for Manali station and in the case of Adyar and Nungampakkam stations, the 2018 PM2.5 data is not available. The trend of specified air quality parameters has been assessed by analyzing pre- and during lockdown levels. As vehicles stayed off the road, construction was put on hold, and factories stopped production, the levels of microscopic particulate matter (PM2.5) started to drop (EcoWatch, 2020). It was observed that there was a profound decrease in particulate matter concentrations and the corresponding results are presented in following sections.
While measuring particulate matter concentrations in Adyar station, the results indicated a decrease in PM2.5 and PM10 over a period (February to May) in 2020 when compared with long-term mean values (Figures 5, 6). The percentage reduction during the stringent lockdown period (24.38% and 28.43%) was marginal because of the persistent contribution of domestic pollutants in residential zones (Table 3). The main sources of particulate matter in commercial areas are vehicular emissions. A significant drop in PM2.5 and PM10 (Figures 5, 6) levels were observed (36.09 and 67.18%) in Nungampakkam during the stringent lockdown period (Table 3) due to extensive restrictions implemented for public transport and vehicle movement. Other than the essential category units, most industries were shut during the COVID-19 lockdown. A profound improvement in air quality was observed in Manali due to reduced industrial emissions (Table 3 and Figures 5, 6).
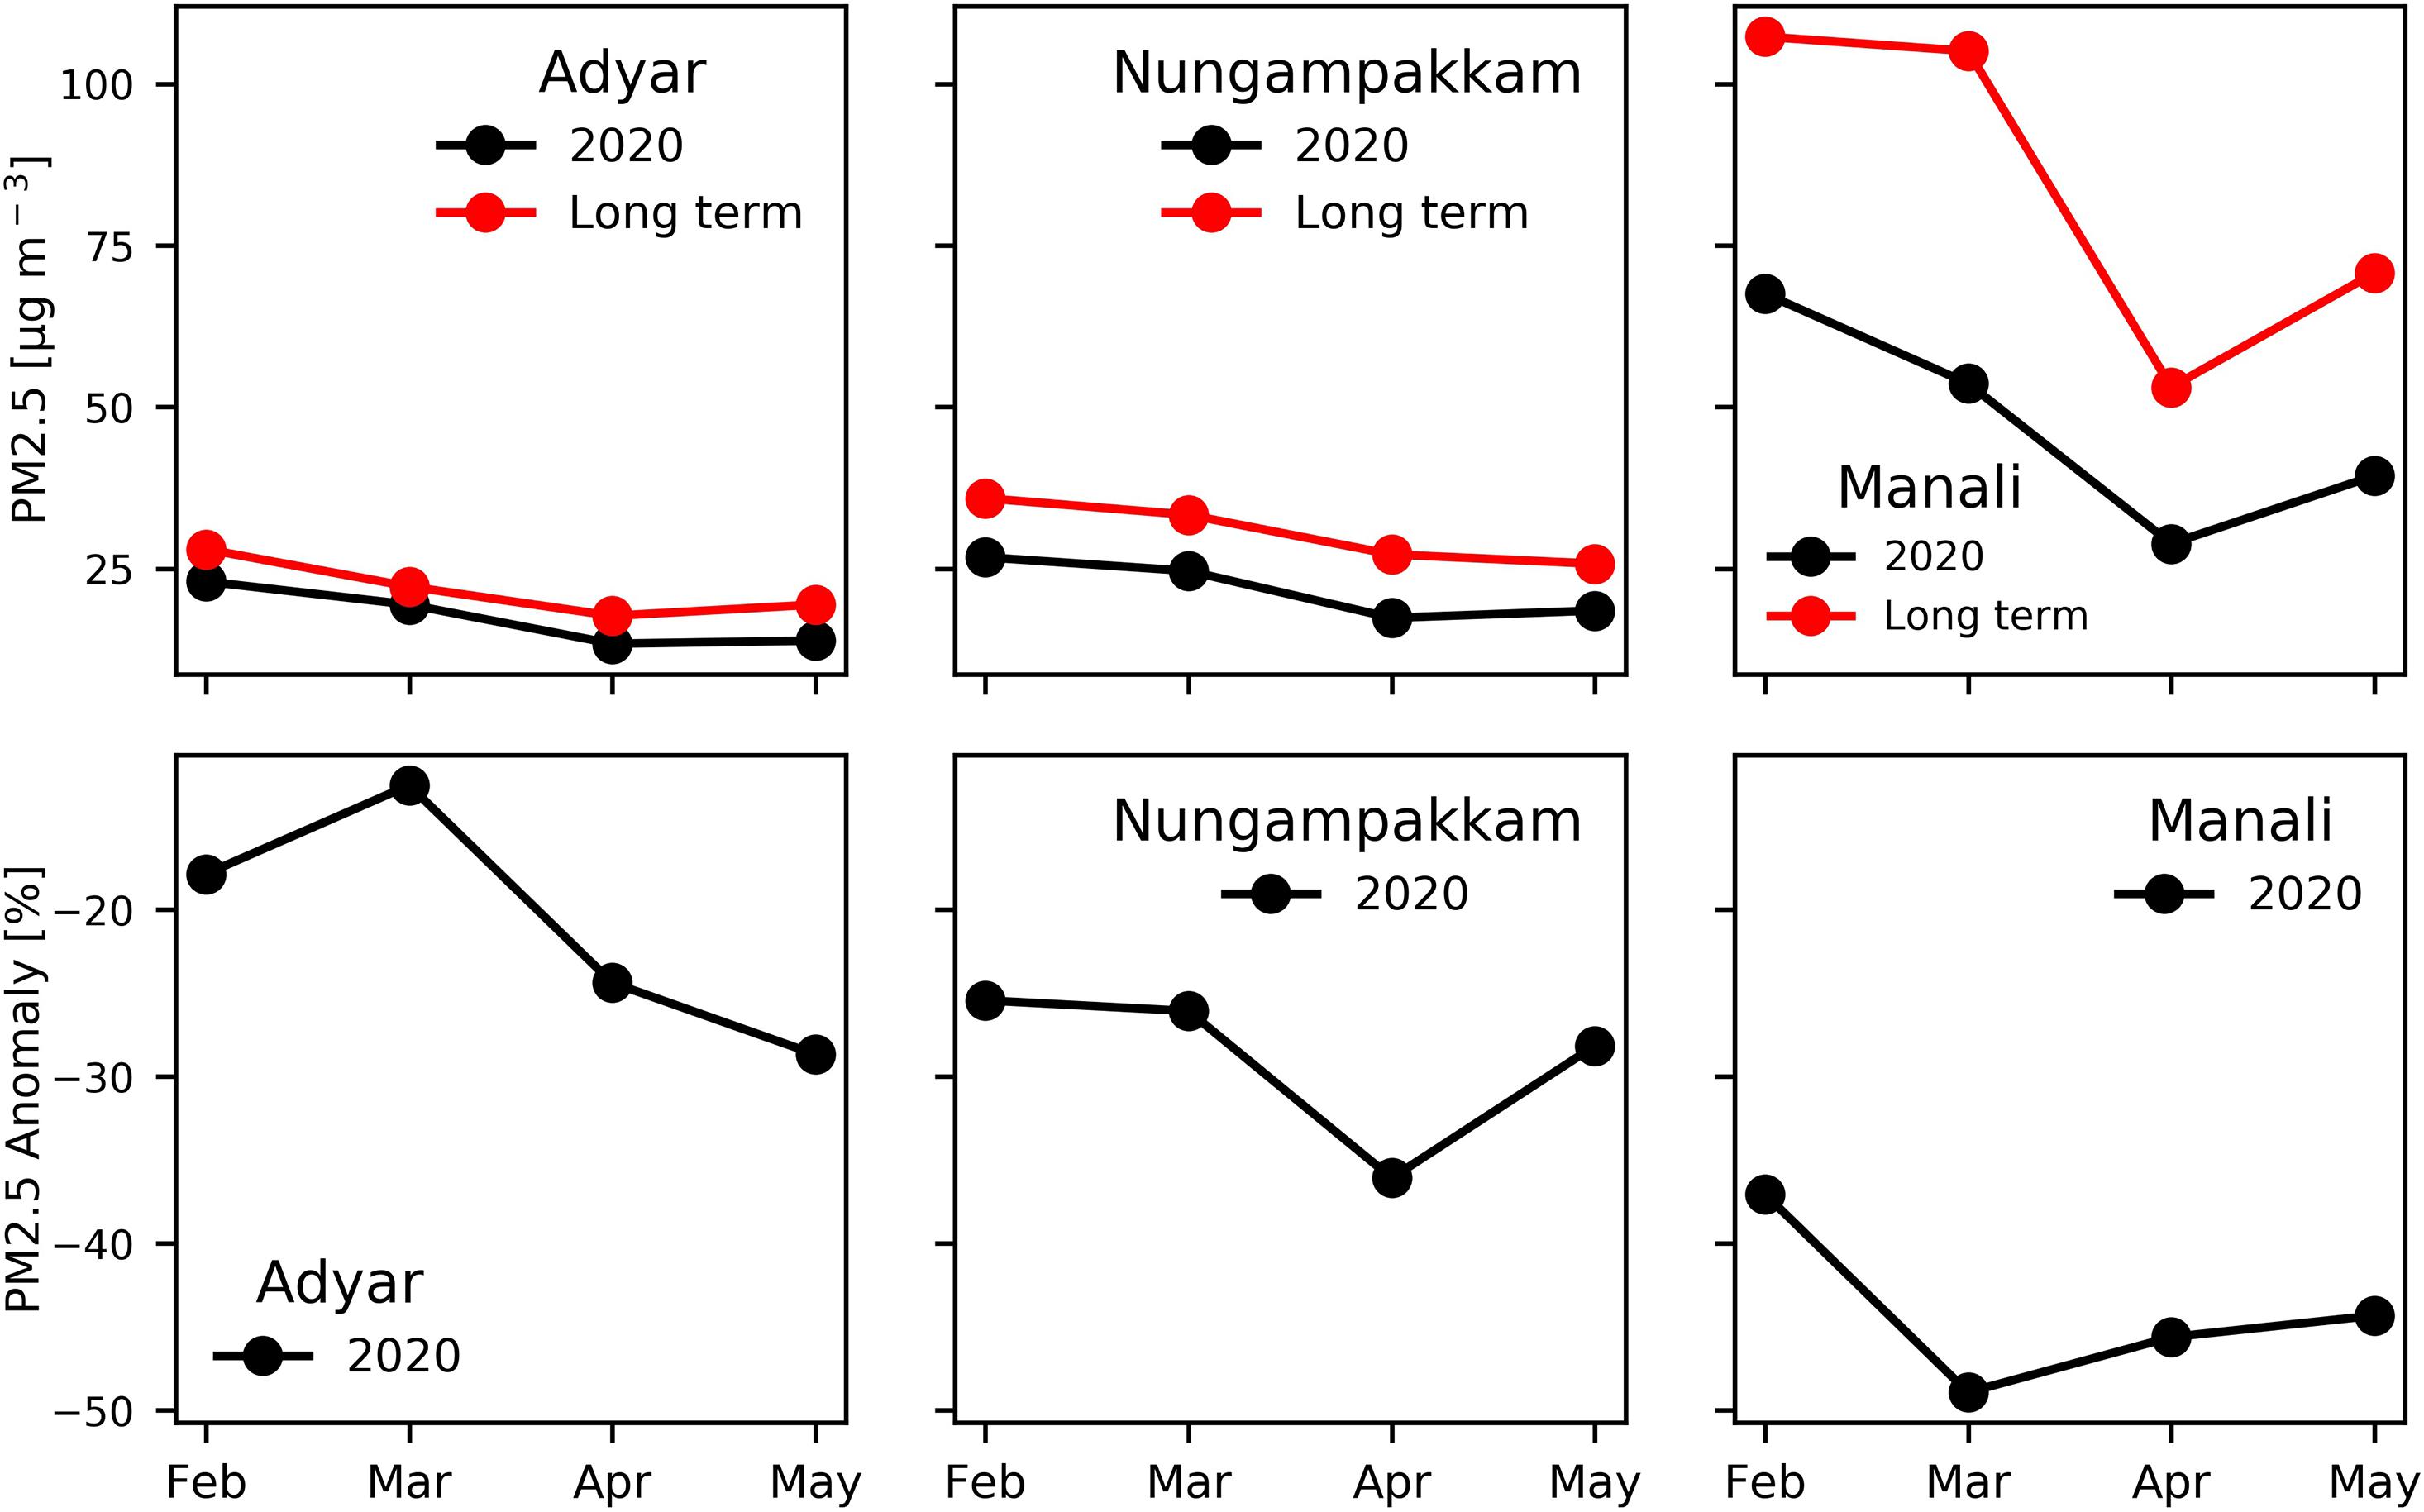
Figure 5. Plots representing variations in monthly means and their percentage anomalies with long-term data of PM2.5 data at residential (Adyar), commercial (Nungampakkam), and industrial (Manali) zones.
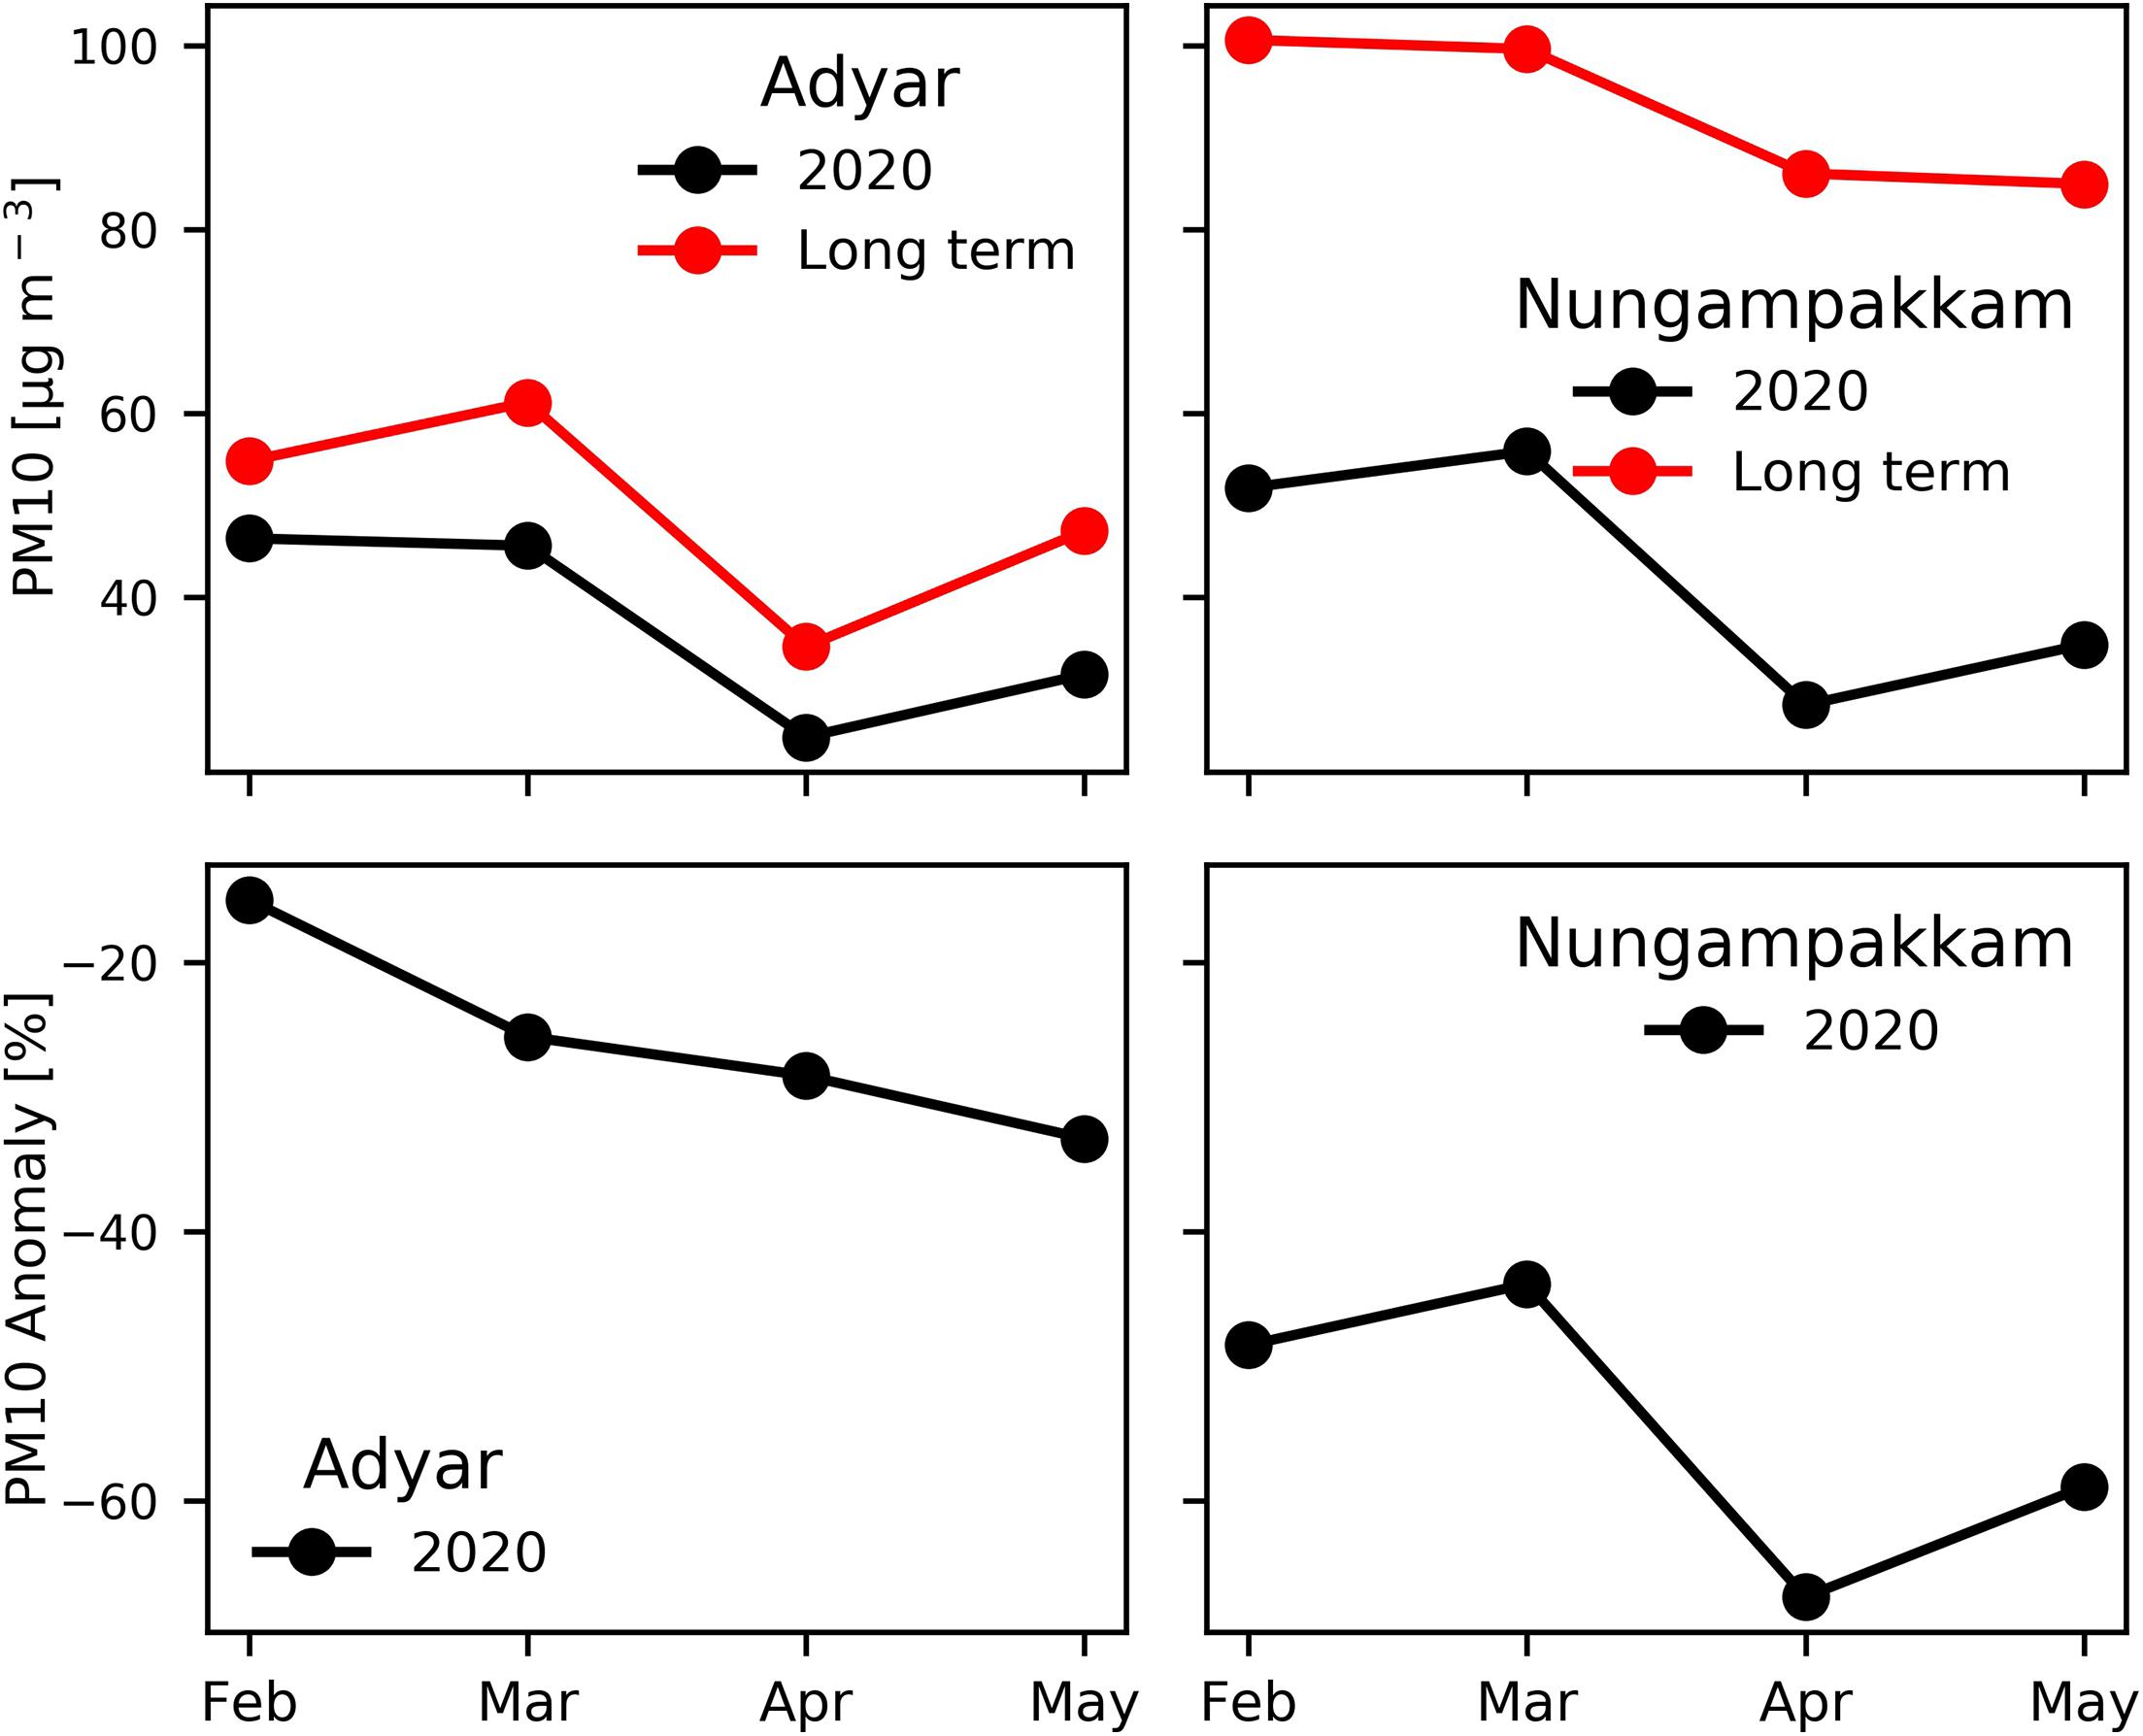
Figure 6. Plots representing variations in monthly means and their percentage anomalies with long-term data of PM10 data at residential (Adyar), commercial (Nungampakkam), and industrial (Manali) zones.
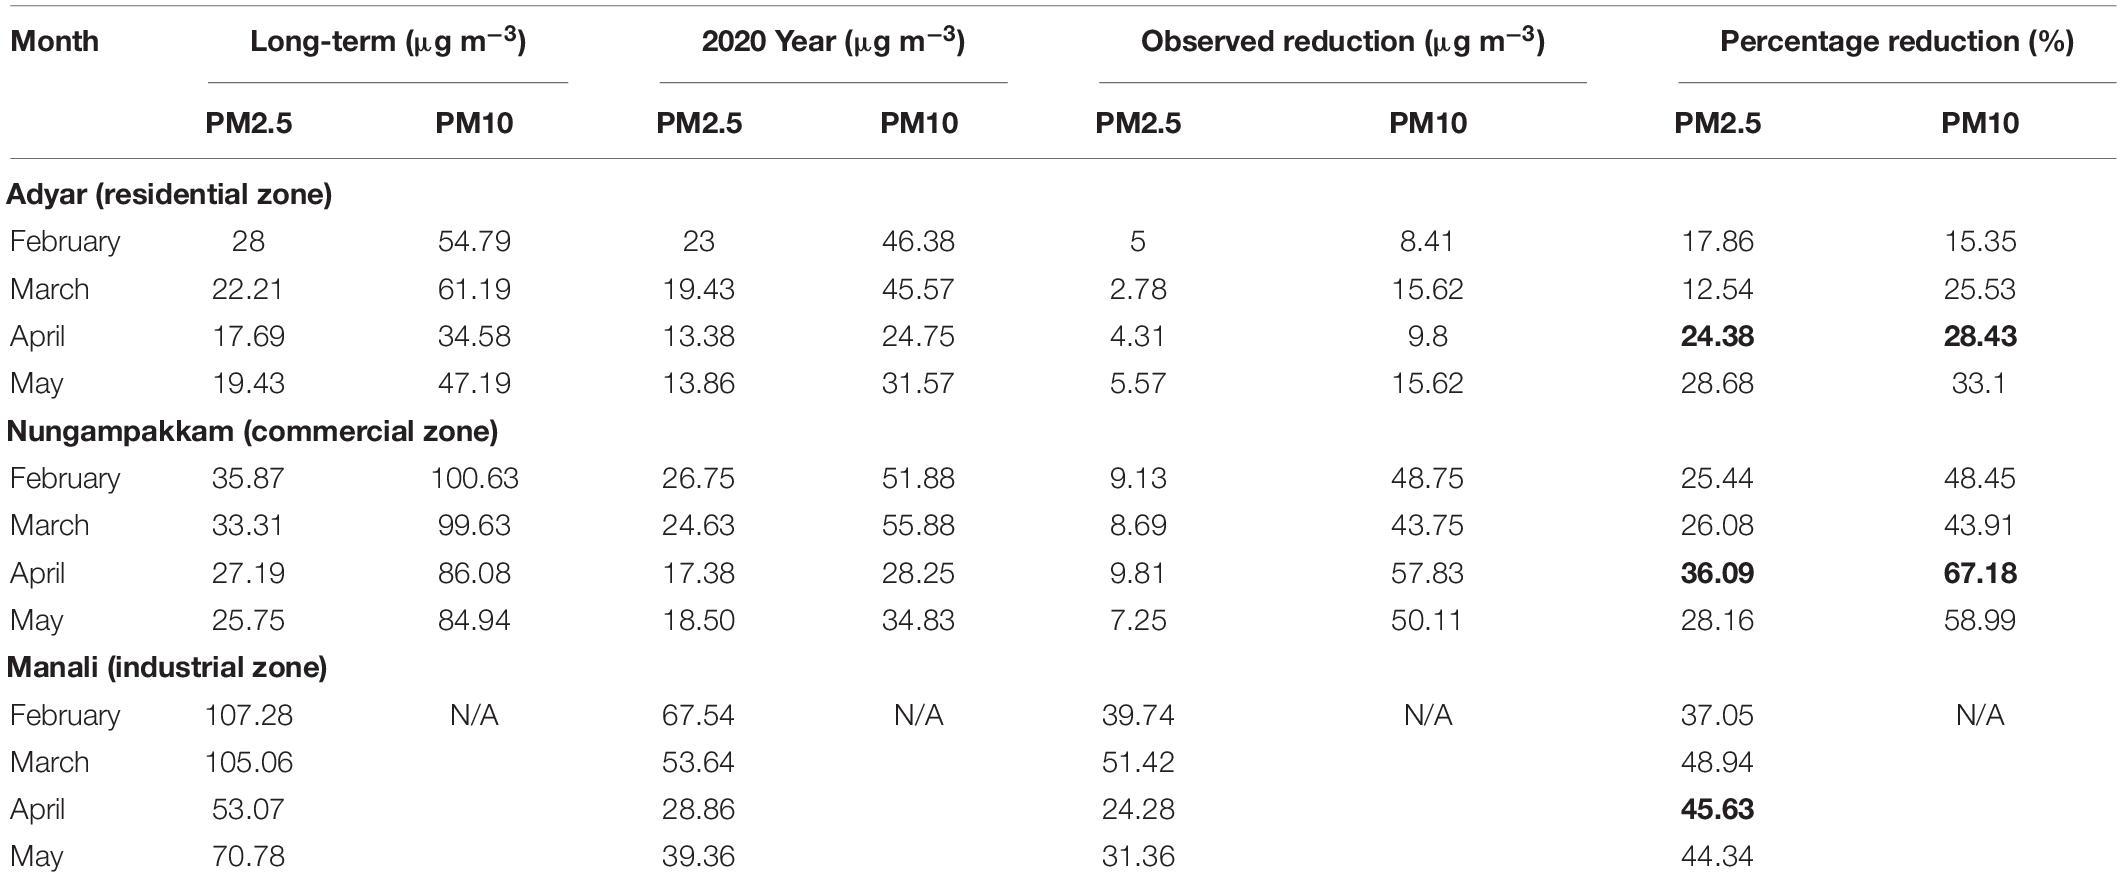
Table 3. Statistical analysis of monthly particulate matter mean data.
Discussion
Decreased SPM levels in response to the COVID-19 lockdown indicated a reduced influx of contaminants (size ≥0.45 microns) into coastal waters. Unlike SPM concentration, the Kd(490) parameter reveals the combined effect of suspended and dissolved matter (majorly Color Dissolved Organic Matter) on light attenuation (Kirk, 1994; Gallegos and Moore, 2000). Decrease in Kd (490) values resulted in improved water quality and the same was observed in all the prominent regions of study during the lockdown period. This decrease in Kd (490) can be related to three possibilities:
i. Both suspended and dissolved matters were decreased
ii. Suspended matter decreased whereas dissolved matter remained the same
iii. Dissolved matter decreased whereas suspended matter remained the same
Though the impact lockdown had on dissolved matter is not quantified in the present study, a decrease in dissolved matter levels could be expected due to the shutdown of anthropogenic activities. The first two cases show an in-phase relationship with the SPM results of this study, but the third case exhibited contradictory behavior. As the inorganic suspended matter shows dominance in the turbid coastal waters, the absence of their respective sources will certainly have an impact on their abundance and there is no possibility of occurrence for the third case during COVID-19 lockdown. A decrease in Kd(490) therefore shows an in-phase/positive relationship with SPM (Figure 7) and substantiates improved coastal water quality through the reduction of SPM during the stringent lockdown period.
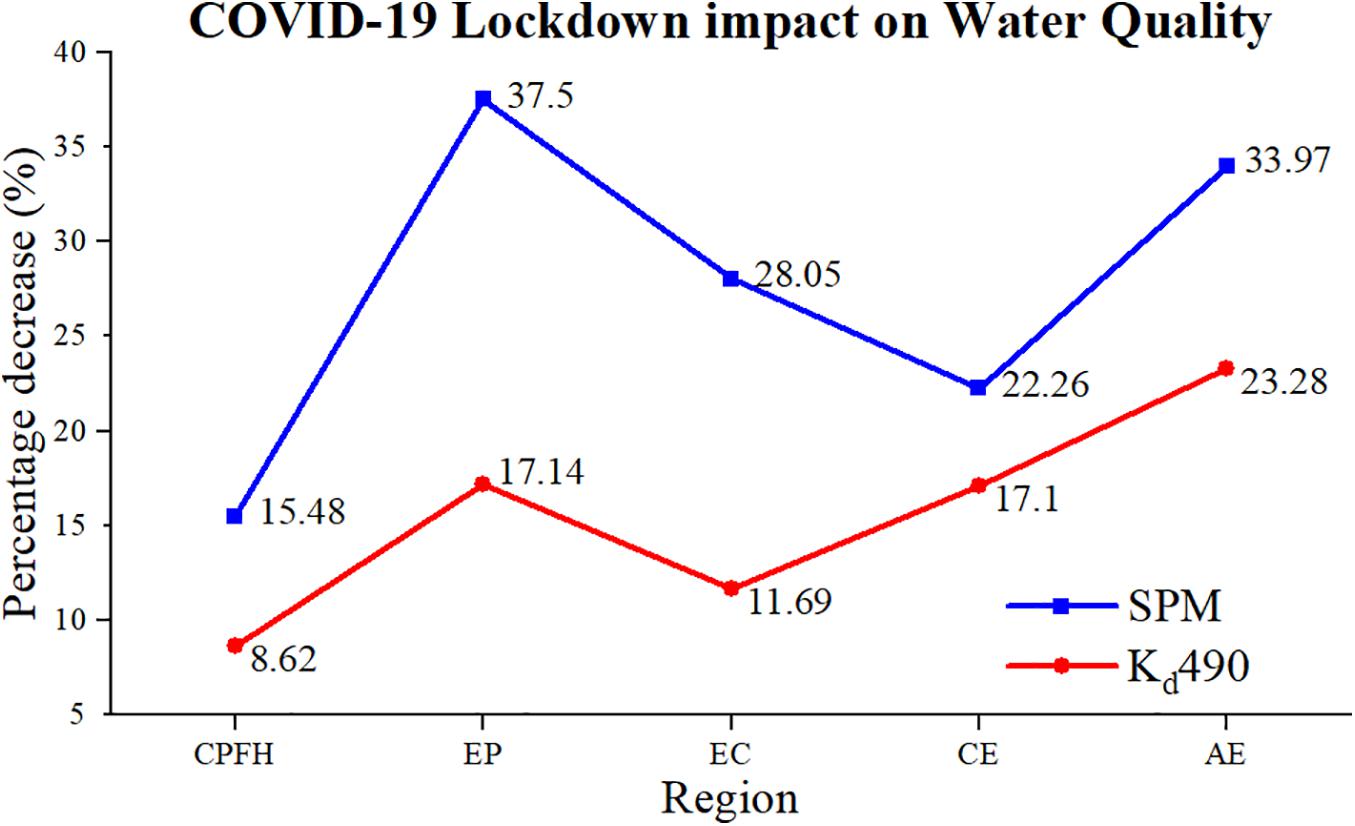
Figure 7. Plot representing positive relationship between SPM and Kd490.
In general, spatio-temporal variability of SPM concentration levels in coastal waters mainly depends on domestic and industrial sewage, atmospheric fallout, runoff, tides, and re-suspension of sediments. Among these, the components associated with anthropogenic activities are: sewage that originates from domestic sources and industrial outlets; atmospheric particulate matter that releases from vehicular emissions, and industries. A direct increase or decrease in the aforementioned components will certainly have an impact on SPM levels. Apart from the anthropogenic contribution, the rest can be attributed to natural variability. Landsat-8 scenes of 2 and 18 April 2020 were considered, while computing mean SPM values for the stringent lockdown period, observed reduction in SPM levels. In view of checking natural SPM variability, the authors verified any deviation from the prevailing or natural/climatic conditions in the study region. The Northeast monsoon (October–December) is a major source of rainfall in Tamil Nadu and the state is entirely dependent on rains for recharging its water resources. From a CPC global unified gauge-based analysis of daily precipitation data, it was observed that there is no rainfall during the times of Landsat-8 coverage. It was observed that Landsat-8 overpassed the Chennai coast during low-tide, on both days. So, the natural variability of SPM associated with runoff and tidal currents could be eliminated. The observed reduction in SPM levels can therefore be solely attributed to the stringent lockdown period.
Conclusion
The impact of the COVID-19 lockdown on coastal water quality across the Chennai region was studied by analyzing the suspended particulate matter concentration (SPM). Anthropogenic activities’ contribution to SPM levels was assessed for all five prominent regions in the study area. A decrease in SPM concentration (15.48, 37.50%) was clearly observed due to minimal vessel movement and cargo handling at the Chennai and Ennore ports. SPM levels over Ennore creek/estuary were reduced by 28.05%, and can be attributed to limited industrial activities in Ennore-Manali area and the decreased fly ash emissions from thermal power plants. As industrial and commercial activities subsided during the lockdown period, the city’s water bodies, Adyar and Cooum, were clearer than the pre-lockdown period, with no industrial effluents flowing in from closed factories. The suspended matter over these estuaries was reduced by 22.26 and 33.97%. A decrease in Kd(490) showed an in-phase/positive relationship with SPM and substantiated the improved coastal water quality through the reduction of SPM during the lockdown period. The variations in PM2.5 and PM10 concentrations in the Chennai local atmosphere were studied for this stringent lockdown period considering three NAMP stations at different LULC zones. The extensive restrictions imposed on public transport and vehicular movement reduced the particulate matter concentration (PM2.5 and PM10) for the Adyar residential area (24.38 and 28.43%) and for the Nungampakkam commercial area (36.09 and 67.18%). A significant reduction in PM2.5 concentration (45.63%) was observed for the Manali industrial region. Peters et al., 2012 reported rapid growth in pollution levels (CO2) after the global financial crisis occurred in 2008 to 2009. Once the situation stabilizes, and returns to normality as seen during the pre-lockdown period, a rebound of pollution levels in all spheres of earth can be expected within a short time span. This study propounds the necessity of sustainable development to maintain a balanced environment, otherwise the COVID-19 lockdown scenario will simply replicate the rise in pollution seen after the 2008 to 2009 global financial crisis.
Data Availability Statement
Publicly available datasets were analyzed in this study. This data can be found here: https://earthexplorer.usgs.gov/; https://app.cpcbccr.com/; https://tnpcb.gov.in/air-quality.php.
Author Contributions
KV, CG, and TP were research scholars working under the guidance of PN (Head and Scientist-F, Biological Oceanography Division, National Remote Sensing Centre-ISRO, Hyderabad). CJ (Scientist-E, RRSC East, NRSC-ISRO, Kolkata) and CL (Asst. Professor, JNTU, Kakinada) are co-guides for this research work. KV, CG, and TP were involved in literature survey, data downloading, outputs preparation and basic drafting. PN, CJ, and CL have supervised and guided the whole work and finalized manuscript drafting. All authors contributed to the article and approved the submitted version.
Conflict of Interest
The authors declare that the research was conducted in the absence of any commercial or financial relationships that could be construed as a potential conflict of interest.
Acknowledgments
We thank and acknowledge USGS for distributing Landsat-8 data freely. The pollution control boards of Tamil Nadu state (TNPCB, Chennai) and the Central Government (CPCB, New Delhi) are thanked for providing PM2.5 and PM10 data. We thank and acknowledge NOAA/OAR/ESRL PSL for distributing CPC Global Unified Precipitation data. We thank the National Remote Sensing Centre, Hyderabad (ISRO) for providing the infrastructure to carry out this work.
Supplementary Material
The Supplementary Material for this article can be found online at: https://www.frontiersin.org/articles/10.3389/fmars.2021.659686/full#supplementary-material
References
Ahn, Y. H., Moon, J. E., and Gallegos, S. (2001). Development of suspended particulate matter algorithms for ocean color remote sensing. Korea. J. Remote Sens. 17, 285–295.
Babin, M., Morel, A., Fournier-Sicre, V., Fell, F., and Stramski, D. (2003a). Light scattering properties of marine particles in coastal and open ocean waters as related to the particle mass concentration. Limnol. Oceanogr. 48, 843–859. doi: 10.4319/lo.2003.48.2.0843
Babin, M., Stramski, D., Ferrari, G. M., Claustre, H., Bricaud, A., Obolensky, G., et al. (2003b). Variations in the light absorption coefficients of phytoplankton, non-algal particles and dissolved organic matter in coastal waters around Europe. J. Geophys. Res. 108:3211. doi: 10.1029/2001JC000882
Central Pollution Control Board-India (2020). Impact of Lockdown (25th March to 15th April) on Air Quality. Available online at: https://cpcb.nic.in/ openpdffile.php?id=TGF0ZXN0RmlsZS9fMTU4ODE1NjM0OF9tZWRpYXBo b3RvMjEyNDEucGRm (accessed June 25, 2020).
Chandramohan, P., Nayak, B. U., and Raju, V. S. (1990). Long-shore transport model for south Indian and Sri Lankan coasts. J. Waterw. Port C ASCE 116, 408–424. doi: 10.1061/(ASCE)0733-950X1990116:4(408)
Chennai Port - Tamil Nadu (2020). Port Statistics. Available online at: https://www.chennaiport.gov.in/content/cargo-wise-traffic-handled (accessed June 25, 2020).
Curran, P. J., Hansom, J. D., Plummer, S. E., and Pedley, M. I. (1987). Multispectral remote sensing of nearshore suspended sediments: a pilot study. Int. J. Remote Sens. 8, 103–112. doi: 10.1080/01431168708948618
EcoWatch (2020). India’s Air Pollution Plummets in COVID-19 Lockdown. Available online at: https://www.ecowatch.com/india-air-pollution-coronavirus (accessed June 25, 2020).
Fondriest Environmental Inc (2014). Turbidity, Total Suspended Solids and Water Clarity-Fundamentals of Environmental Measurements. Available online at: https://www.fondriest.com/environmental-measurements/parameters/water-quality/turbidity-total-suspended-solids-water-clarity (accessed June 20, 2020).
Gallegos, C. L., and Moore, K. A. (2000). “Factors contributing to water-column light attenuation,” in Chesapeake Bay Submerged Aquatic Vegetation Water Quality and Habitat-Based Requirements and Restoration Targets: A Second Technical Synthesis, ed. R. A. Batiuk (Annapolis, MD: EPA Chesapeake Bay Program), 35–54.
Gordon, H. R., Brown, O. B., Evans, R. H., Brown, J. W., Smith, R. C., Baker, K. S., et al. (1988). A semianalytical radiance model of ocean color. J. Geophys. Res. 93, 10909–10924. doi: 10.1029/JD093iD09p10909
Gordon, H. R., and Wang, M. (1994). Retrieval of water-leaving radiance and aerosol optical thickness over the oceans with SeaWiFS: a preliminary algorithm. Appl. Opt. 33, 443–452. doi: 10.1364/AO.33.000443
Gowri, V. S., and Ramachandran, S. (2001). “Coastal pollution of Chennai city, Coastal geomorphology of India,” in Institute of Ocean Management, ed. S. Ramachandran, (Chennai: Anna University), 1187–1206.
Harmel, T., Chami, M., Tormos, T., Reynaud, N., and Danis, P.-A. (2018). Sunglint correction of the Multi-Spectral Instrument (MSI)-SENTINEL-2 imagery over inland and sea waters from SWIR bands. Remote Sens. Environ. 204, 308–321. doi: 10.1016/j.rse.2017.10.022
Kalaivani, K., and Krishnaveni, M. (2015). Multivariate statistical analysis of pollutants in Ennore creek, south-east coast of India. Glob. Nest J. 17, 618–627. doi: 10.30955/gnj.001669
Kirk, J. T. O. (1988). Optical water quality-What does it mean and how should we measure it? J. Water Pollut. Control Fed. 60, 194–197.
Kirk, J. T. O. (1994). Light and Photosynthesis in Aquatic Ecosystems. Cambridge: Cambridge University Press.
Kravchishina, M. D., Klyuvitkin, A. A., Lukashin, V. N., Politova, N. V., Novigatsky, A. N., and Lisitsyn, A. P. (2018). Distribution of suspended particulate matter in the Caspian Sea. Russ. Meteorol. Hydrol. 43, 697–705. doi: 10.3103/S1068373918100096
Kuppusamy, M. R., and Giridhar, V. V. (2006). Factor analysis of water quality characteristics including trace metal speciation in the coastal environmental system of Chennai Ennore. Environ. Int. 32, 174–179. doi: 10.1016/j.envint.2005.08.008
Laxmipriya, S., and Narayanan, R. M. (2020). Seasonal variation in atmospheric particulate matter pollution-a comparative study in part of greater Chennai, India during and before SARS-Cov-2 pandemic in India. J. Xidian Univ. 14, 5957–5964. doi: 10.37896/jxu14.5/645
Lee, Z. P., Carder, K. L., and Arnone, R. (2002). Deriving inherent optical properties from water colour: a multi-band quasi-analytical algorithm for optically deep waters. Appl. Opt. 41, 5755–5772. doi: 10.1364/AO.41.005755
Lee, Z. P., Du, K. P., and Arnone, R. (2005). A model for the diffuse attenuation coefficient of downwelling irradiance. J. Geophys. Res. 2005:C02016. doi: 10.1029/2004JC002275
Lee, Z. P., Shang, S., Hu, C., Du, K., Weidemann, A., Hou, W., et al. (2015). Secchi disk depth: a new theory and mechanistic model for underwater visibility. Remote Sens. Environ. 169, 139–149. doi: 10.1016/j.rse.2015.08.002
Lim, J., and Choi, M. (2015). Assessment of water quality based on Landsat 8 operational land imager associated with human activities in Korea. Environ Monit Assess 187, 384. doi: 10.1007/s10661-015-4616-1
Loisel, H., and Morel, A. (2001). Non-isotropy of the upward radiance field in typical coastal (Case 2) waters. Int. J. Remote Sens. 22, 275–295. doi: 10.1080/014311601449934
Lubac, B., and Loisel, H. (2007). Variability and classification of remote sensing reflectance spectra in the eastern English Channel and southern North Sea. Remote Sens. Environ. 110, 45–58. doi: 10.1016/j.rse.2007.02.012
Mishra, P., Panda, U. S., Pradhan, U., Kumar, C. S., Naik, S., Begum, M., et al. (2015). Coastal water quality monitoring and modelling off Chennai city. Proced. Eng. 116, 955–962. doi: 10.1016/j.proeng.2015.08.386
Morel, A., and Gentili, B. (1991). Diffuse reflectance of oceanic waters: its dependence on Sun angle as influenced by the molecular scattering contribution. Appl. Opt. 30, 4427–4438. doi: 10.1364/AO.30.004427
Morel, A., and Gentili, B. (1996). Diffuse reflectance of oceanic waters. III. Implication of bidirectionality for the remote-sensing problem. Appl. Opt. 35, 4850–4862. doi: 10.1364/AO.35.004850
Mouw, C. B., Greb, S., Aurin, D., DiGiacomo, P. M., Lee, Z., Twardowski, M., et al. (2015). Aquatic color radiometry remote sensing of coastal and inland waters: challenges and recommendations for future satellite missions. Remote Sens. Environ. 160, 15–30. doi: 10.1016/j.rse.2015.02.001
Navinya, C., Patidar, G., and Phuleria, H. C. (2020). Examining effects of the COVID-19 national lockdown on ambient air quality across Urban India. Aerosol. Air Qual. Res. 20, 256. doi: 10.4209/aaqr.2020.05.0256
Nechad, B., Ruddick, K. G., and Park, Y. (2010). Calibration and validation of a generic multisensor algorithm for mapping of total suspended matter in turbid waters. Remote Sens. Environ. 114, 854–866. doi: 10.1016/j.rse.2009.11.022
Novo, E. M. M., Hansom, J. D., and Curran, P. J. (1989). The effect of viewing geometry and wavelength on the relationship between reflectance and suspended sediment concentration. Int. J. Remote Sens. 10, 1357–1372. doi: 10.1080/01431168908903973
Peters, G. P., Marland, G., Le Quéré, C., Boden, T., Canadell, J. G., and Raupach, M. R. (2012). Rapid growth in CO2 emissions after the 2008–2009 global financial crisis. Nat. Clim. Chang. 2, 2–4. doi: 10.1038/nclimate1332
Ramesh, R., Nammalwar, P., and Gowri, V. S. (2008). Database on Coastal Information of Tamilnadu. Report submitted to Environmental Information System (ENVIS), Chennai: Institute for Ocean Management, Anna University.
Saraswat, R., and Saraswat, D. A. (2020). Research opportunities in pandemic lockdown. Science 368, 594–595. doi: 10.1126/science.abc3372
Sathyendranath, S. (2000). Remote Sensing of Ocean Colour in Coastal, and Other Optically-Complex Waters. San Ysidro, CA: IOCCG.
SCRIPPS (2020). Research in the Time of COVID-19. Available online at: https://scripps.ucsd.edu/news/research-time-covid-19 (accessed April 17, 2020).
Shanmugam, P. S. N., Ahn, Y.-H., Philip, L., and Hong, G.-H. (2007). Assessment of the levels of coastal marine pollution of Chennai city, Southern India. Water Resour. Manag. 21, 1187–1206. doi: 10.1007/s11269-006-9075-6
Sharma, S., Zhang, M., Gao, J., Zhang, H., and Kota, S. H. (2020). Effect of restricted emissions during COVID-19 on air quality in India. Sci. Total Environ. 728:138878. doi: 10.1016/j.scitotenv.2020.138878
Smith, R. C., and Baker, K. S. (1981). Optical properties of the clearest natural waters (200-800 nm). Appl. Opt. 20, 177–184. doi: 10.1364/AO.20.000177
Sun, D. Y., Qiu, Z. F., Li, Y. M., Shi, K., Huang, C. C., and Gong, S. Q. (2014). New strategy to improve estimation of diffuse attenuation coefficient for highly turbid inland waters. Int. J. Remote Sens. 35, 3350–3371. doi: 10.1080/01431161.2014.904972
ThePrint (2020). Fishing industry suffers another blow as workers are stranded on boats, debt is piling up. Available online at: https://theprint.in/india/fishing-industry-suffers-another-blow-as-workers-are-stranded-on-boats-debt-is-piling-up (accessed June 25, 2020).
The Times of India (2020). Pollutants Down, Chennai’s Rivers Cleaner. Available online at: https://timesofindia.indiatimes.com/city/chennai/pollutants-down-citys-rivers-cleaner (accessed June 25, 2020).
Trinh, R. C., Fichot, C. G., Gierach, M. M., Holt, B., Malakar, N. K., Hulley, G., et al. (2017). Application of Landsat 8 for monitoring impacts of wastewater discharge on coastal water quality. Front. Mar. Sci. 4:329. doi: 10.3389/fmars.2017.00329
Vanhellemont, Q. (2019). Adaptation of the dark spectrum fitting atmospheric correction for aquatic applications of the Landsat and Sentinel-2 archives. Remote Sens. Environ. 225, 175–192. doi: 10.1016/j.rse.2019.03.010
Vanhellemont, Q., and Ruddick, K. (2015). Advantages of high quality SWIR bands for ocean colour processing: examples from Landsat-8. Remote Sens. Environ. 161, 89–106. doi: 10.1016/j.rse.2015.02.007
Vanhellemont, Q., and Ruddick, K. (2018). Atmospheric correction of metre-scale optical satellite data for inland and coastal water applications. Remote Sens. Environ. 216, 586–597. doi: 10.1016/j.rse.2018.07.015
Wei, J., Lee, Z., Garcia, R., Zoffoli, L., Armstrong, R. A., Shang, Z., et al. (2018). An assessment of Landsat-8 atmospheric correction schemes and remote sensing reflectance products in coral reefs and coastal turbid waters. Remote Sens. Environ. 215, 18–32. doi: 10.1016/j.rse.2018.05.033
Worldometers.info (2020). Coronavirus Updates. Available online at: https://www.worldometers.info/coronavirus (accessed June 26, 2020).
Keywords: COVID-19 lockdown, water quality, Chennai coastal waters, suspended particulate matter, diffuse attenuation coefficient, ACOLITE
Citation: Vijay Prakash K, Geetha Vimala ChS, Preethi Latha T, Jayaram C, Nagamani PV and Laxmi ChNV (2021) Assessment of Water Quality Along the Southeast Coast of India During COVID-19 Lockdown. Front. Mar. Sci. 8:659686. doi: 10.3389/fmars.2021.659686
Received: 28 January 2021; Accepted: 16 March 2021;
Published: 13 April 2021.
Edited by:
Deepak R. Mishra, University of Georgia, United StatesReviewed by:
Chandrasekar Nainarpandian, Manonmaniam Sundaranar University, IndiaMatthew Lewis, Bangor University, United Kingdom
Copyright © 2021 Vijay Prakash, Geetha Vimala, Preethi Latha, Jayaram, Nagamani and Laxmi. This is an open-access article distributed under the terms of the Creative Commons Attribution License (CC BY). The use, distribution or reproduction in other forums is permitted, provided the original author(s) and the copyright owner(s) are credited and that the original publication in this journal is cited, in accordance with accepted academic practice. No use, distribution or reproduction is permitted which does not comply with these terms.
*Correspondence: P. V. Nagamani, pvnagamani@gmail.com