
Franklin County, Kansas
Franklin County | |
|---|---|
 Franklin County Courthouse in Ottawa (2009) | |
 Location within the U.S. state of Kansas | |
 Kansas's location within the U.S. | |
| Coordinates: 38°35′00″N 95°17′00″W / 38.5833°N 95.2833°W | |
| Country | |
| State | |
| Founded | August 25, 1855 |
| Named for | Benjamin Franklin |
| Seat | Ottawa |
| Largest city | Ottawa |
| Area | |
| • Total | 577 sq mi (1,490 km2) |
| • Land | 572 sq mi (1,480 km2) |
| • Water | 5.4 sq mi (14 km2) 0.9% |
| Population | |
| • Total | 25,996 |
| • Density | 45.4/sq mi (17.5/km2) |
| Time zone | UTC−6 (Central) |
| • Summer (DST) | UTC−5 (CDT) |
| Congressional district | 3rd |
| Website | FranklinCoKS.org |
Franklin County (county code FR) is a county in the eastern part of the U.S. state of Kansas. In 2020, 25,996 people lived there.[1] Its county seat is Ottawa. Ottawa is also the biggest city in Franklin County.[2] The county is mostly rural. It was Kansas City metropolitan area, but it no longer is since 2013.[3]
Geography[change | change source]
The U.S. Census Bureau says that the county has a total area of 577 square miles (1,490 km2). Of that, 572 square miles (1,480 km2) is land and 5.4 square miles (14 km2) (0.9%) is water.[4]
Major highways[change | change source]
People[change | change source]
| Historical population | |||
|---|---|---|---|
| Census | Pop. | %± | |
| 1860 | 3,030 | — | |
| 1870 | 10,385 | 242.7% | |
| 1880 | 16,797 | 61.7% | |
| 1890 | 20,279 | 20.7% | |
| 1900 | 21,354 | 5.3% | |
| 1910 | 20,884 | −2.2% | |
| 1920 | 21,946 | 5.1% | |
| 1930 | 22,024 | 0.4% | |
| 1940 | 20,889 | −5.2% | |
| 1950 | 19,928 | −4.6% | |
| 1960 | 19,548 | −1.9% | |
| 1970 | 20,007 | 2.3% | |
| 1980 | 22,062 | 10.3% | |
| 1990 | 21,994 | −0.3% | |
| 2000 | 24,784 | 12.7% | |
| 2010 | 25,992 | 4.9% | |
| 2020 | 25,996 | 0.0% | |
| U.S. Decennial Census[5] 1790-1960[6] 1900-1990[7] 1990-2000[8] 2010-2020[1] | |||

Franklin County is in the Ottawa, KS Micropolitan Statistical Area. It was included in the Kansas City-Overland Park-Kansas City, MO-KS Combined Statistical Area.
Government[change | change source]
Presidential elections[change | change source]
Franklin County is often carried by Republican Candidates. The last time a democratic candidate has carried Franklin County was in 1964 by Lyndon B. Johnson.
| Year | Republican | Democratic | Third Parties |
|---|---|---|---|
| 2020 | 68.0% 8,479 | 29.6% 3,690 | 2.5% 308 |
| 2016 | 64.8% 7,185 | 26.1% 2,892 | 9.1% 1,005 |
| 2012 | 63.6% 6,984 | 33.6% 3,694 | 2.8% 312 |
| 2008 | 60.0% 7,079 | 37.6% 4,433 | 2.4% 279 |
| 2004 | 64.4% 7,391 | 34.2% 3,921 | 1.4% 164 |
| 2000 | 61.4% 5,925 | 34.4% 3,321 | 4.3% 412 |
| 1996 | 50.9% 5,007 | 36.1% 3,552 | 13.0% 1,276 |
| 1992 | 37.4% 3,699 | 30.0% 2,968 | 32.5% 3,216 |
| 1988 | 56.4% 4,777 | 42.4% 3,592 | 1.1% 96 |
| 1984 | 70.6% 6,284 | 28.4% 2,523 | 1.0% 92 |
| 1980 | 62.7% 5,525 | 31.0% 2,726 | 6.3% 557 |
| 1976 | 55.5% 4,760 | 42.1% 3,607 | 2.5% 211 |
| 1972 | 72.7% 6,011 | 24.9% 2,056 | 2.4% 200 |
| 1968 | 59.2% 4,875 | 30.6% 2,524 | 10.2% 840 |
| 1964 | 45.3% 3,725 | 53.6% 4,410 | 1.1% 86 |
| 1960 | 68.2% 6,158 | 31.3% 2,824 | 0.5% 47 |
| 1956 | 71.4% 6,557 | 28.2% 2,591 | 0.4% 33 |
| 1952 | 72.9% 6,983 | 26.4% 2,532 | 0.7% 69 |
| 1948 | 58.2% 5,145 | 39.3% 3,467 | 2.5% 222 |
| 1944 | 64.7% 5,375 | 34.7% 2,880 | 0.7% 55 |
| 1940 | 63.8% 6,393 | 35.4% 3,542 | 0.9% 85 |
| 1936 | 57.0% 6,007 | 42.7% 4,503 | 0.3% 28 |
| 1932 | 50.2% 4,887 | 48.1% 4,690 | 1.7% 165 |
| 1928 | 78.4% 7,346 | 20.8% 1,951 | 0.8% 73 |
| 1924 | 67.1% 6,008 | 25.9% 2,324 | 7.0% 628 |
| 1920 | 65.2% 5,216 | 32.6% 2,606 | 2.3% 183 |
| 1916 | 45.2% 3,885 | 48.0% 4,128 | 6.8% 588 |
| 1912 | 13.8% 672 | 40.3% 1,970 | 46.0% 2,247[a] |
| 1908 | 52.7% 2,658 | 42.8% 2,155 | 4.5% 227 |
| 1904 | 62.8% 2,855 | 28.8% 1,310 | 8.3% 378 |
| 1900 | 51.6% 2,872 | 46.8% 2,605 | 1.7% 94 |
| 1896 | 44.9% 2,609 | 54.3% 3,152 | 0.8% 49 |
| 1892 | 46.1% 2,209 | 53.9% 2,587 | |
| 1888 | 50.5% 2,422 | 23.2% 1,113 | 26.3% 1,264 |
Education[change | change source]
Unified school districts[change | change source]
- West Franklin USD 287 (Web site)
- Central Heights USD 288 (Web site)
- Wellsville USD 289 (Web site)
- Ottawa USD 290 (Web site)
Colleges and universities[change | change source]
- Ottawa University, Ottawa
- Neosho County Community College (branch campus), Ottawa
Communities[change | change source]

Cities[change | change source]
References[change | change source]
- ↑ 1.0 1.1 1.2 "QuickFacts: Franklin County, Kansas". United States Census Bureau. Retrieved October 1, 2023.
- ↑ "Find a County". National Association of Counties. Archived from the original on 2011-05-31. Retrieved 2011-06-07.
- ↑ "Statistical Areas". Archived from the original on 2014-09-16. Retrieved 2019-02-03.
- ↑ "US Gazetteer files: 2010, 2000, and 1990". United States Census Bureau. 2011-02-12. Retrieved 2011-04-23.
- ↑ "U.S. Decennial Census". United States Census Bureau. Archived from the original on April 26, 2015. Retrieved July 24, 2014.
- ↑ "Historical Census Browser". University of Virginia Library. Archived from the original on May 30, 2019. Retrieved July 24, 2014.
- ↑ "Population of Counties by Decennial Census: 1900 to 1990". United States Census Bureau. Retrieved July 24, 2014.
- ↑ "Census 2000 PHC-T-4. Ranking Tables for Counties: 1990 and 2000" (PDF). United States Census Bureau. Retrieved July 24, 2014.
- ↑ Leip, David. "Dave Leip's Atlas of U.S. Presidential Elections". uselectionatlas.org.
- Notes
- ↑ This total comprises 1,971 votes (40.31 percent) for Progressive Theodore Roosevelt (who carried the county) and 276 votes (5.65 percent) for Socialist Eugene V. Debs.
More reading[change | change source]
- Standard Atlas of Franklin County, Kansas; Geo. A. Ogle & Co; 69 pages; 1920.
- Plat Book of Franklin County, Kansas; North West Publishing Co; 36 pages; 1903.
Other websites[change | change source]
- County
- Historical
- Maps
- Franklin County Maps: Current, Historic, KDOT
- Kansas Highway Maps: Current, Historic, KDOT
- Kansas Railroad Maps: Current, 1996, 1915, KDOT and Kansas Historical Society
Municipalities and communities of Franklin County, Kansas, United States | ||
|---|---|---|
| Cities | 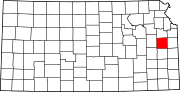 | |
| Unincorporated communities | ||
| Ghost towns | ||
| Townships | ||
| Footnotes | †This community is designated a Census-Designated Place (CDP) by the United States Census Bureau. | |
Kansas City metropolitan area's cities and counties | ||
|---|---|---|
| Central city |  | |
| Largest cities (over 100,000 in 2020) | ||
| Medium-sized cities (10,000 to 100,000 in 2020) | ||
| Smaller Cities (between 5,000 and 10,000 in 2020) | ||
| Counties | ||

| International | |
|---|---|
| National | |
| Other | |
38°35′N 95°17′W / 38.583°N 95.283°W