Remote Sensing | Free Full-Text | Comparison of Cloud Structures of Storms Producing Lightning at Different Distance Based on Five Years Measurements of a Doppler Polarimetric Vertical Cloud Profiler
Article

Comparison of Cloud Structures of Storms Producing Lightning at Different Distance Based on Five Years Measurements of a Doppler Polarimetric Vertical Cloud Profiler

1
Institute of Atmospheric Physics, Czech Academy of Sciences, Boční II 1401, 141 00 Prague, Czech Republic
2
Faculty of Science, Charles University, Albertov 6, 128 00 Prague, Czech Republic
3
National Research Council of Italy, Institute of Atmospheric Sciences and Climate (CNR-ISAC), Via del Fosso del Cavaliere 100, 00133 Rome, Italy
*
Author to whom correspondence should be addressed.
Remote Sens. 2023, 15(11), 2874; https://doi.org/10.3390/rs15112874
Submission received: 21 April 2023 / Revised: 18 May 2023 / Accepted: 28 May 2023 / Published: 31 May 2023

Abstract

:
We processed five years of measurements (2018–2022) of a vertically pointing radar MIRA 35c at the Milešovka meteorological observatory with the aim of analyzing the cloud structure of thunderstorms and comparing differences in measured data for cases when lightning discharges were observed very close to the radar position, and for cases when lightning discharges were observed at a greater distance from the radar position. The MIRA 35c radar is a Doppler polarimetric radar working at 35 GHz (Ka-band) with a vertical resolution of 28.9 m and a time resolution of approximately 2 s. For the analysis, we considered radar data whose radar reflectivity was at least 10 dBZ at 5 km or higher above the radar to ensure that there was a cloud above the radar. We divided the radar data into “near” data (a lightning discharge was registered up to 1 km from the radar position) and “far” data (a lightning discharge was registered from 7.5 to 10 km from the radar position). We compared the following quantities: (i) Power in co-channel (pow), (ii) power in cross-channel (pow-cx), (iii) phase in co-channel (pha), (iv) phase in cross-channel (pha-cx), (v) equivalent radar reflectivity (Ze), (vi) Linear Depolarization Ratio (LDR), (vii) co-polar correlation coefficient (RHO), (viii) Doppler radial velocity (V), (ix) Doppler spectrum width (RMS), and (x) Differential phase (Phi). Pow, pow-cx, pha, pha-cx, and V are basic data measured by the radar, while Ze, LDR, RHO, RMS, and Phi are derived quantities. Our results showed that the characteristics of the compared radar quantities are clearly distinct for “near” dataset from “far” dataset. Furthermore, we found out that there is a clear evolution close to the time of discharges of the observed radar quantities in the “near” dataset, which is not that obvious in the “far” dataset.

1. Introduction

Vertically oriented cloud radars (profilers) are valuable in analyzing cloud structures. Although they measure cloud characteristics in 1D space above the radar position only, their high frequency of measurements allows monitoring and statistically describing various features of clouds, including the development of their internal structures. These radars can continuously profile clouds aloft with high temporal resolution (in the order of seconds), thus they provide subtle vertical cloud observations. Papers using this type of data include studies focused on the characteristics of vertical wind speed, e.g., [1,2] or cloud microphysics, e.g., [2,3,4,5,6,7,8,9].
One of the interesting features of polarimetric radars is that they implicitly indicate the electric field in clouds. Strong electric fields align ice particles which modify some of the quantities measured by polarimetric radars. The fact that the strong electric fields change the optical properties of clouds by aligning ice crystals has been observed in the last century [10] and referred works. These optical properties are also reflected in some of the measured quantities by polarimetric radars. However, the influence of the electric field on measurements is not clearly visible in every quantity but can be indicated by the evaluation of a set of quantities [11]. This interesting feature of polarimetric radars has motivated our study.
This study builds on our previous work by Sokol and Popová [12], which analyzed the cloud structure of several thunderstorms. The study used a novel approach and compared selected quantities measured by a vertically oriented cloud radar for lightning discharges that occurred near the radar position vs. far from the radar position. The authors concluded that the radar quantities may suggest if a discharge is expected near or far from the radar position, however, the dataset of analyzed storms was relatively small to permit robust results.
In this study, similarly to Sokol and Popová [12], we analyze measurements of a Doppler polarimetric cloud radar operating at a frequency of 35 GHz, which is located at the Milešovka meteorological observatory. We also focus on cloud characteristics of thunderstorms, which produced electrical discharges in the vicinity of the radar. As compared to our previous work, we analyze more radar quantities to describe cloud structures, and we use a much larger dataset (five years of radar observations). The specific objective is to compare the differences between the internal cloud structures for convective storms when a discharge was registered near the radar as compared to convective storms when a discharge was registered at a greater distance from the radar. This is a new approach that we used in our previous study as well, though we use different techniques and perform much deeper analyses in this paper.
The paper is organized as follows. After this introductory Section 1, Section 2 describes the Milešovka meteorological observatory and the vertically oriented cloud radar together with the data the radar records and we analyze. This section also contains information on discharge measurements used for discretization of thunderstorms. Processing and preparation of radar data are given in Section 3, and results of differences among radar quantities for storms producing lightning near or far from the radar are presented in this section. Section 4 concludes the study.

2. Data and Methods

2.1. Milešovka Meteorological Observatory

The Milešovka meteorological observatory (50°33′17″N, 13°55′57″E, 837 m a.s.l., Figure 1) is located in the northern part of the Czech Republic at the top of the Milešovka mountain. It is situated in the mountainous area called the Czech Central Highlands, with the height of individual hills from about 500 m up to 837 m. Milešovka is the highest hill. Ore Mountains are situated north-northwest of the observatory with a height of up to 1200 m. The area in the vicinity of Milešovka is known for a relatively higher frequency of thunderstorms than in other areas of the Czech Republic.
The Milešovka meteorological observatory was founded in 1905, and since that time, it has provided continuous measurements with a 24/7 service [13]. The observatory belongs to national and international meteorological networks, and it provides routine and specific meteorological and climatological measurements.

2.2. Cloud Radar METEK

In spring 2018, the Milešovka observatory was equipped with a vertically pointing cloud radar MIRA 35c (referred to as METEK in the text) working at 35 GHz (Ka-band). It is a Doppler polarimetric radar operating with a vertical resolution of 28.9 m and a time resolution of 2 s approximately. The radar can measure up to 14 km vertically. More radar parameters can be found in Sokol et al. [14,15].
METEK broadcasts a signal at one polarization and receives the reflected signal at the same polarization (co-channel) and perpendicular polarization (cross-channel). The quantities measured/derived by the radar, which we use in this study, are the following:
  • Power in co-channel (pow) and cross-channel (pow-cx) of reflected signal [dBm]
  • Phase in co-channel (pha) and cross-channel (pha-cx) of reflected signal [deg]
  • Equivalent radar reflectivity factor (Ze [dBZ])
  • Doppler radial velocity (V [m/s]) oriented towards the radar
  • Linear Depolarization Ratio (LDR) [dB]
  • Co-polar correlation coefficient (RHO)
  • Doppler spectrum width (RMS [m/s])
  • Differential phase (Phi [deg] in range −180–180°)
The above-mentioned measured or derived quantities describe the properties of the radar volume containing hydrometeors in the cloud from different perspectives. V depends on the terminal velocity of hydrometeors but is simultaneously influenced by vertical air motion. An important characteristic is LDR, which represents the ratio of the reflected energy for vertical and horizontal polarization. Based on the LDR, the type of hydrometeor can be estimated. High LDR values correspond to hail. They also indicate a melting layer. RHO values are highly variable for Ka-band radars, and higher values usually indicate raindrops. Higher RMS values indicate that there are different types of hydrometeors with different terminal velocities in the measured volume. Phi depends on the refractive index of the hydrometeor and can be used to distinguish liquid from solid hydrometeors.

2.3. Lightning Data

We used observations of lightning data recorded by the EUCLID (European Cooperation for Lightning Detection, https://www.euclid.org/) network. That network contains records of the time (with the accuracy of ms), position, type (cloud to cloud (CC) or cloud to ground (CG)), estimated peak current (in kA including its polarity), and quality (good/bad) of registered discharges. All lightning data for the studied convective storms were of good quality.
For the purposes of this study, we used lightning data from the vicinity of the Milešovka observatory up to the distance of 10 km from May to September for the period 2018 to 2022, when we disposed of METEK measurements. Since the time resolution of radar measurements is about 2 s, we combined lightning measurements with a time resolution of 1 s to analyze them further.
The areal distribution of the total number of discharges and the number of CG discharges per km2 recorded by the EUCLID network is shown in Figure 2. The distribution of discharges is clearly inhomogeneous and is probably influenced by the complex terrain in the area. Although the analyzed data cover only 5 years of observations, the increased concentration of discharges to the west and northwest (close to towns Krupka, Dubí, and Hrob) of the Milešovka observatory (Figure 2) is consistent with the empirical experience of the population in that area. An increased concentration of discharges is located in the foothill of the Ore Mountains in the direction of prevailing flow. However, obviously, greater lightning activity is concentrated in the lowland south of the Milešovka observatory.
Figure 3 shows the distribution of sums of peak current and their polarity. Sums of positive peak currents are usually about +150 kA, but the maximum was +530 kA. The sums of negative peak currents are larger in absolute values than the sums of positive peak currents, and their maximum was −745 kA.
The frequency of lightning occurrences in individual years and months (Figure 4) is very variable. This is related to the fact that the occurrence of electrical discharges in the small area of interest (i.e., 25 km around the observatory) is such a rare phenomenon that 5 years of observations are too short period to obtain a climatological picture of it.
Figure 4 also shows the diurnal variation of the occurrence of discharges. It should be mentioned that the local time corresponds to UTC + 1 h. The figure clearly confirms the expected diurnal variation of lightning, i.e., lightning occurs in the afternoon and especially in the early evening. On the other hand, individual thunderstorms can occur throughout the day.

2.4. Preparation of Radar Data and Their Processing

Measurements of weather radars are, in general, burdened with a number of errors [16]. It is necessary to realize that the measurements themselves have a stochastic character (two measurements of the same target do not give identical values), which has to be considered during the initial processing of measured data. Cloud radar measurements can be affected by errors and variability of measured data more than the measurements of standard operational S- or C-band radars. This is also related to the higher spatial and temporal resolution of cloud radars.
Ka-band radar measurements (excluding LDR and Phi) are influenced by attenuation, and our experience with METEK measurements shows that the results are very strongly affected by attenuation in some cases. For instance, we recorded storms passing over the Milešovka observatory when the intensity of the rain caused such a degradation of the received signal that the usable data reached a height of only a few hundred meters above the radar [14]. That is why we selected data (the selection is described below) that are not fundamentally degraded by attenuation, and, therefore, the total number of useful pieces of radar data is lower than the number of storms with lightning recorded by the EUCLID network. We analyzed further only these selected data.
In this study, we deal with the characteristics of clouds in thunderstorms with the aim of identifying differences in cloud structures. We compare cloud structures, when electric discharges occurred nearby the station, and cloud structures, when electric discharges were not recorded nearby the station but farther. To do this, we analyze and compare two cases (sets of radar data): (i) Electrical discharges were registered near the radar (i.e., “near” dataset denoted ND), and (ii) discharges occurred, but at a sufficient distance from the radar (i.e., “far” dataset denoted FD). In both cases, we rely on the occurrence of lightning. This is motivated by the fact that the occurrence of lightning indicates deep convection, i.e., our research focus.
Results of the analysis of ND and FD might be influenced by the way ND and FD were defined. The data division into ND and FD cannot be completely objective, which is due, among other things, to the great variability of storms and their internal structures. This makes the radar measure a great variety of values. Our method of dividing data into ND and FD is based on a series of tests. When choosing it, we considered the following:
  • We are aware that the determination of the localization of lightning is inaccurate with an error that may be around 1 km in the case of CC discharges, which significantly predominate (about 85%) over CG discharges that are usually located more accurately. We divide data in the way that ND and FD are clearly separated.
  • Since ND dataset is usually smaller than FD, we need a reasonable number of ND to get sufficiently robust results. Therefore, the radius around the radar selecting ND must not be too small. Conversely, the use of too long distance will cause the data to no longer be characteristic.
  • When selecting data, it is also necessary to avoid cases when there is no storm/cloud above the radar. In the data, we had cases when a discharge was recorded at a distance of only several hundred meters from the radar but, above the radar, there was a low cloud with its top below 2 km. Based on tests, we applied a condition that we consider only those data with Ze > 10 dBZ at the height of 5 km or higher above the radar.
  • During thunderstorms, lightning often occurs almost simultaneously at different distances from the radar. In order not to include data in both ND and FD datasets simultaneously, we first determine ND, and then we select FD so that it differs from ND by at least 5 min.
  • We are aware that in the case of FD, we do not know exactly where we are in terms of the storm center. The measured data may be at both the front and the back side of the storm or at the lateral sides of the storm. We neglected this information in the study.
Measured/derived vertical profiles by METEK have a resolution of about 29 m. One vertical profile usually contains 200 values or more. At the same time, due to the great variability of cloud structures, the profiles of various storms differ, and, therefore, it is difficult to compare these profiles with each other and to characterize them in a simplistic way. To reduce and partly smooth the data, we simplify each profile by connecting 5 neighboring gate values into one-unit grid. We calculate mean, median, and minimum and maximum, values for the grids and evaluate them. Our testing has shown that five gates are a reasonable compromise between the simplification and the smoothing of vertical profiles in order not to lose too many details about the data. After this simplification, a grid value represents approximately 150 m high level, and the profile consists of 95 values at the most.
In the following text, we will use medians. Our tests showed that medians give similar values as means in most cases, however, since we also study the variability of the measured variables using other quantiles, it is appropriate to use median values.
When compiling ND and FD files, we collected radar data with measurement times of 180, 120, 90, 60, 30, 3, and 1 s before the registered discharge and 1, 3, 30, 60, 90, 120, and 180 s after the registered discharge. If these terms were not available because of the approximately 2 s time step of radar data, we used terms differing less than 2 s. The purpose of considering data from different times before the discharge was registered and after the discharge was registered is to expand the dataset and to study a time dependence in the data close to discharges. It was found that data −30 to +30 s around the time of a registered discharge do not differ fundamentally, and, therefore it is reasonable to consider them together as data corresponding to the time of the discharge. We intentionally selected data from non-equidistant times because we want to have data from several measurements very close to the time of the discharge. Further, we selected data with the step of 30 s to process fewer data but we were still able to investigate the temporal evolution around the time of the discharge.
In the way described above, we compiled ND sets for radii around the radar R = 0.5, 0.7, 1, and 1.5 km. FD contain data when discharges were located at a distance of 7.5 to 10 km from the radar.
To select a suitable R defining ND, we analyzed how diverse R affects the distribution of cloud tops (CT) and the calculation of vertical profiles of Ze. CT is defined as the elevation of the highest radar gate where Ze > 4 dBZ. As shown in Figure 5, the distribution of CT heights is similar for all R in the case of ND. The only difference is that increasing R, i.e., increasing the number of data, makes the distribution smoother. Note that CT heights always exceed 5 km because we consider only measurements with Ze > 10 dBZ at 5 km or higher. The impact of diverse R on Ze is illustrated in Figure 6, which shows the median and 40th and 60th percentiles for ND and FD profiles. For all R, medians show very similar basic features for ND and FD. However, there is high variability of the data visible at 40% and 60% quantiles in the case of R = 0.5 km and R = 0.7 km in a layer from 2 to 4.5 km vertically. We observed a similar or more pronounced pattern for other radar quantities than Ze, therefore, we defined ND using R = 1 km in this study (we do not use R = 1.5 km because a smaller distance is more suitable for our analysis).
Profiles corresponding to FD did not depend much on R, the dependence was found only at 11 km and above. It should be noted that FD does not depend on R directly because the selection of FD depends more on the time of selected ND (see point (ii) above).

3. Results and Discussion

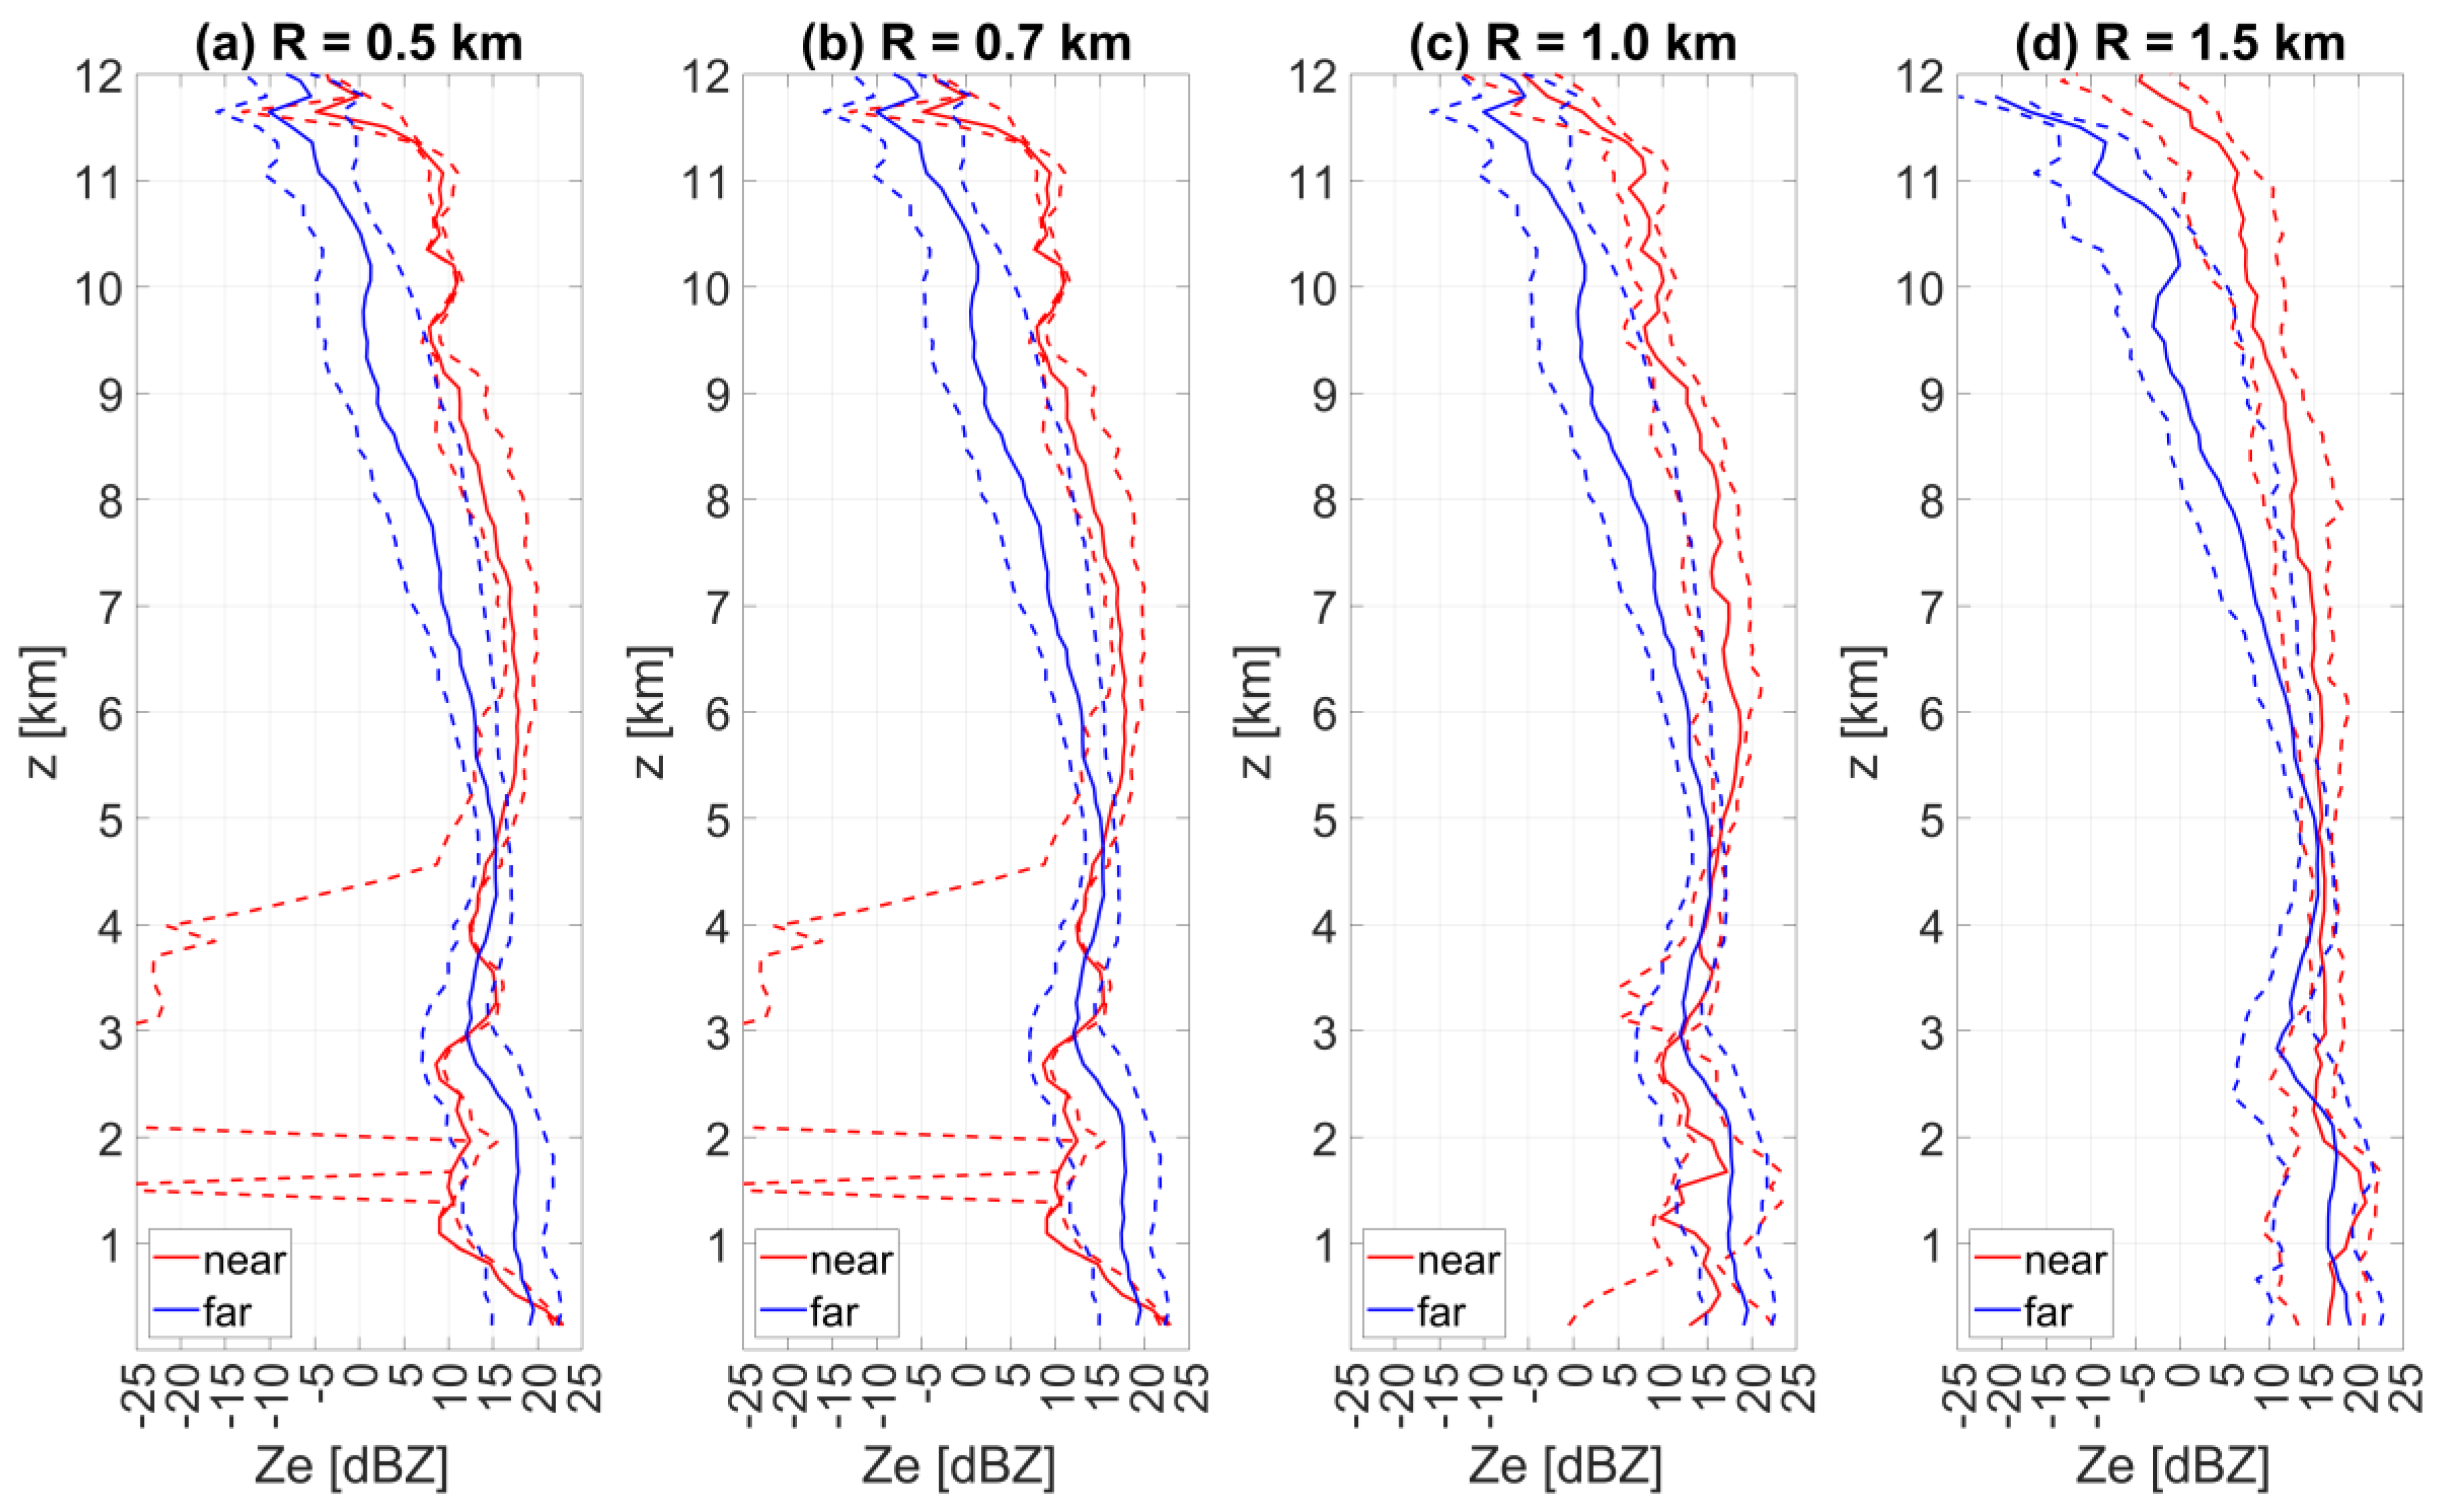
3.1. Comparison of Vertical Profiles of Radar Quantities for ND and FD Close to the Discharge Time

In this section, we compare vertical profiles of medians, 40% quantiles, and 60% quantiles of Ze, V, RMS, LDR, RHO, and Phi for ND and FD. We calculated these profiles very close to the discharge time, i.e., we considered profiles −3 and −1 s before the discharge and +1 and +3 s after the discharge. The number of ND and FD is given in Table 1.
Figure 7 shows that the biggest differences between ND and FD are visible at altitudes above 5 km in the case of Ze. For these altitudes, ND values are clearly higher than FD values, and the corresponding 40th and 60th percentiles do not intersect each other. This can be explained by the fact that thunderstorms producing nearby discharges more frequently contain hydrometeors with higher reflectivity (i.e., hail and raindrops) in their upper parts than thunderstorms with more distant discharges. Snow and ice and liquid hydrometeors are also present in these parts of the storm. The zero isotherm is located approximately 2.5 km above the radar during the summer months, and therefore we do not expect large amounts of rain at heights above 5 km. The presence of a mixture of hydrometeors, mainly for nearby storms, results from higher RMS values. The higher occurrence of hail and graupel also explains lower values of V because hail and raindrops have significantly higher terminal velocities (V is negative) than other hydrometeors, excluding rain, which occur in the middle and upper parts of clouds. In contrast to Ze, clearly higher negative values of V and positive values of RMS are evident from about 3 km altitude and higher for ND. Differences in RMS between ND and FD are noticeable, and thus the 40th and 60th percentiles corresponding to ND and FD, respectively, do not intersect each other in large parts of the vertical profile from 5 km upwards. In the case of V, the 40th and 60th percentiles do not intersect each other in the layer from 3.5 to 6.5 km vertically.
The higher Ze for FD than for ND at lower altitudes can be explained by the fact that lightning usually precedes precipitation. However, this explanation does not support larger values of V for ND than for FD at these altitudes. A hypothetical explanation could be that, as a rule, at the beginning of heavy precipitation, individual large raindrops or hail fall. Due to the very low concentration of these hydrometeors, the radar volume has a lower reflectivity than standard heavy precipitation but with a high terminal velocity. However, we cannot support this hypothesis with data. Distant flashes may indicate that above the radar site, the storm is in the mature phase.
LDR values for ND are clearly larger than LDR for FD at altitudes from about 3.5 to 9.5 km. The larger LDR values indicate the occurrence of large ice particles (hail and graupel) in clouds or the alignment of ice crystals in a strong electric field. Similar to other radar variables, RHO values for ND differ from those for FD at 3 km and above. However, in this case, the 40th and 60th percentiles intersect due to the large variability of RHO.
Median Phi values are clearly different for ND as compared to FD. Phi values are highly variable and range from −159° to 172° in our data with a very high frequency of 0°. That is why the resulting median values are sometimes equal to 0°. When we used means instead of medians (not depicted), then Phi values for ND were non-zero at altitudes from 2 to 6.5 km approximately. However, the overall vertical profile was very similar.
Median Phi values for ND are positive at altitudes around 3.5 and 6 km, while they are frequently zero for FD (or very small in case of calculation of means). Interpreting this result is not straightforward. It is known that Phi values are generally very variable in space, and their variability is reduced only in areas with a strong electric field [11]. In our case, we dispose of only vertical data, which we statistically process using medians. From the analysis of the measured values, it can be concluded that zero value indicates that there is no information at the grid point and that the received signal was probably not strong enough. Phi values are highly variable over time, and there are significant jumps in the measurements, which may be influenced by a wet antenna. Water droplets on the reflector and on the feed window add a phase shift which sometimes differs in co-channel and cross-channel. Based on this information, one should use and interpret Phi with great caution.
Overall, the parts of the convective storms where electrical discharges occur (i.e., ND, contain larger amounts of hail and raindrops than those where discharges do not occur (i.e., FD). At the same time, higher RMS values indicate greater variability of hydrometeors in ND as compared to FD. This indirectly agrees with the theory of charge separation by collisions in the process of cloud electrification.
Similar to Figure 7, Figure 8 shows medians and 40% and 60% quantiles for ND and FD, but for pow, pow-cx, pha, and pha-cx. It should be noted that the number of data depicted in Figure 8 is much larger than the number of data used in Figure 7. Pow, pow-cx, pha, and pha-cx are noise non-adjusted direct data, which are measured for almost every term of measurement. This means that the data include values where noise was lower than the prescribed threshold of signal-to-noise ratio. However, since ND and FD are affected by the noise in the same manner, we believe that the comparison between them is reasonable despite the inclusion of noise-affected values.
Differences between ND and FD (Figure 8) are obvious for all compared radar quantities, at least at some elevations. It should be noted that the spread of data of pow and pow-cx is quite small in the case of ND. Values of pow and pow-cx for ND are higher than those for FD at the altitude of 5 km and above, which is in good agreement with the findings related to Ze (Figure 7). It also confirms the occurrence of large hydrometeors in the middle and upper parts of thunderstorms. On the contrary, lower values of pow and pow-cx for ND, as compared to those for FD at altitudes below 3 km, correspond to the behavior of Ze because lower values of pow and pow-cx for ND are related to higher values of V. The hypothetical explanation is the same as for Ze.
Differences between the ND and FD for pha and pha-cx are smaller than for pow and pow-cx. Higher pha values suggest that there is a higher occurrence of ice hydrometeors because ice has a lower refractivity index. ND have clearly higher pha values in the upper parts of storms at altitudes above 9 km. Pha-cx values are almost an order of magnitude lower than pha values, and the highest difference between ND and FD is found at about 6 km. High pha-cx values for both ND and FD at around 2 km correspond to the existence of the melting layer at this altitude.
As follows from Figure 7 and Figure 8, the structure of the storms differs in compared characteristics for ND and FD. Although the differences of median values are visually obvious, their statistical significance is usually around 0.6 due to the large variability of storms and that at some vertical layers.

3.2. Comparison of Vertical Profiles for ND and FD before and after Discharges

In this section, we analyze ND and FD in terms of their dependence on the time of measurement before or after a registered discharge. As mentioned above, radar data measurements with a time step of 2 s differ little from each other. On the other hand, radar data with a time difference of a few tens of seconds differ significantly from each other. We averaged measurements 60, 90, 120, and 180 s before a discharge occurred (dataset called “before”), and we averaged measurements 60, 90, 120, and 180 s after the discharge occurred (dataset called “after”) to calculate tendencies. If data from these terms were not available, we used data from the closest term, which differed by a maximum of 2 s. We compared “before” with “after”, and with “T = 0” for both ND and FD, where “T = 0” corresponds to profiles of the closest time to the registered discharge. When comparing the tendencies, we focused on vertically extensive areas where the curves for ND and FD data did not intersect. We suppose that in other areas, the tendencies are not reliably determined by our analysis or simply do not exist.
Figure 9 shows the results for Ze, V, RMS, LDR, RHO, and Phi. Figure 10 shows the results for pow, pha, pow-cx, and pha-cx. In both figures, we can see a noticeable evolution of the radar data depending on the occurrence of lightning. As expected, more pronounced changes are in ND, though an evolution can be seen in Ze and LDR values for FD.
In Figure 9, the dependence of Ze, V, LDR, and RHO is evident regardless of whether they are measured before or after discharges. Although some relationships between the evolutions of variables are evident in Figure 9, the explanation is ambiguous because the values of the measured variables can be influenced by a number of factors.
Ze values clearly increase after a discharge in the middle part of the troposphere, around 7–11 km. At 7–8.5 km, there is also a noticeable increase in the absolute value of V with time. Those two findings can be explained by the formation of hail and the appearance of raindrops, which have a higher reflectivity and also a higher terminal velocity. The values of V are certainly affected by the vertical air velocity in the storm, but since the profiles do not differ significantly in time from each other, we think that the vertical air velocity cannot fundamentally influence the calculated trend. However, the fact that the curves for “before”, “T = 0”, and “after” change in some cases the order of V demonstrates that the vertical air velocity is significant, which is consistent with general knowledge of convective storms.
It is important to note that although the basic characteristics of convective storms are similar, they differ in detail, e.g., the core of the storm is at different heights, and, therefore, the structure of vertical velocities is different, which affects the average characteristics presented in this paper. The dynamics of storm development are evident from the vertical RMS profiles, which characterize the mixture of hydrometeors at given heights. Higher velocities which are visible from 4 to 10 km indicate that the hydrometeor mixture contains hydrometeors of different terminal velocities.
The vertical profile of LDR shows a clear decrease in values at altitudes between 3 and 7 km. This, when compared to the relatively low values of Ze and the unclear trend of V, can probably be attributed to the influence of the electric field that aligns the ice crystals in the cloud, which increases the LDR values [10,11]. At about the same altitudes, there is a clear difference among RHO values. The increase in RHO values after discharges is difficult to explain because its behavior depends on many factors. According to Melnikov et al. [11], high RHO values together with high LDR values and homogeneous values of Phi indicate a strong electric field, which causes the ice crystals to align. A strong electric field should be observed before the discharge, which is not consistent with Figure 9e. It is worth noting that contrary to other quantities, only profiles of RHO for ND are qualitatively similar to that for FD. Our possible explanation is that before and during the discharge, the hydrometeor distribution is highly variable due to intense turbulent motions, therefore, the RHO is low. After the discharge, RHO values increase with calming down of the turbulent motions.
It is difficult to make any statement about Phi values. Panels f and l in Figure 9 only confirm the results from Section 3.1, i.e., there is a significant difference between Phi values for ND as compared to FD with ND giving clearly higher Phi values.
The differences between ND and FD are obvious, except for RHO. In the case of Ze and LDR, the differences are visible, and the tendencies are opposite to those for ND. In general, the profiles for FD show significantly smoother and less pronounced tendencies compared to ND. This can be attributed to the fact that there are much more data in FD, and the measured data do not come from the storm center. The significant decrease in Ze over time at altitudes above 5 km is due to the decreasing activity of the storm development. The melting layer is visible in LDR for ND as well as for FD. The melting layer is visible by a sharp local decrease of RHO for FD. In FD, the tendencies in V and RMS and partly in RHO are minimal compared to ND.
The time evolution of pow, pha, pow-cx, and pha-cx around the discharge is obvious (Figure 10). The distinct differences for pow and pow-cx between ND and FD are very similar to those for Ze in Figure 9 (panels a and g). This suggests that these quantities are similar. The highest tendencies are found for pha in Figure 10. Higher pha values before the discharge indicate that before the discharge, the ice phase is more represented in the storm than after the discharge. High values near the surface (up to 2 km) in pha-cx for FD and differences in pha-cx for ND are difficult to explain, and we will investigate it further in our future study.

4. Conclusions

In this study, we used five years of measurements (2018–2022) of cloud radar METEK located at the Milešovka meteorological observatory. METEK is a vertically pointing Doppler polarimetric radar working at 35 GHz (Ka-band) with a vertical resolution of 28.9 m and a time resolution of 2 s. We analyzed the cloud structure of thunderstorms and found differences in measured data for cases when lightning was observed very close to the observatory and for cases when lightning was observed in a further distance from the observatory.
We divided data into ND (discharge up to 1 km from the radar) and FD (discharge 7.5 to 10 km from the radar), meeting a condition that the radar reflectivity Ze > 10 dBZ at 5 km or higher above the radar. This ensured that there was a cloud above the radar. We calculated simplified vertical profiles of selected radar quantities consisting of vertical grid points representing vertical intervals of approximately 150 m for each term and then calculated profiles for ND and FD using median and compared them. We compared profiles of pow, pow-cx, pha, pha-cx, Ze, LDR, RHO, W, and Phi for ND and FD corresponding to the time of discharges, and we examined tendencies of analyzed quantities before and after discharges. The obtained results can be summarized as follows:
  • The structure of the storms differs in all compared characteristics depending on the discharge distance. The difference is not only in the time of the discharge but also when comparing the tendencies of the variables just before and after the registered discharge. Although the differences are visually obvious, their statistical significance is usually around 0.6 due to the large variability of storms.
  • The main differences in variables between ND and FD are seen at altitudes from 4 to 10 km. The interpretation of some differences is not straightforward because the measured quantities are influenced by various factors.
  • Comparing the vertical profiles for ND, the data clearly give higher Ze and LDR in the middle and upper troposphere, indicating the presence of hail and raindrops. Higher Doppler radial velocity in absolute value is consistent with this. The increase in RMS values indirectly confirms that the storm is in its active phase and contains a mixture of various hydrometeors. This is also consistent with lower RHO values as compared to that of FD.
  • Phi values differ substantially between ND and FD in some parts of the vertical profile. However, these data have a completely different character and properties than the other variables. There is a large number of zero values in the measured data, and the values vary widely from one vertical level to another. Therefore, the applied method of their evaluation is not suitable as it frequently leads to null values in the profile. The possibility of using Phi measured by a vertical cloud radar for cloud structure analysis needs to be addressed in further research.
  • When comparing pow, the differences between ND and FD are similar to those in the case of Ze. This is not surprising. Significant differences in pha at altitudes above 10 km are difficult to explain. This may be due to the small amount of ND and of data at that altitude. Significant differences in pha-cx at altitudes around 6 km are also difficult to explain as it is not seen in pha.
  • The time evolution of the quantities is clear in the order of tens of s. The time evolution of ND differs from that of FD. The time evolution is clearly more pronounced for ND.
  • In ND, Ze increases close to the time of the discharge, and V increases in absolute value in the middle and upper troposphere, i.e., where large hydrometeors such as hail and water droplets increase in concentration. In FD, it is the opposite. For ND, the vertical profiles of Ze, V, and LDR show that after the discharge, the convective storm continues to grow for at least some time. The discharges do not represent the end of storm development.
  • An opposite trend between ND and FD is observed in the case of LDR. Higher pre-discharge LDR values for ND at altitudes around 6 km, together with rather lower Ze values, can be attributed to the presence of the electric field and its influence on the organization of ice crystals.
  • In general, there is a noticeable difference in the trends between ND and FD. Near discharges clearly indicate the active part of the storm, which evolves quickly in time. The time evolution of FD is small compared to ND.
  • In our previous work [12], we expressed the possibility of using a similarly performed analysis of radar data for the classification of a convective storm in terms of the occurrence of lightning in the close vicinity of the radar position. This study does not explicitly address this application, but the results also showed that some of the observed characteristics derived from the radar data differ for lightning storms that occur in the immediate vicinity of the radar versus storms where the lightning is farther from the radar. However, due to the small frequency of the occurrence of lightning near the radar, the obtained results are still burdened with considerable uncertainty even if we use five years of measurements.
  • We cannot directly compare the obtained results with the results of other works, as we did not find any similar studies which would use a similar technique of storm analysis using radar data. This study presents a relatively new view on the internal structure of storms and on their development in connection with the occurrence of lightning. This adds new information to the knowledge of thunderstorms.

Author Contributions

Conceptualization, Z.S., J.P. and K.S.; Formal analysis, K.S., R.C.T. and S.F.; Methodology, Z.S. and J.P.; Software, Z.S.; Validation, S.F.; Visualization, Z.S. and K.S.; Writing—original draft, Z.S.; Writing—review & editing, J.P., R.C.T. and S.F. and O.F. All authors have read and agreed to the published version of the manuscript.

Funding

This research was funded by CRREAT (reg. number: CZ.02.1.01/0.0/0.0/15_003/0000481) call number 02_15_003 of the Operational Programme Research, Development, and Education; by the Charles University project UNCE/HUM 018, the project Strategy AV21 Water for Life; the Mobility Plus project CNR-22–25, and the project “Improving the short-term forecast of convective events using the Meteosat Third Generation observations over Europe” Bilateral Agreement CNR/CAS 2022–2024 ID: 16962.

Data Availability Statement

Data are available from the authors upon request.

Acknowledgments

We acknowledge Petr Pešice and Matthias Bauer-Pfundstein for technical support and maintenance of the radar METEK.

Conflicts of Interest

The authors declare no conflict of interest.

References

  1. Shupe, M.D.; Kollias, P.; Poellot, M.; Eloranta, E. On Deriving Vertical Air Motions from Cloud Radar Doppler Spectra. J. Atmos. Ocean. Technol. 2008, 25, 547–557. [Google Scholar] [CrossRef]
  2. Zheng, J.; Liu, L.; Chen, H.; Gou, Y.; Che, Y.; Xu, H.; Li, Q. Characteristics of Warm Clouds and Precipitation in South China during the Pre-Flood Season Using Datasets from a Cloud Radar, a Ceilometer, and a Disdrometer. Remote Sens. 2019, 11, 3045. [Google Scholar] [CrossRef]
  3. Clothiaux, E.E.; Miller, M.A.; Albrecht, B.A.; Ackerman, T.P.; Verlinde, J.; Babb, D.M.; Peters, R.M.; Syrett, W.J. An Evaluation of a 94-GHz Radar for Remote Sensing of Cloud Properties. J. Atmos. Ocean. Technol. 1995, 12, 201–229. [Google Scholar] [CrossRef]
  4. Kollias, P. Cloud Radar Observations of Vertical Drafts and Microphysics in Convective Rain. J. Geophys. Res. 2003, 108, 4053. [Google Scholar] [CrossRef]
  5. Kollias, P.; Szyrmer, W.; Rémillard, J.; Luke, E. Cloud Radar Doppler Spectra in Drizzling Stratiform Clouds: 2. Observations and Microphysical Modeling of Drizzle Evolution. J. Geophys. Res. 2011, 116, D13203. [Google Scholar] [CrossRef]
  6. Illingworth, A.J.; Hogan, R.J.; O’Connor, E.J.; Bouniol, D.; Brooks, M.E.; Delanoé, J.; Donovan, D.P.; Eastment, J.D.; Gaussiat, N.; Goddard, J.W.F.; et al. Cloudnet. Bull. Am. Meteorol. Soc. 2007, 88, 883–898. [Google Scholar] [CrossRef]
  7. Ulrich, G.; Volker, L.; Matthias, B.-P.; Gerhard, P.; Dmytro, V.; Vladimir, V.; Vadim, V. A 35-GHz Polarimetric Doppler Radar for Long-Term Observations of Cloud Parameters—Description of System and Data Processing. J. Atmos. Ocean. Technol. 2015, 32, 675–690. [Google Scholar] [CrossRef]
  8. Kollias, P.; Luke, E.; Rémillard, J.; Szyrmer, W. Cloud Radar Doppler Spectra in Drizzling Stratiform Clouds: 1. Forward Modeling and Remote Sensing Applications. J. Geophys. Res. 2011, 116, D13201. [Google Scholar] [CrossRef]
  9. Gonzalez, S.; Bech, J.; Udina, M.; Codina, B.; Paci, A.; Trapero, L. Decoupling between Precipitation Processes and Mountain Wave Induced Circulations Observed with a Vertically Pointing K-Band Doppler Radar. Remote Sens. 2019, 11, 1034. [Google Scholar] [CrossRef]
  10. Vonnegut, B. Orientation of Ice Crystals in the Electric Field of a Thunderstorm. Weather 1965, 20, 310–312. [Google Scholar] [CrossRef]
  11. Melnikov, V.; Zrnić, D.S.; Weber, M.E.; Fierro, A.O.; MacGorman, D.R. Electrified Cloud Areas Observed in the SHV and LDR Radar Modes. J. Atmos. Ocean. Technol. 2019, 36, 151–159. [Google Scholar] [CrossRef]
  12. Sokol, Z.; Popová, J. Differences in Cloud Radar Phase and Power in Co- and Cross-Channel—Indicator of Lightning. Remote Sens. 2021, 13, 503. [Google Scholar] [CrossRef]
  13. Štekl, J.; Podzimek, J. Old Mountain Meteorological Station Milesovka (Donnersberg) in Central Europe. Bull. Am. Meteorol. Soc. 1993, 74, 831–834. [Google Scholar] [CrossRef]
  14. Sokol, Z.; Minářová, J.; Novák, P. Classification of Hydrometeors Using Measurements of the Ka-Band Cloud Radar Installed at the Milešovka Mountain (Central Europe). Remote Sens. 2018, 10, 1674. [Google Scholar] [CrossRef]
  15. Sokol, Z.; Minářová, J.; Fišer, O. Hydrometeor Distribution and Linear Depolarization Ratio in Thunderstorms. Remote Sens. 2020, 12, 2144. [Google Scholar] [CrossRef]
  16. Sokol, Z.; Szturc, J.; Orellana-Alvear, J.; Popová, J.; Jurczyk, A.; Célleri, R. The Role of Weather Radar in Rainfall Estimation and Its Application in Meteorological and Hydrological Modelling—A Review. Remote Sens. 2021, 13, 351. [Google Scholar] [CrossRef]
Figure 1. Milešovka meteorological observatory.
Remotesensing 15 02874 g001
Figure 2. Total number of discharges per km2 (a) and the number of CG discharges per km2 (b) recorded by the EUCLID network up to 25 km from the Milešovka observatory (black rhomb) from May to September during 2018–2022. Panel (c) shows a topographic map of the region.
Remotesensing 15 02874 g002
Figure 3. Distribution of sums of peak currents for positive discharges (a) and for negative discharges (b) in absolute values (2018–2022), respectively.
Remotesensing 15 02874 g003
Figure 4. Total number of discharges in individual years (a) and months (b), and diurnal variation of discharges (c). The numbers given above in the columns show the number of ND data used in the analysis (see Section 2.4 onwards) for the corresponding years, months, and hours.
Remotesensing 15 02874 g004
Figure 5. Distribution of CT heights of ND (defined by a discharge observed at a distance R = 0.5 km (a), 0.7 km (b), 1 km (c), and 1.5 km (d) from the radar, respectively) and of FD. N [%] is the number of cases.
Remotesensing 15 02874 g005
Figure 6. Vertical profiles of Ze for ND (near, defined by a discharge observed at a distance R = 0.5 km (a), 0.7 km (b), 1 km (c), and 1.5 km (d) from the radar, respectively) and for FD (far). Solid lines show median, while dashed lines show 40th and 60th percentiles as dependent on R.
Remotesensing 15 02874 g006
Figure 7. Medians (solid lines), 40% quantiles, and 60% quantiles (dashed lines) of Ze, V, RMS, LDR, and RHO for ND (near) and FD (far).
Remotesensing 15 02874 g007
Figure 8. Medians (solid lines), 40% quantiles, and 60% quantiles (dashed lines) of pow, pha, pow-cx, and pha-cx for ND (near) and FD (far).
Remotesensing 15 02874 g008
Figure 9. Medians of vertical profiles of Ze (a,g), V (b,h), RMS (c,i), LDR (d,j), RHO (e,k), and Phi (f,l) before, after and at (T = 0) recorded discharges for ND (upper panels) and FD (lower panels).
Remotesensing 15 02874 g009
Figure 10. Medians of vertical profiles of pow, pha, pow-cx, and pha-cx before, after, and at (T = 0) recorded discharges for ND (a) upper panels and FD (b) lower panels.
Remotesensing 15 02874 g010
Table 1. Number (N) of ND and FD for radar quantities (Ze, V, RMS, LDR, RHO, and Phi) at the altitude of 6 km. ND max. altitude and FD max. altitude show maximum altitudes where at least one radar record was available, respectively.
VariableAltitude [km]ND Max. Altitude [km]FD Max. Altitude [km]ND: N
(R = 1 km)
FD: N
(R = 7.5–10 km)
Ze612.512.7351096
V612.512.235781
RMS612.712.7351095
LDR610.610.8351027
RHO610.29.835879
Phi611.29.835870
Disclaimer/Publisher’s Note: The statements, opinions and data contained in all publications are solely those of the individual author(s) and contributor(s) and not of MDPI and/or the editor(s). MDPI and/or the editor(s) disclaim responsibility for any injury to people or property resulting from any ideas, methods, instructions or products referred to in the content.

