Gage R&R: the Easiest Gage R&R Template to Use in the World! 【Excel Template】

Today’s topic is Gage R&R, the most common method in MSA. This article explains a very difficult topic in an easy-to-understand manner on an Excel Template.
(Duration: 7:19)
DOWNLOAD ← Click this to download the “Gage R&R Using ANOVA” template file.
Why do we need MSA: Measurement System Analysis in Data Analyses?
Hi, this is Mike Negami, Lean Sigma Black Belt.
This time I received a video request from one of our viewers.
“Please make a video on calibration?”
“Calibration on Measuring gauges sir.”
Thanks, sekhar. Calibration is to adjust the read-out deviations of measuring devices.
It’s important to work on things scientifically, based on data. This is especially true in Lean Sigma and SPC: Statistical Process Control.
However, what if those data are wrong? All decisions based on those data would be mistakes and they will most likely cause failures. So, for SPC, it’s an imperative practice to ensure that you are collecting the correct data.
Therefore, in SPC, we use MSA – Measurement System Analysis. I made an article about this topic in the past, so please click on the link below and read the article. ⇒”What’s SPC (Statistical Process Control) and MSA (Measurement System Analysis)?”
How Gage R&R is used in Business
I’ll introduce Gage R&R, the most common method of MSA. I’ll explain a very difficult topic in an easy-to-understand manner without using any formulas. I made an Excel template, so I’ll explain this topic along with the template.
When you conduct the Gage R&R, you can see if there is a problem with the operator or measuring device in your measurement system. If it’s your measuring device, you need to calibrate it.
The method of calibration depends on each device. Also, depending on your industry, you may have a set standardization. For component manufacturing companies, their clients may require them to submit proof of their MSA. At that time, they may submit their records of Gage R&R. Let’s look at the Gage R&R template now.
Decide the measurement standard and start measurements using the Gage R&R Excel template.
Click the link below to download the Gage R&R template.
DOWNLOAD ← Click this to download the “Gage R&R Using ANOVA” template file.
On the right side of the template, it shows the instructions for how to conduct the Gage R&R analysis.

First, decide the measurement standard. Usually three appraisers measure ten different parts 3 times each, but you may need to change that according to your industry or customer’s request. When choosing your parts, it may sound strange, but choose the parts so as to increase their variation. If your parts didn’t have enough variation and your measurements were all about the same, your analysis result would look worse than it actually is. The purpose here is not to make good products, but to find the good or bad of your measurement method. Also, have the people who normally do the job be the appraisers here.
Next, have the appraisers measure each part in random order, and input all measurements into the “Sampling Measurement Results” section. I’ll copy and paste my sample data here. Then the calculation results are already done below. Let Excel do the difficult calculations. Here is a data entry example below:

What’s Gage R&R’s ‘Repeatability’ and ‘Reproducibility’?
Gage R&R’s ‘R&R’ stands for ‘Repeatability’ and ‘Reproducibility’. For example, if the same appraisers measure the same parts with the same measuring devises, they should get the same measurements. However, if that’s not the case, its ‘Repeatability’ is bad. Also, we’ll consider their total variation as ‘Repeatability’.

If other appraisers measure the same parts, they are supposed to obtain the same measurements as well. If that’s not the case, its ‘Reproducibility’ is bad. We’ll consider that variation among the appraisers’ averages as Reproducibility.

Gage R&R’s Results and How to Interpret them
There are a few kinds of Gage R&R. This template uses ANOVA – Analysis of Variance. Generally speaking, this method is the most accurate.
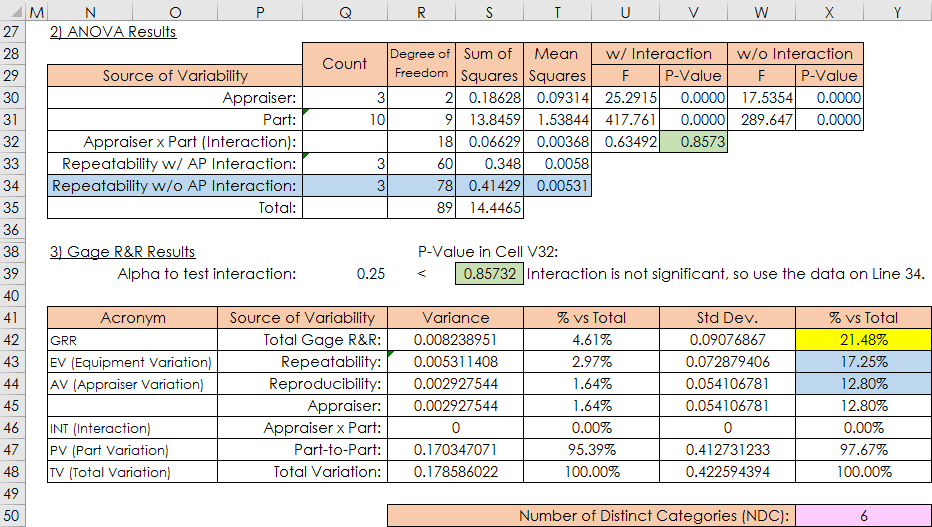
The 1st table in the image above is the result of ANOVA and the 2nd one is Gage R&R. I’ll give you a very rough explanation of what they have done. The sum of the variations of Repeatability and Reproducibility is called the Total Gage R&R. Then, by comparing it with the total variation, this appraises your measurement system as good or bad.

The last section in the image above, ‘Statistical Interpretation’ is the most important. It says 21.48% in yellow Cell P54. It means that the variation of your measurement system accounts for 21.48% against the total variation. The guidelines for each KPI are shown in the instructions, and each result is given in Cell O55 too.
If it’s under 10%, your measurement system is acceptable, but if it’s 10% or more, you must improve it. In that case, Cells X43 and X44 turn blue. You should compare Repeatability and Reproducibility there. In this example, since the variation of Repeatability is higher, the advice given below is “Your measuring equipment may need calibration or maintenance.”
Lastly from the result of the pink Cell P59, you are getting other advice. If this number is 5 or more, this analysis is reliable at this time. But, if it’s 4 or less, the parts you used didn’t have enough variation. Use another set of parts.
We discussed MSA‘s Gage R&R today.
「こちらの記事も読まれてます。」