Money
Visualizing Wealth Distribution in America (1990-2023)
![]() See this visualization first on the Voronoi app.
See this visualization first on the Voronoi app.
Visualizing Wealth Distribution in America
This was originally posted on our Voronoi app. Download the app for free on iOS or Android and discover incredible data-driven charts from a variety of trusted sources.
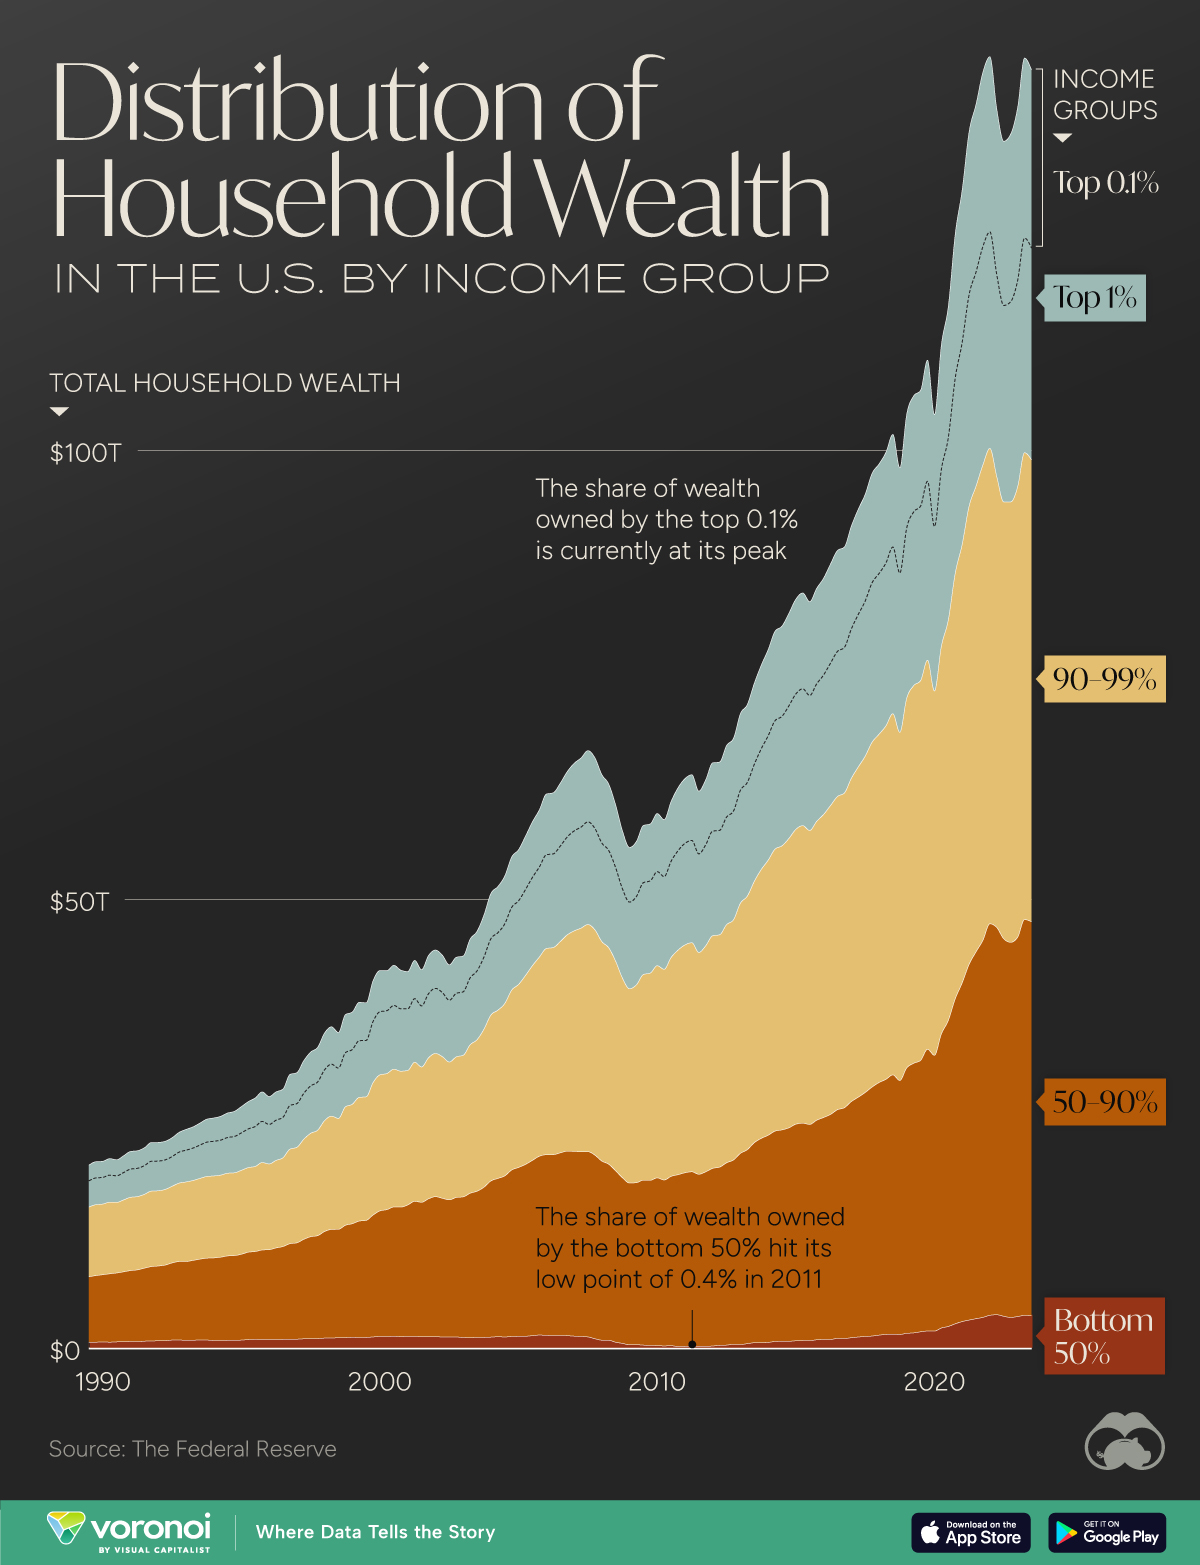
Wealth distribution in America has become increasingly concentrated since 1990.
Today, the share of wealth held by the richest 0.1% is currently at its peak, with households in the highest rung having a minimum of $38 million in wealth. Overall, roughly 131,000 households fall into this elite wealth bracket.
This graphic charts patterns in U.S. household wealth, based on data from the Federal Reserve.
Distribution of U.S. Household Wealth
Below, we show how the share of household wealth breaks down by wealth bracket:
| Share of Household Wealth | 2023 (%) | 2020 (%) | 2010 (%) | 2000 (%) | 1990 (%) |
|---|---|---|---|---|---|
| Top 0.1% | 14 | 13 | 11 | 10 | 9 |
| 99-99.9% | 17 | 18 | 18 | 17 | 14 |
| 90-99% | 36 | 38 | 40 | 36 | 37 |
| 50-90% | 31 | 29 | 31 | 34 | 36 |
| Bottom 50% | 3 | 2 | <1 | 3 | 4 |
Figures are as of Q4 for each year aside form 2023 where Q3 data was used based on the most recently available data.
With $20 trillion in wealth, the top 0.1% earn on average $3.3 million in income each year.
The greatest share of their wealth is held in corporate equities and mutual funds, which make up over one-third of their assets. Since 1990, their total share of wealth has grown from from 9% to 14% in 2023—the biggest jump across all wealth brackets.
In fact, the richest 0.1% and 1% were the only two rungs to see their share increase since 1990.
Meanwhile, the greatest decline was seen across the 50-90% bracket—households in the lower-middle and middle classes. Those in this rung have a minimum $165,000 in wealth with the majority of assets in real estate, followed by pension and retirement benefits.
Averaging $51,000 in wealth, the bottom 50% make up the lowest share, accounting for 3% of the wealth distribution in America. Income growth across this bracket has increased by over 10% between 2020 and 2022, higher than all other brackets aside from the top 1%.
Overall, the top 10% richest own more than the bottom 90% combined, with $95 trillion in wealth.


Personal Finance
Mapped: The Income a Family Needs to Live Comfortably in Every U.S. State
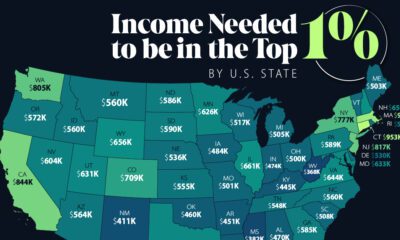
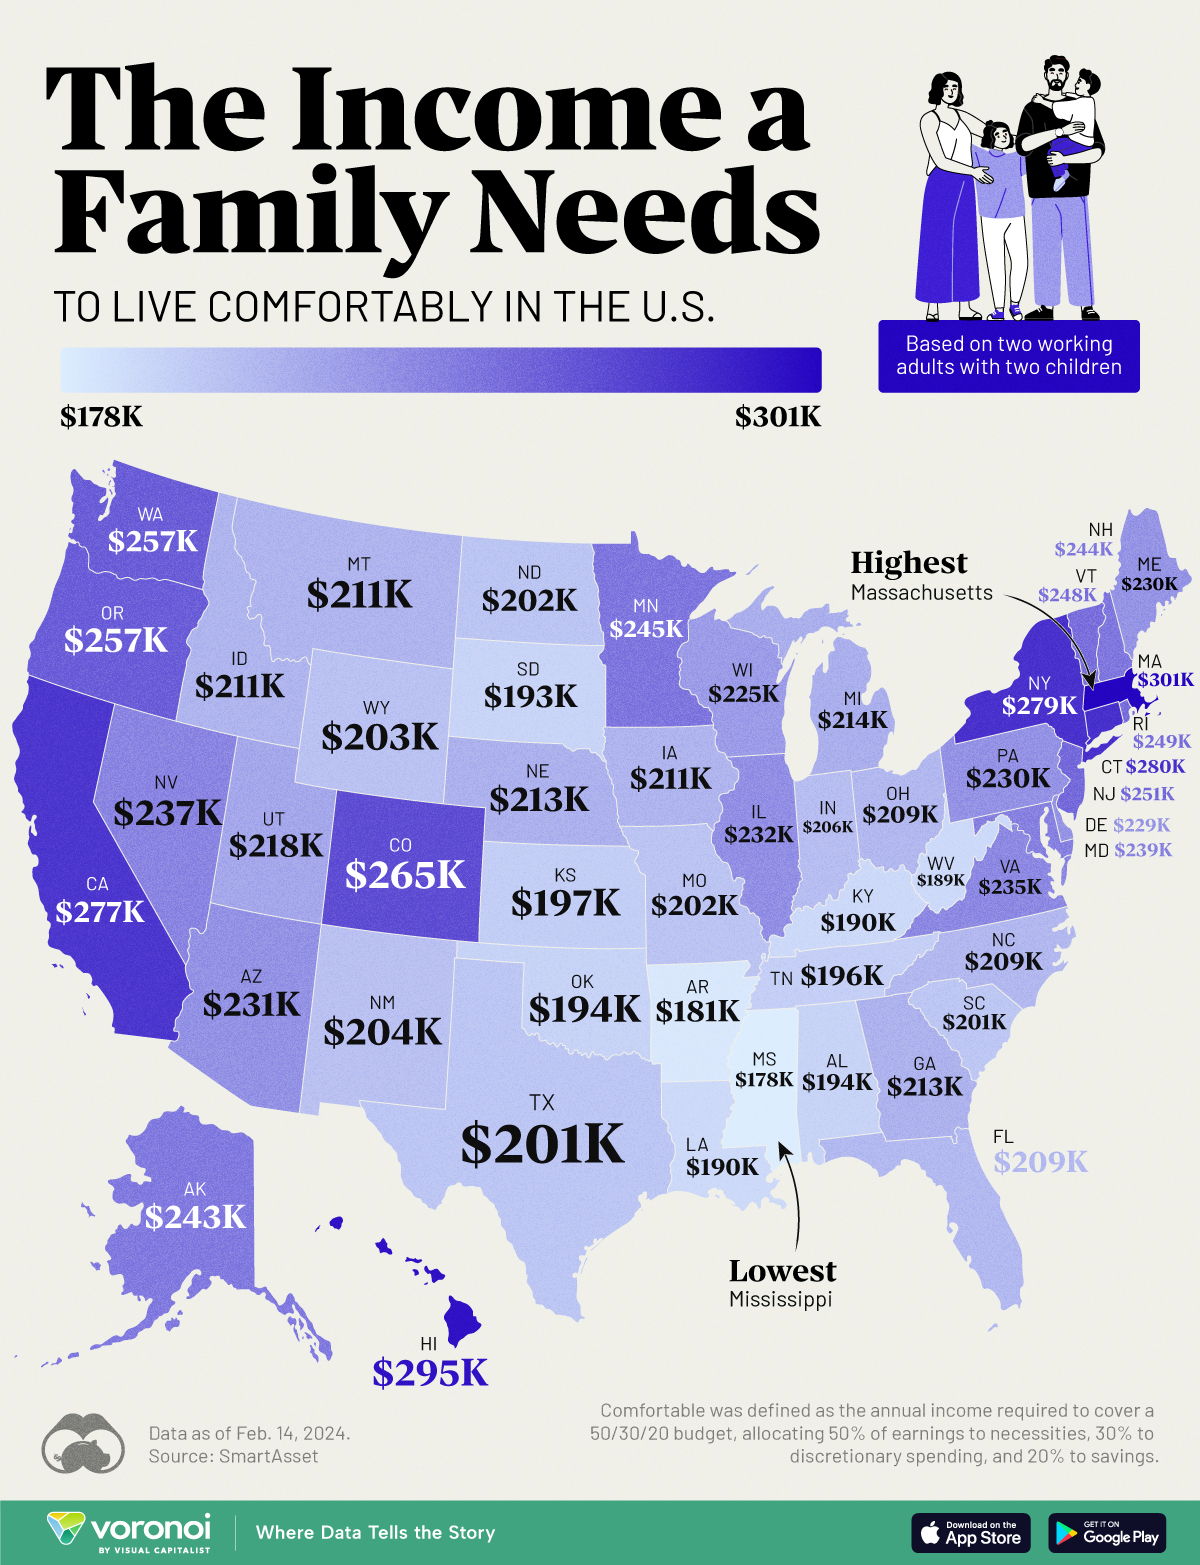
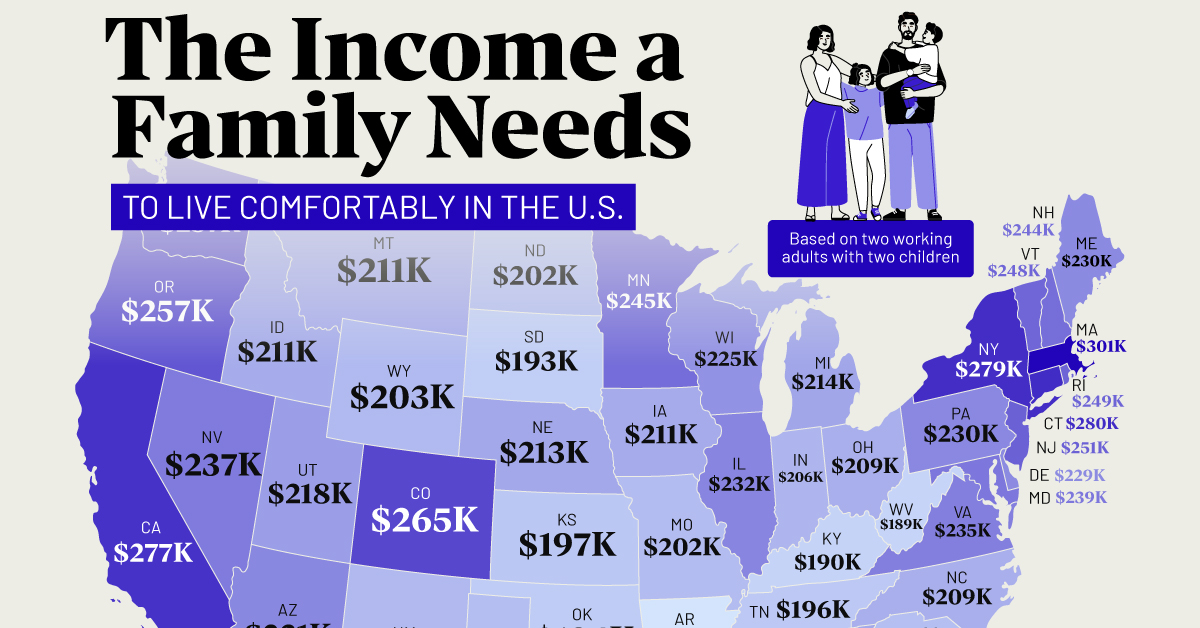
Families in expensive states require over $270,000 annually to live comfortably.
The Income a Family Needs to Live Comfortably in Every U.S. State
This was originally posted on our Voronoi app. Download the app for free on iOS or Android and discover incredible data-driven charts from a variety of trusted sources.
Families in the top five most expensive U.S. states require an annual income exceeding $270,000 to live comfortably.
This visualization illustrates the income necessary for two working adults with two children to maintain a comfortable lifestyle in each state.
“Comfortable” is defined as the income needed to cover a 50/30/20 budget, with 50% allocated to necessities like housing and utilities, 30% to discretionary spending, and 20% to savings or investments.
The calculations for family income needed in each state were done by SmartAsset, using the cost of necessities sourced from the MIT Living Wage Calculator, last updated on Feb. 14, 2024.
Massachusetts Tops the List
Massachusetts is the most expensive state to live comfortably in, requiring a total family income of about $301,184. Hawaii ($294,611) comes in second, followed by Connecticut ($279,885).
Housing is one main reason Massachusetts is an expensive state to live in, particularly in the Boston area. In addition, the state also has a high cost of living, including expenses such as healthcare and utilities.
| Rank | State | Income for 2 working adults raising 2 children |
|---|---|---|
| 1 | Massachusetts | $301,184 |
| 2 | Hawaii | $294,611 |
| 3 | Connecticut | $279,885 |
| 4 | New York | $278,970 |
| 5 | California | $276,723 |
| 6 | Colorado | $264,992 |
| 7 | Washington | $257,421 |
| 8 | Oregon | $257,338 |
| 9 | New Jersey | $251,181 |
| 10 | Rhode Island | $249,267 |
| 11 | Vermont | $248,352 |
| 12 | Minnesota | $244,774 |
| 13 | New Hampshire | $244,109 |
| 14 | Alaska | $242,611 |
| 15 | Maryland | $239,450 |
| 16 | Nevada | $237,286 |
| 17 | Virginia | $235,206 |
| 18 | Illinois | $231,962 |
| 19 | Arizona | $230,630 |
| 20 | Pennsylvania | $230,464 |
| 21 | Maine | $229,549 |
| 22 | Delaware | $228,966 |
| 23 | Wisconsin | $225,056 |
| 24 | Utah | $218,483 |
| 25 | Michigan | $214,490 |
| 26 | Nebraska | $213,075 |
| 27 | Georgia | $212,826 |
| 28 | Montana | $211,411 |
| 28 | Iowa | $211,411 |
| 30 | Idaho | $211,245 |
| 31 | North Carolina | $209,331 |
| 31 | Ohio | $209,331 |
| 33 | Florida | $209,082 |
| 34 | Indiana | $206,003 |
| 35 | New Mexico | $203,923 |
| 36 | Wyoming | $203,424 |
| 37 | Missouri | $202,259 |
| 38 | North Dakota | $202,176 |
| 39 | Texas | $201,344 |
| 40 | South Carolina | $200,762 |
| 41 | Kansas | $196,768 |
| 42 | Tennessee | $195,770 |
| 43 | Oklahoma | $194,106 |
| 44 | Alabama | $193,606 |
| 45 | South Dakota | $192,608 |
| 46 | Kentucky | $190,112 |
| 47 | Louisiana | $189,613 |
| 48 | West Virginia | $189,363 |
| 49 | Arkansas | $180,794 |
| 50 | Mississippi | $177,798 |
Meanwhile, Mississippi is the least expensive state for a family to live comfortably, requiring $177,798 per year. Arkansas ($180,794) comes in second, followed by West Virginia ($189,363). In common, all these states share low prices of housing.
Learn More About Cost of Living From Visual Capitalist
If you enjoyed this post, be sure to check out this graphic, which ranks the median down payment for a house by U.S. state.

-

 Economy1 week ago
Mapped: The Top Exports in Asian Countries
-

 Maps2 weeks ago
Mapped: U.S. Immigrants by Region
-

 Healthcare2 weeks ago
Which Countries Have the Highest Infant Mortality Rates?
-

 Misc2 weeks ago
Charted: How Americans Feel About Federal Government Agencies
-

 Mining2 weeks ago
Visualizing Copper Production by Country in 2023
-

 Brands2 weeks ago
How Popular Snack Brand Logos Have Changed
-

 War2 weeks ago
Visualized: Aircraft Carriers by Country
-

 United States2 weeks ago
Mapped: Countries Where Recreational Cannabis is Legal