Misc
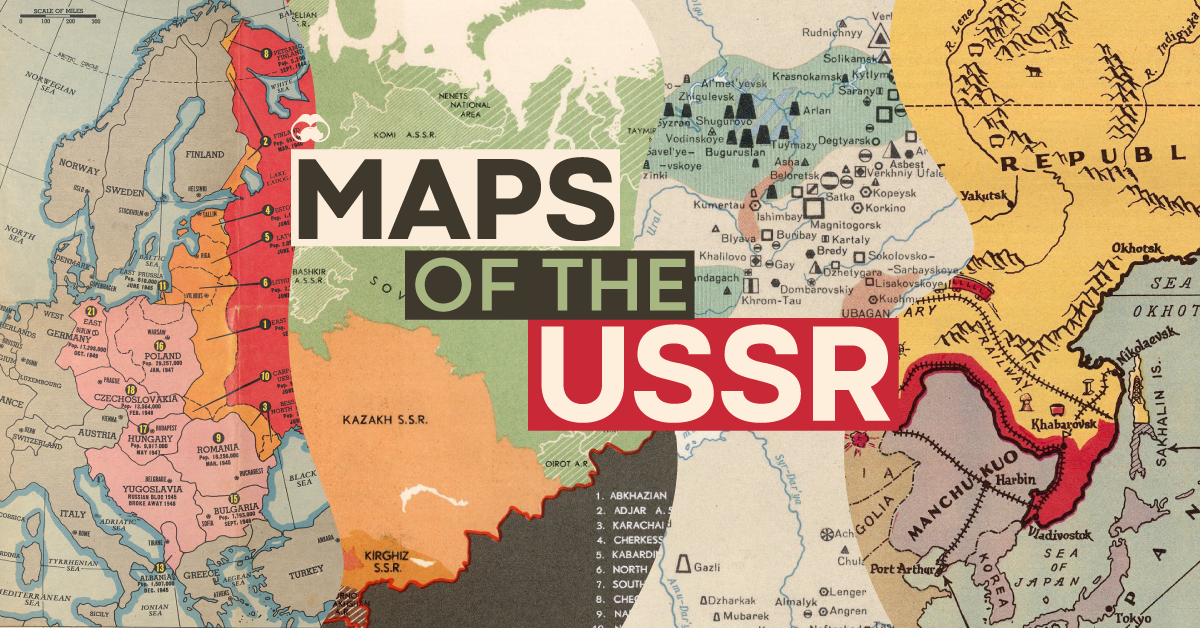
4 Historical Maps that Explain the USSR
The eyes of the world are now fixed on the Russian invasion of Ukraine.
The motivations of Russia’s president, Vladimir Putin, are now the biggest unanswered question of this geopolitical event. One prominent line of thinking is that Putin is looking to reclaim the territory lost after the dissolution of the Union of Soviet Socialist Republics (USSR), and the Russian leader’s own words appear to support this claim:
Ukraine is not just a neighboring country for us. It is an inalienable part of our own history, culture and spiritual space. Since time immemorial, the people living in the south-west of what has historically been Russian land have called themselves Russians.
The disintegration of our united country was brought about by the historic, strategic mistakes on the part of Bolshevik and Soviet leaders […] the collapse of the historical Russia known as the USSR is on their conscience.
For anyone born after the 1970s, memories of that era range from hazy to non-existent, so it’s worth answering the question: What was the USSR anyway?
Below, we’ll use historical maps from three specific eras to build context for how the USSR was structured, which modern countries were a part of this sprawling country, and how its history relates to Russia’s present day pushes for territorial expansion.
Let’s dive in.
The Early Days of the Soviet Union
The USSR was first born in 1922, in the aftermath of the fallen Russian Empire. A civil war between the Bolshevik Red Army and anti-Bolshevik forces across the region ended with the former coming out victorious. This resulted in the unification of a number of republics to form the Soviet Union.
After a number of tumultuous years during the reign of Joseph Stalin, which include a devastating famine which killed millions of people, we arrive at our first snapshot in time: the late 1930s.
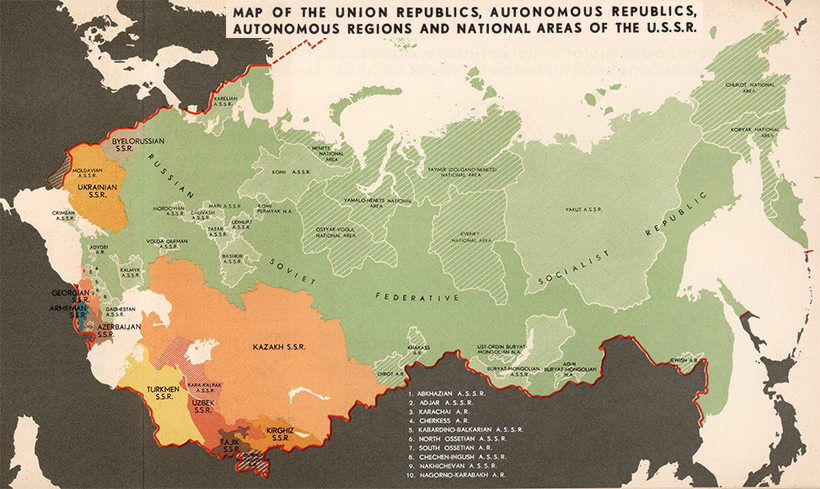
For more detail, view the full-sized version of this map
The USSR was set up as a federation of constituent union republics, which were either unitary states, such as Ukraine, or federations, such as Russia.
Below, we can see how this organizational structure was laid out.
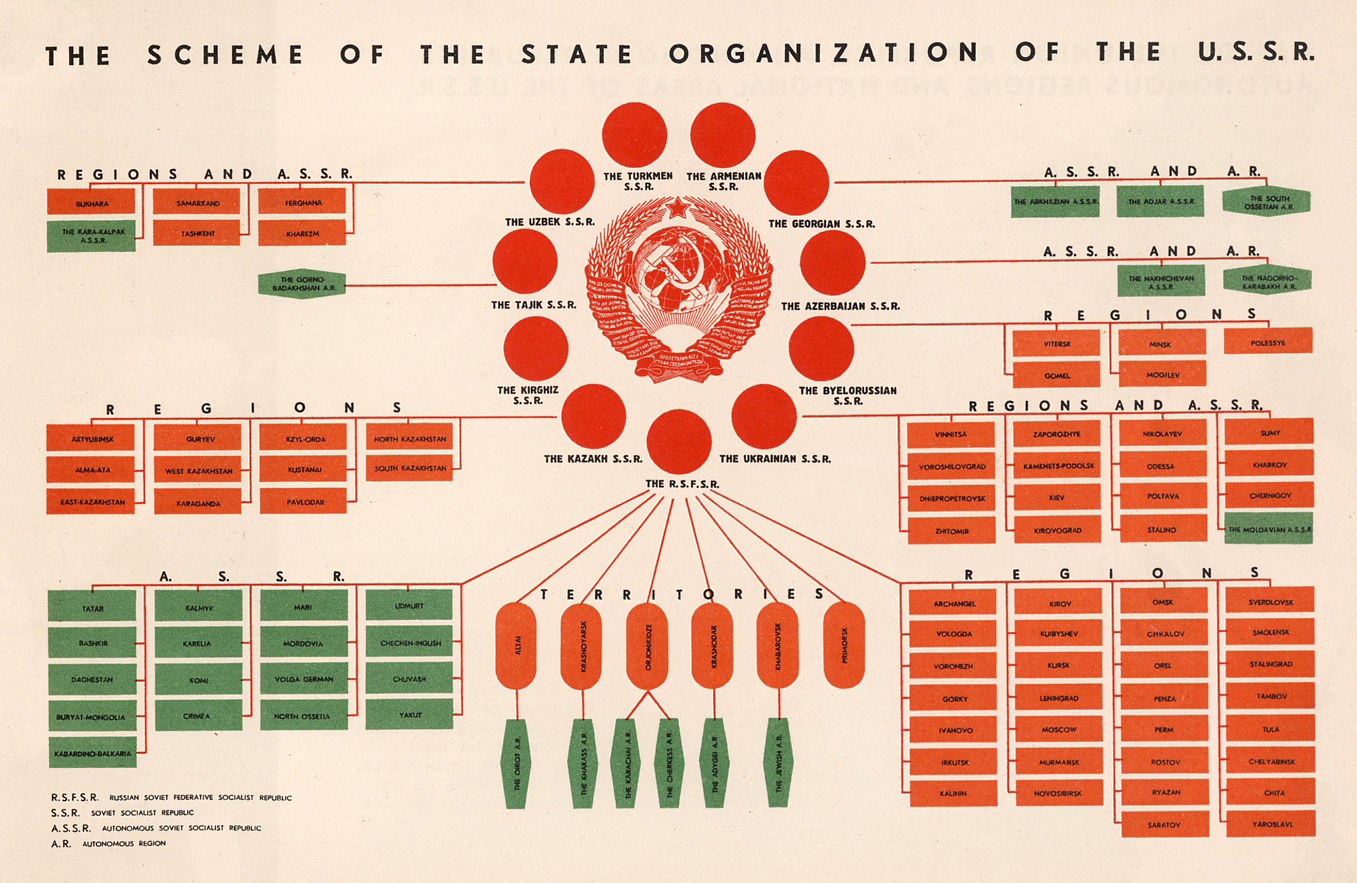
For more detail, view the full-sized version of this diagram
While nominally a union of equals, in practice the Soviet Union was dominated by the Russian Republic (RSFSR). This massive republic contained most of the country’s economic and political power, as well as the largest population and landmass.
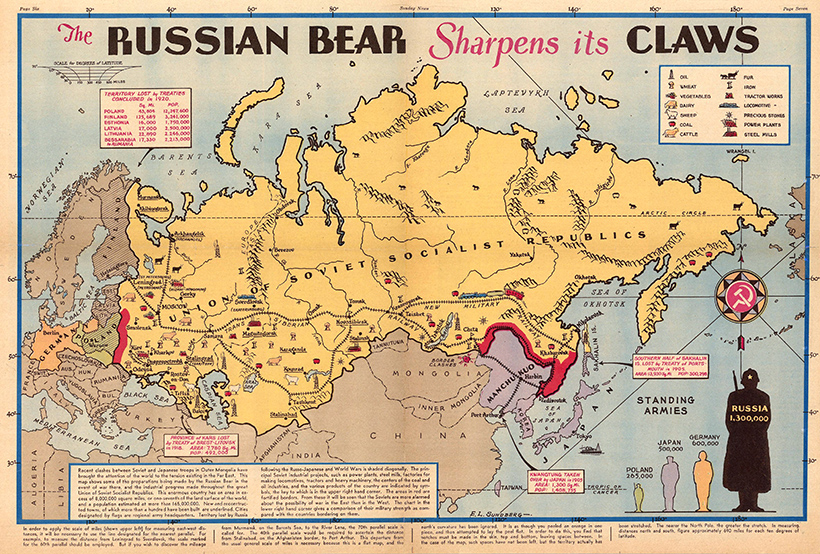
For more detail, view the full-sized version of this map
The geopolitical history of the USSR is inexorably bound with territorial disputes with neighboring regions. In the map above, from 1938, we can see that Soviet troops are clashing with Japan on the eastern edge of the country. On the other end, Stalin had annexed half of Poland, the three Baltic States, and portions of Romania, following the pact with Adolf Hitler.
This sequence of events set the stage for World War II.
The Soviet Empire
The USSR achieved victory in WWII, but at a great cost. An estimated 14% of the prewar population perished in the conflict.
By the end of the 1950s though, the Soviet Union was riding high on a string of impressive achievements on the world stage, from launching the first satellite into space to developing missiles that were a credible threat to American cities. As well, the country’s GDP growth was outpacing its Cold War rival.
This map is a snapshot of the USSR just prior to the construction of the Berlin Wall in 1962.
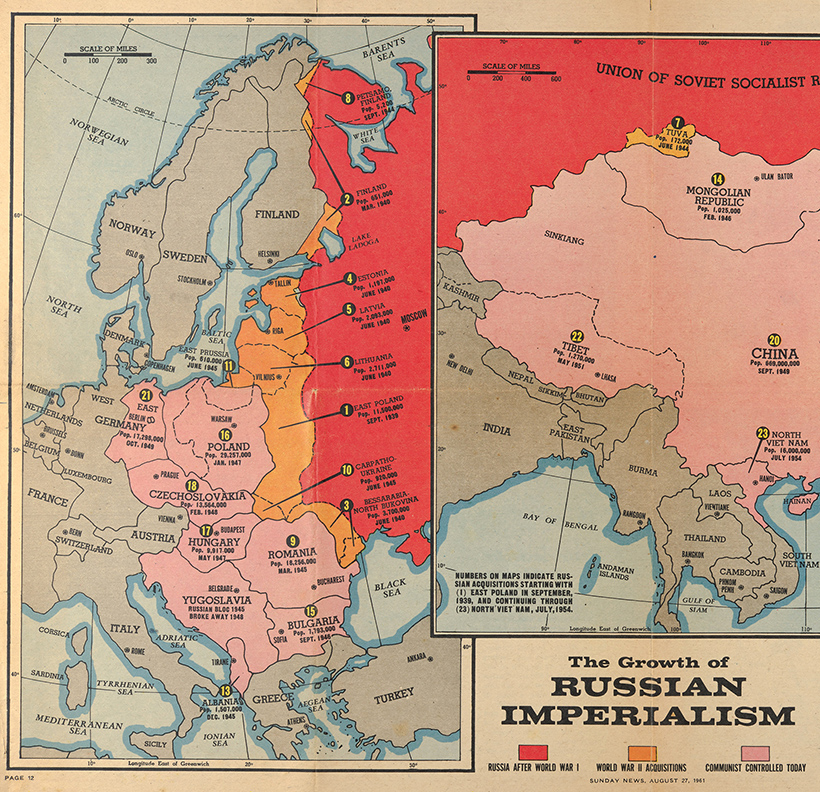
For more detail, view the full-sized version of this map
Above, in orange, we see how much territory the USSR ended up with after the war. This map is especially informative as it lists the populations of the territories at the time. Large portions of Eastern Europe—including more than 22 million people—were rolled behind the iron curtain.
The Waning Days of the USSR
After a prolonged period of stagnation, Mikhail Gorbachev attempted to reform the Soviet political and economic system with perestroika, which literally translates to “reconstruction”. This movement began a slow process of democratization that eventually destabilized Communist control through the late 1980s, hastening the collapse of the Soviet Union.
The map below is a snapshot of the USSR two years prior to its official dissolution in 1991.
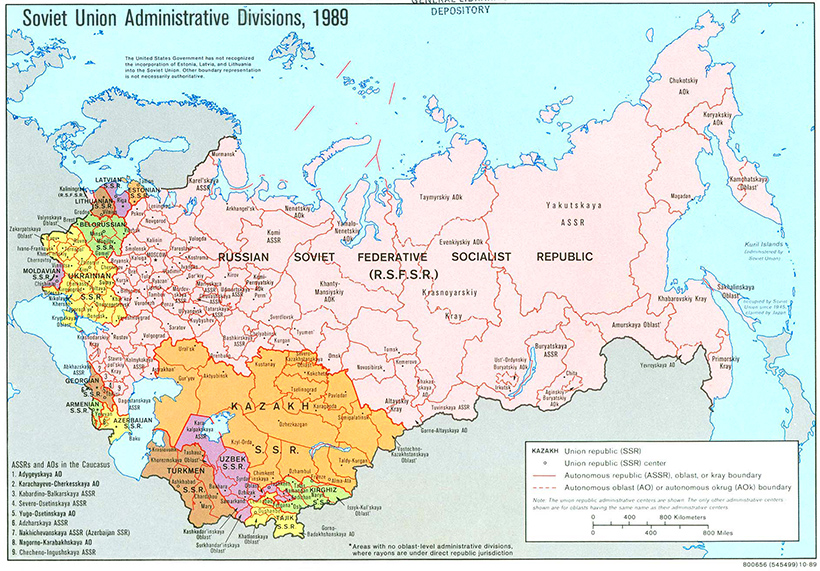
For more detail, view the full-sized version of this map
Many of the republics, shown in various colors above, were already seeing independence movements and unrest by this time, and would eventually declare independence one by one.
Here’s a list of the major regions that seceded from the USSR:
| USSR Subdivision | Present Day Country | Seceded from the USSR |
|---|---|---|
| Estonian SSR | 🇪🇪 Estonia | 8 May 1990 |
| Lithuanian SSR | 🇱🇹 Lithuania | 11 March 1990 |
| Latvian SSR | 🇱🇻 Latvia | 4 May 1990 |
| Azerbaijan SSR | 🇦🇿 Azerbaijan | 30 August 1991 |
| Georgian SSR | 🇬🇪 Georgia | 9 April 1991 |
| Russian SFSR | 🇷🇺 Russian Federation | 12 December 1991 |
| Uzbek SSR | 🇺🇿 Uzbekistan | 31 August 1991 |
| Moldavian SSR | 🇲🇩 Moldova | 27 August 1991 |
| Ukrainian SSR | 🇺🇦 Ukraine | 24 August 1991 |
| Byelorussian SSR | 🇧🇾 Belarus | 10 December 1991 |
| Turkmen SSR | 🇹🇲 Turkmenistan | 27 October 1991 |
| Armenian SSR | 🇦🇲 Armenia | 21 September 1991 |
| Tajik SSR | 🇹🇯 Tajikistan | 9 September 1991 |
| Kazakh SSR | 🇰🇿 Kazakhstan | 16 December 1991 |
| Kirghiz SSR | 🇰🇬 Kyrgyzstan | 31 August 1991 |
Since these regions seceded with their borders largely intact, a current map of this part of the world doesn’t look too different from the one above.
That said, even as borders remain static, the war in Ukraine demonstrates that power dynamics in this region are still very much in flux.


Maps
Mapped: The World’s Wettest and Driest Countries
From tropical rainforests to the sandy deserts of North Africa, the world’s wettest and driest countries are a study in contrasts.
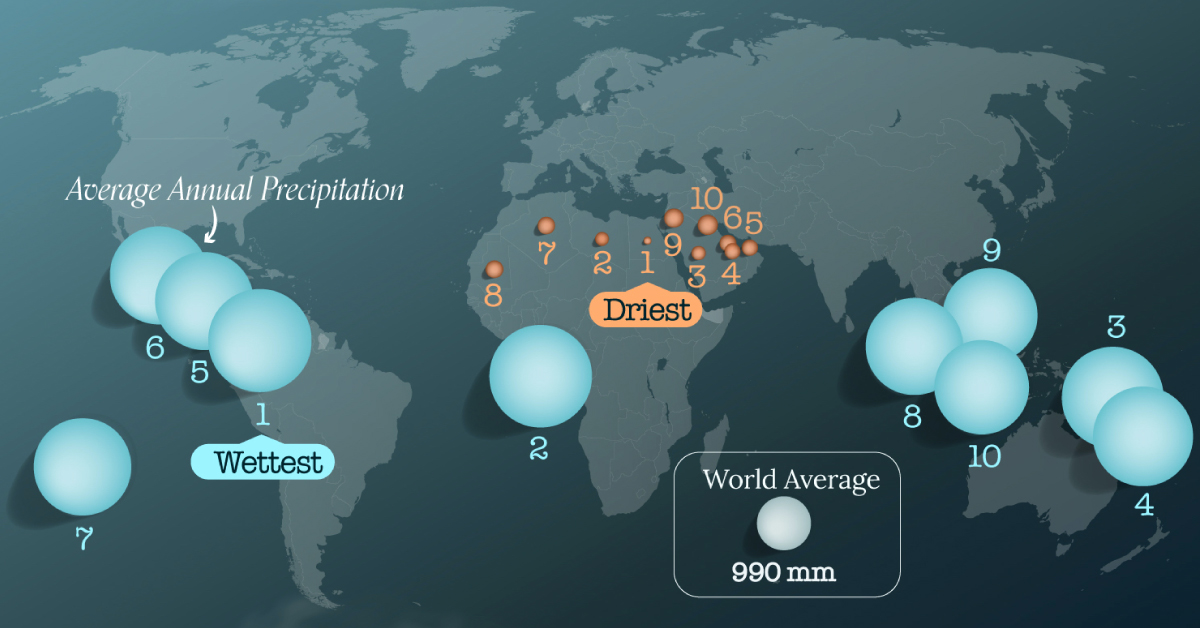
Where are the World’s Wettest and Driest Countries?
This was originally posted on our Voronoi app. Download the app for free on iOS or Android and discover incredible data-driven charts from a variety of trusted sources.
From tropical rainforest nations to the sandy deserts of North Africa and the Middle East, the world’s wettest and driest countries are a study in contrasts.
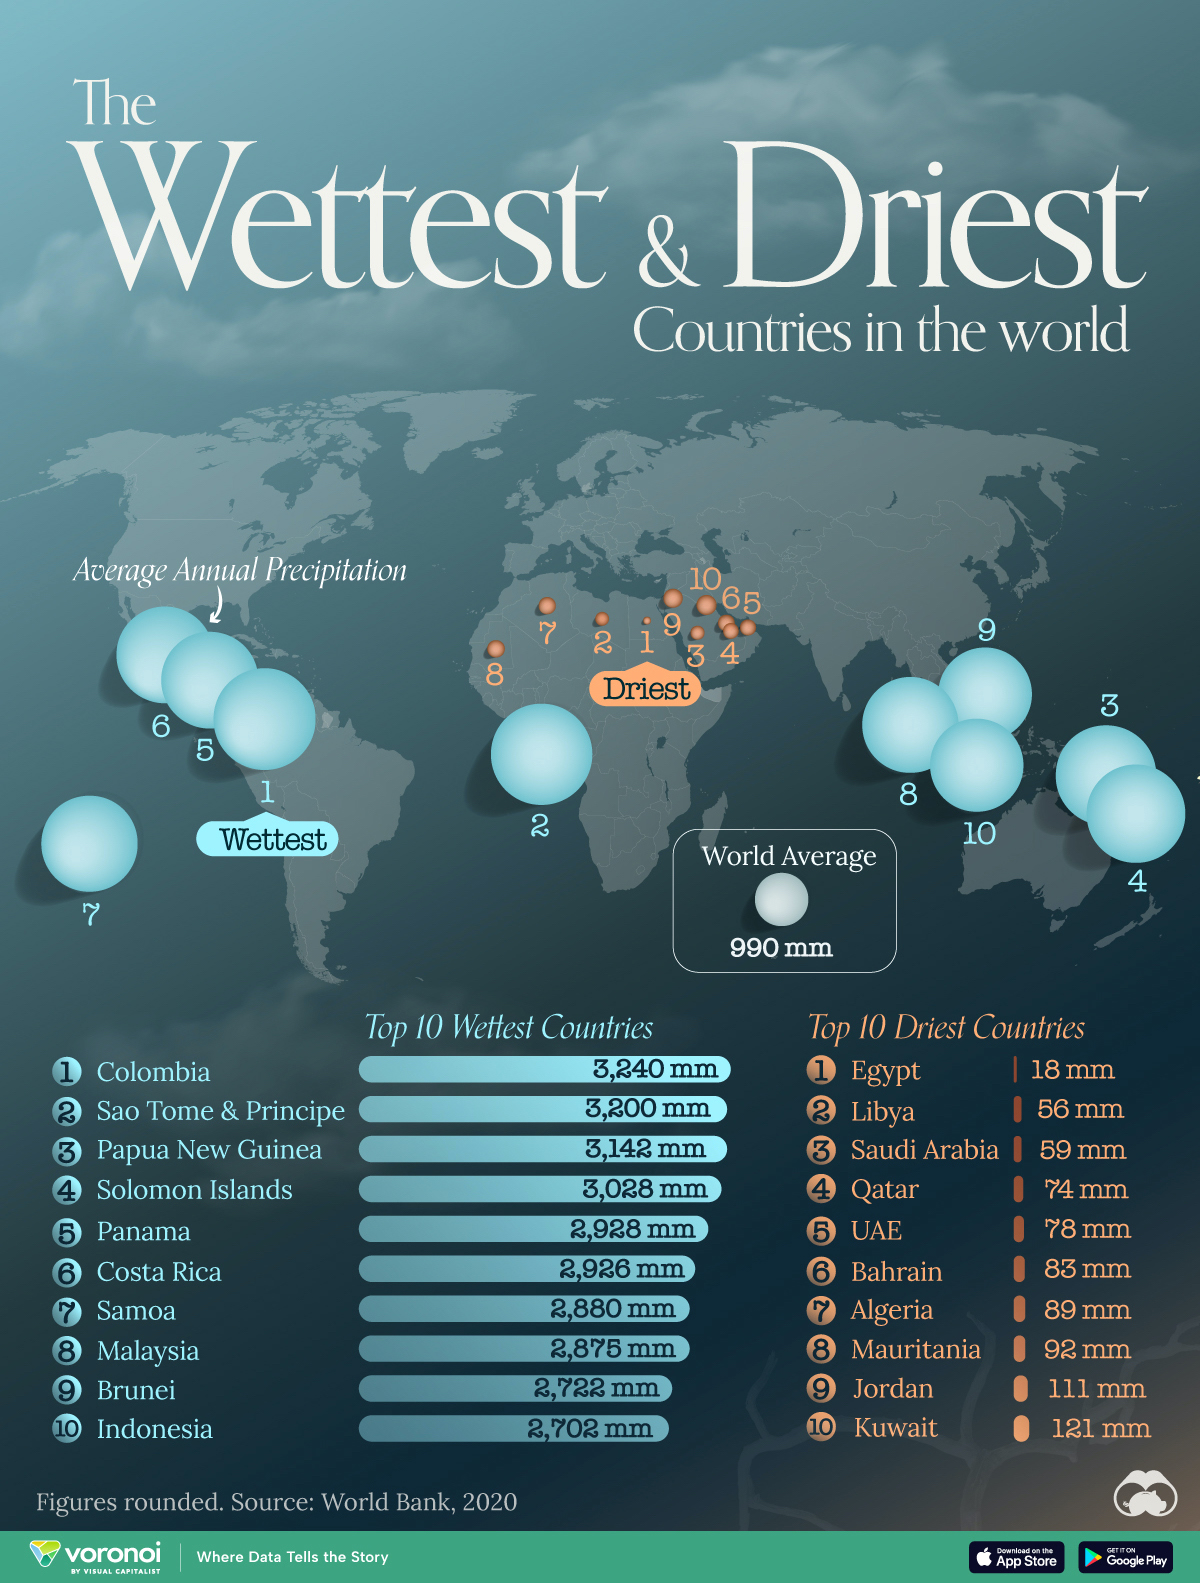
We map and rank the countries that receive the highest and lowest average annual precipitation in millimeters, per latest data from the World Bank.
Ranked: Top 10 Wettest Countries
Colombia tops the list of nations with the highest average precipitation at 3,240 millimeters (128 inches) in a year.
Its Tutunendo district is the one of the world’s wettest places, averaging nearly 12,000 mm (463 inches) of rain annually.
| Rank | Country | Average Annual Precipitation (mm) |
|---|---|---|
| 1 | Colombia | 3,240 |
| 2 | Sao Tome & Principe | 3,200 |
| 3 | Papua New Guinea | 3,142 |
| 4 | Solomon Islands | 3,028 |
| 5 | Panama | 2,928 |
| 6 | Costa Rica | 2,926 |
| 7 | Samoa | 2,880 |
| 8 | Malaysia | 2,875 |
| 9 | Brunei | 2,722 |
| 10 | Indonesia | 2,702 |
Note: Figures are rounded.
Off the coast of Africa however, Sao Tome & Principe is not far behind Colombia, receiving about 3,200 mm of rain in 2020.
Papua New Guinea and the Solomon Islands also average more than 3,000 mm of rain in a year, and Panama (2,928 mm) rounds out the top five.
Noticeably, all 10 countries lie in close proximity to the equator, and near oceans, where rising hot and humid air leads to abundant rainfall.
Ranked: Top 10 Driest Countries
On the other end of the scale, Egypt records the lowest average annual rainfall across all countries, at 18 mm (0.7 inches). For comparison, Colombia receives nearly 180x the amount of rain Egypt does.
| Rank | Country | Average Annual Precipitation (mm) |
|---|---|---|
| 1 | Egypt | 18 |
| 2 | Libya | 56 |
| 3 | Saudi Arabia | 59 |
| 4 | Qatar | 74 |
| 5 | UAE | 78 |
| 6 | Bahrain | 83 |
| 7 | Algeria | 89 |
| 8 | Mauritania | 92 |
| 9 | Jordan | 111 |
| 10 | Kuwait | 121 |
Note: Figures are rounded.
In fact, countries from North Africa and the Middle East make up the entirety of this list of the driest countries in the world.
Learn More About Rainfall From Visual Capitalist
If you enjoyed this post, be sure to check out Mapping the Unequal Distribution of Global Precipitation which divides the world into two halves: one that receives more than global average of rain (or snow), and one that receives less.

-

 Maps1 week ago
Mapped: The Top Exports in Asian Countries
-

 Demographics2 weeks ago
Mapped: U.S. Immigrants by Region
-

 Healthcare2 weeks ago
Which Countries Have the Highest Infant Mortality Rates?
-

 Politics2 weeks ago
Charted: How Americans Feel About Federal Government Agencies
-

 Mining2 weeks ago
Visualizing Copper Production by Country in 2023
-

 Culture2 weeks ago
How Popular Snack Brand Logos Have Changed
-

 War2 weeks ago
Visualized: Aircraft Carriers by Country
-

 United States2 weeks ago
Mapped: Countries Where Recreational Cannabis is Legal