Keeping up with trends is an integral part of any SEO campaign. You want to know what your audience is currently searching for and what the trend is overall.
Google Trends is a free tool that helps in this regard.
It is populated by Google’s own search data, making it a reliable and accurate source for understanding search trends.
However, gathering Google Trends data is not enough; you need to know how to use it effectively.
The guide below covers the basics of Google Trends and how it can be helpful in keyword research and SEO. We also discuss how Keywords Everywhere amplifies the capabilities of Google Trends.
What Is Google Trends?
Google Trends is Google’s free resource that tells you what people are searching for on the web. You can use it to learn about the search patterns in a particular place around a specific time and at a particular time.


So, let’s say you want to know the search trend for ”spin cycling” in Singapore in the past year.
Google Trends will show you the interest level for that search term over time.
Why Is It Important to Monitor Google Trends?
Google is the most used search engine in the world. In fact, it accounts for 81.95% of desktop search engine share.
It makes sense to see how your keywords are performing on the most popular search engine. After all, that’s where you want to rank.
Google Trends also keeps you updated on the latest trends and popular topics. If you did this manually, it would just be guesswork.
However, with Google Trends, you can see the rise and fall of certain search terms in real time.
The location and time settings also allow for a more targeted analysis, which can be beneficial for businesses that cater to specific regions or have seasonal trends. For instance, if you’re a ski resort in Colorado, you can use Google Trends to see when people start searching for ski vacations in your area.
Similarly, if you’re a Canadian business with customers across six countries, Google Trends can show you how the search terms associated with your brand vary in popularity across those regions.
How to Use Google Trends for Topic Analysis?
Before getting into the specific use cases, let’s start with a basic analysis in Google Trends.
For this example, we’ll use the term ”Bitcoin.”’
Start by going to the Google Trends website. You will see the option to enter the keyword or topic of your choice in the search bar.
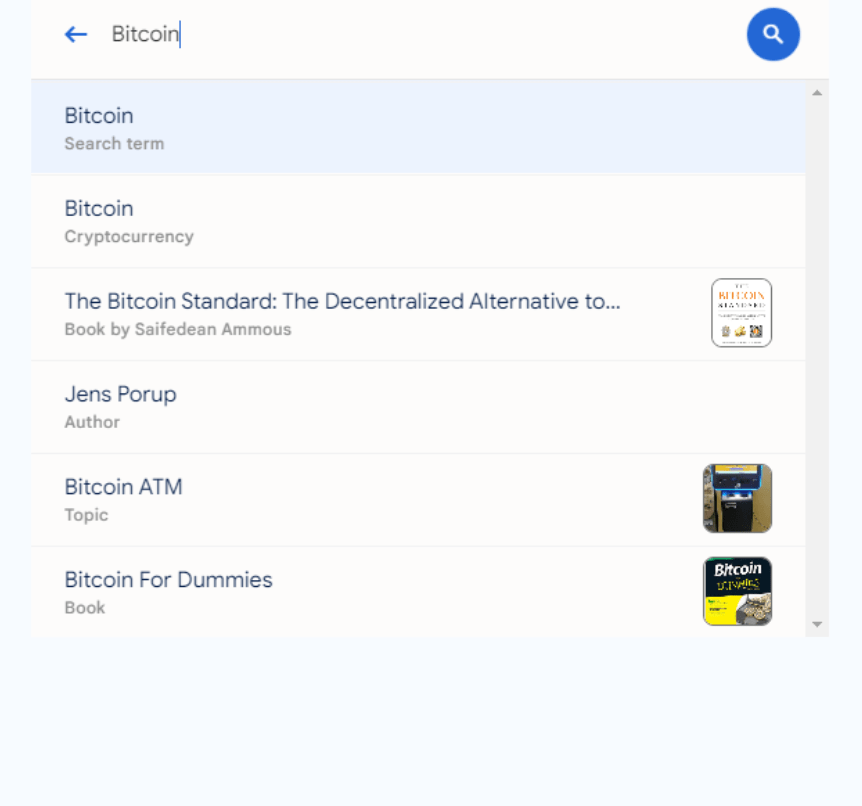
Enter ”Bitcoin.” A drop-down menu will appear.
At the top of this menu will be the term you searched for. Below it, there will be similar terms that Google might believe you are interested in.
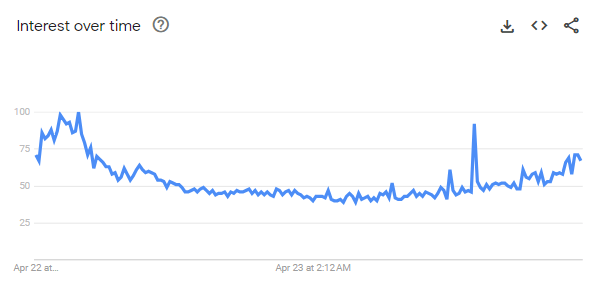
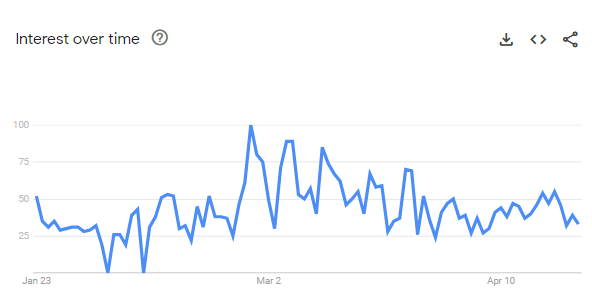
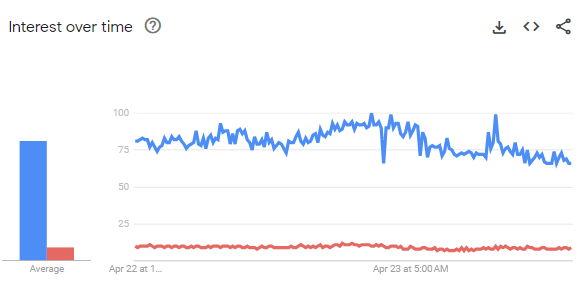
Select ”Bitcoin” from the drop-down menu. The first thing you’ll see in the results is a graph that shows the keyword’s popularity over time.
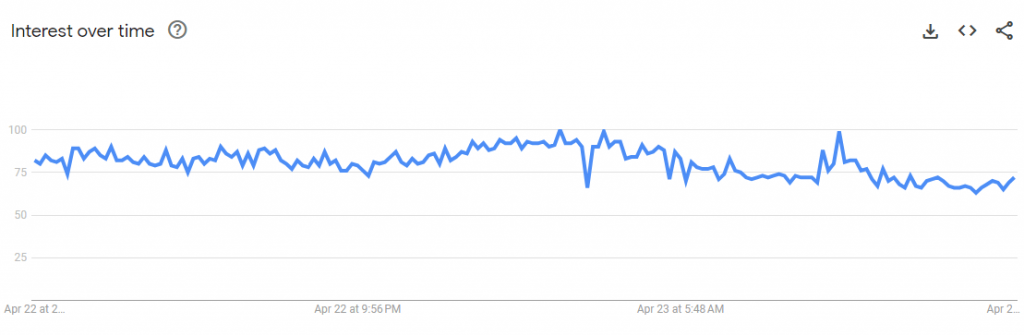
When you hover over any point in the graph, a small box will open, showing you the time period with a score between 0 and 100. This is the interest score.
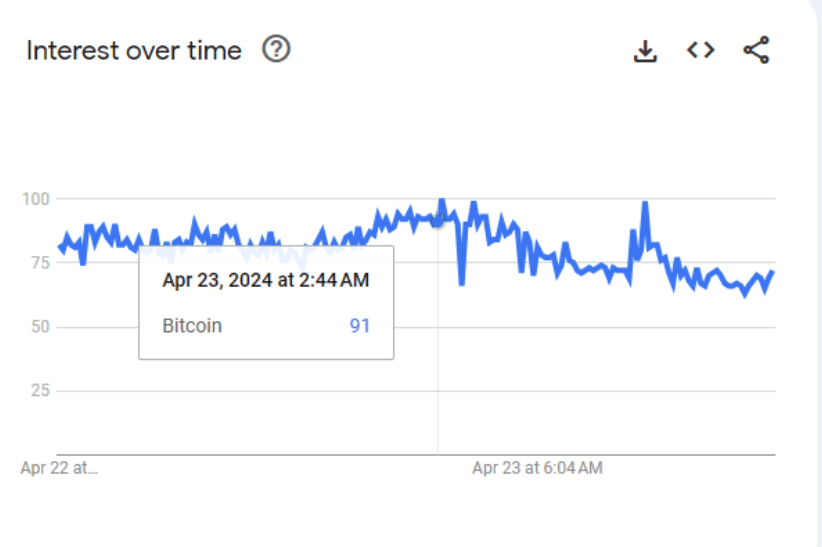
An interest score of 100 is the peak popularity for that term and time period, while a score of 0 means that there was no interest around the keyword.
If you want, you can export this data into a CSV file by clicking the ”Export CSV” option at the bottom or the download icon above the graph.
Filtering Google Trends Results
When you search for a keyword in Google Trends, the location will be set to where you are by default. But you can change this in the menu below the search bar.
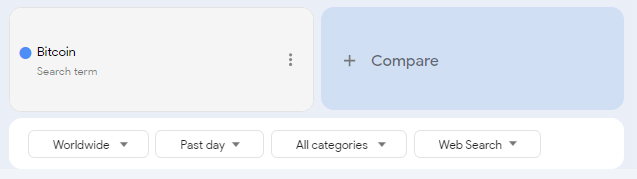
You can also filter by time period, category, and even search type. In the example above, we viewed the trend for ”Bitcoin” worldwide.
Here, we changed the filter from worldwide to the US. As you can see, the trend for ”Bitcoin” is different in the US compared to worldwide.
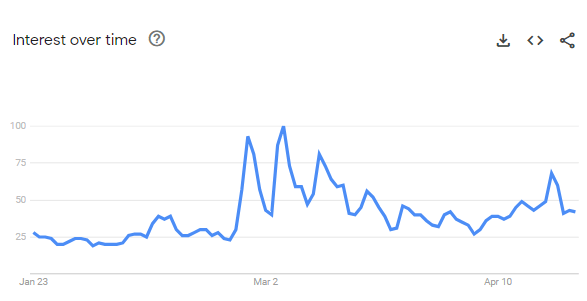
Similarly, we changed the time period to past 90 days. The graph showed us how the trend fluctuated in the past three months.
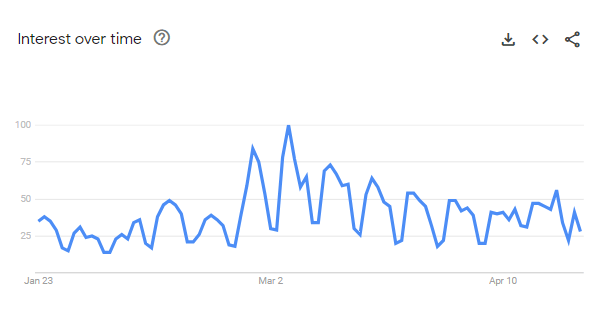
Then, we selected the ”News” option from the category section, and the graph changed again.
Google Trends also lets you filter by search type. The following options are available:
- Image search
- News search
- Google Shopping
- YouTube search
We selected YouTube search from the list, and the graph displayed a different trend from the other options.
Other Sections in Google Trends
Besides the graph, Google Trends also has some additional sections where you can find more information about your keyword.
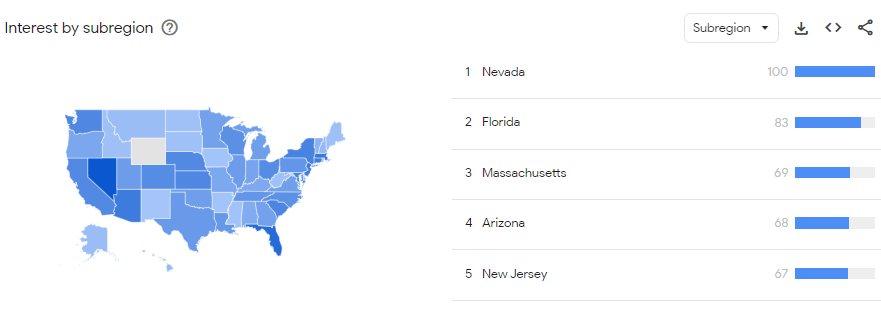
The first section is Interest by Region. Here, you can see which countries or regions have the most interest in your keyword. Since we have selected the US in the location filter, this section will show us US states as subregions.
We switched it back to ‘’Worldwide’’, and the Interest by Region section shows us the following results.
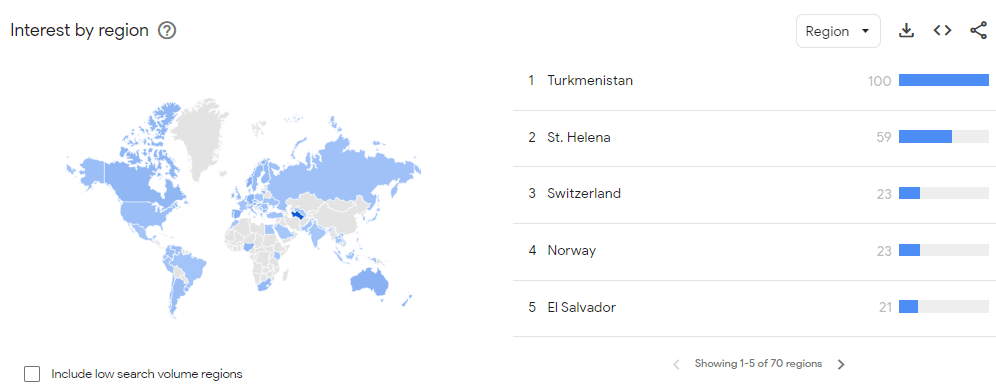
If you want to see regions with low search volume, you can check the box on the side to view them, too.
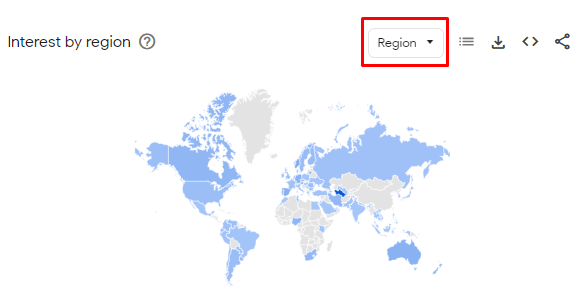
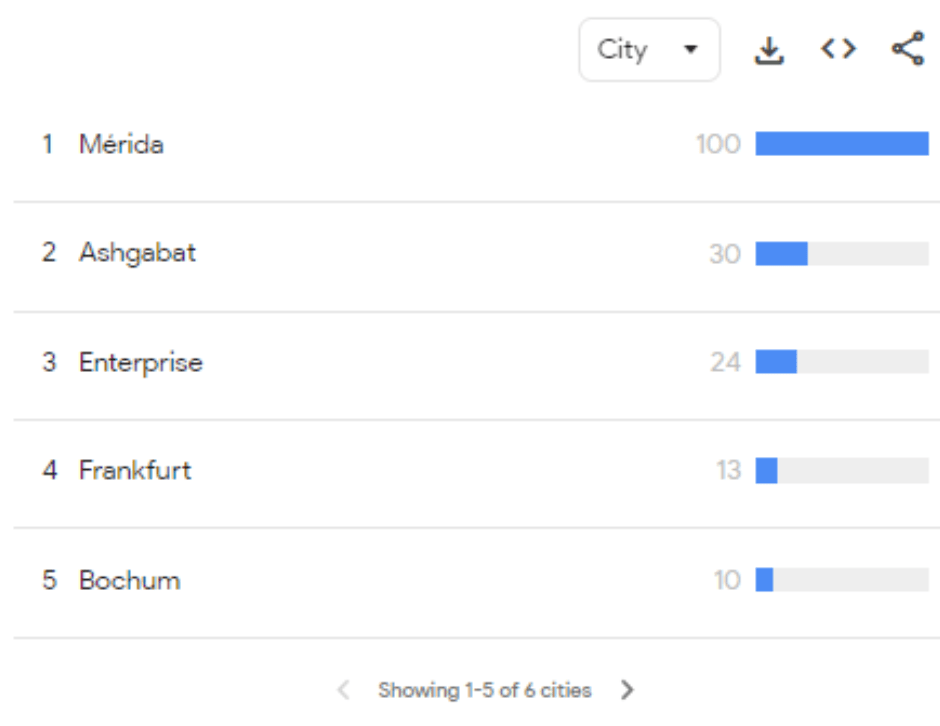
For both options, the Region option can be further targeted to the City. Simply select ”City” from the drop-down menu above the map.
Here’s what our results for worldwide interest by city showed us.
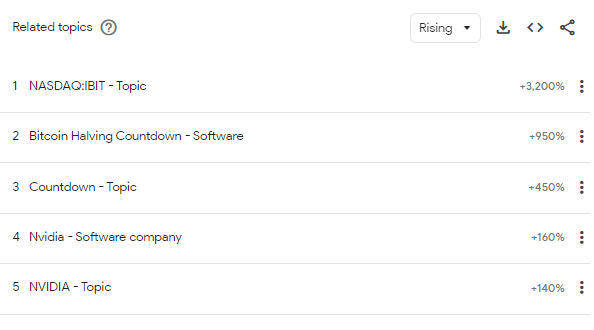
Underneath the Interest by Region section, you will find Related Topics. The section displays other topics related to your keyword that are currently trending.
Again, you can filter them by two options: Rising and Top.
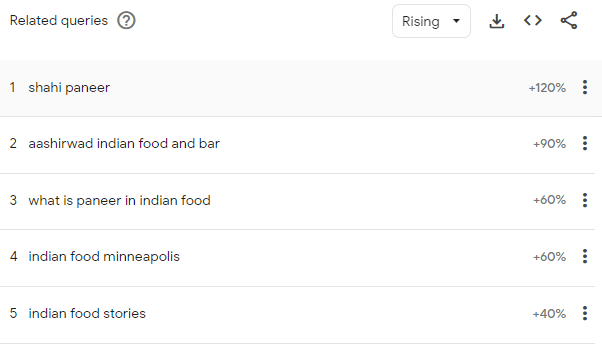
The last section is Related Queries. It differs from Related Topics because it shows actual search queries (words or phrases people use to search for a topic) related to your keyword.
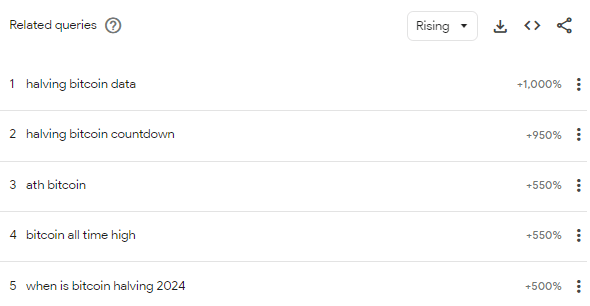
For example, if the topic is Dow Jones, the query could be ”Dow Jones stock price” or ”Dow Jones today”.
Queries can also be filtered by Rising and Top, just like Related Topics. Like the graph at the top, you can download all these sections as CSV files for later analysis.
Comparing Google Trends
Google Trends also lets you compare different keywords to see their relative popularity. You can compare up to five keywords at a time.
In the Add Comparison box, type your second keyword. For this example, we used ”Ethereum.”
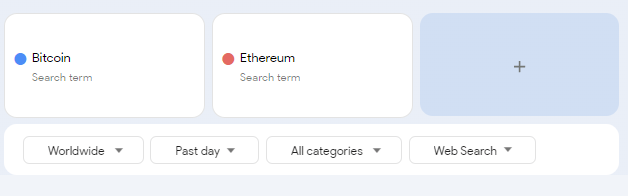
As you can see, the graph now shows two lines, one for ”Bitcoin” and one for ”Ethereum.” Similarly, if you have more keywords, the number of trend lines will increase, and they will be displayed in different colors.
The sections at the bottom also show data for each individual search term, just like before.
How to Use Keywords Everywhere in Google Trends?
A slight downside of Google Trends is that it only shows you an interest score. It doesn’t actually tell the search volume for a keyword.
With Keywords Everywhere, you can find this information.
There are three ways to gauge trends using Keywords Everywhere. Let’s look at them.
Keywords Everywhere Within Google Trends
If your Keywords Everywhere extension is on, you will see a graph made by the tool within Google Trends.
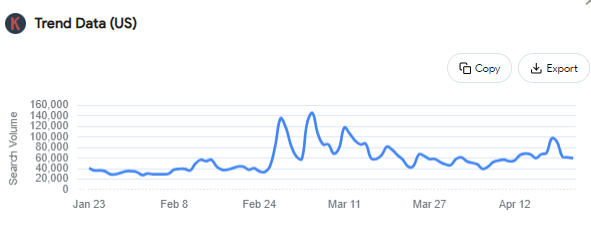
Like earlier, go to Google Trends website and search for your keyword. Above Google Trends Interest Over Time graph, you will see a Trend Data graph made by Keywords Everywhere.
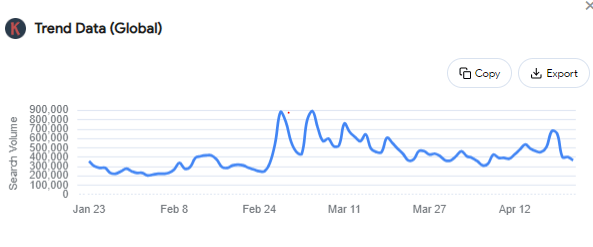
It will look the same as the graph made by Google Trends. But, on the ‘’y’’ axis (the vertical line), you will see Search Volume instead of interest score. So, you can see the actual frequency of search for a keyword during different times in your selected time range.
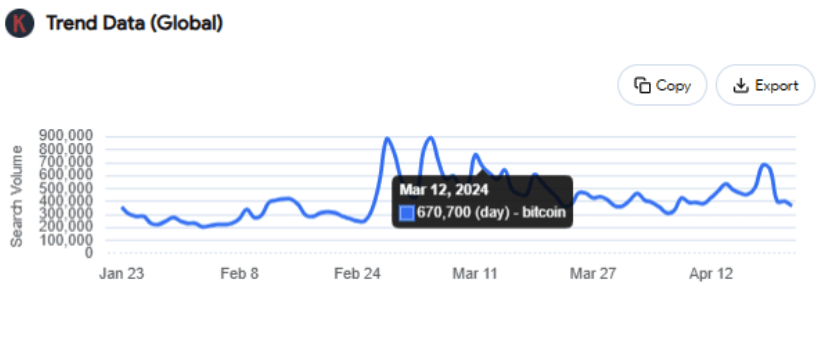
If you hover over any point in the graph, instead of the interest score, Keywords Everywhere will show you a box with the day and the search volume.
As you can see in the Bitcoin trend graph below, there were 670,700 searches for the term ‘’Bitcoin’’ on March 12, 2024.
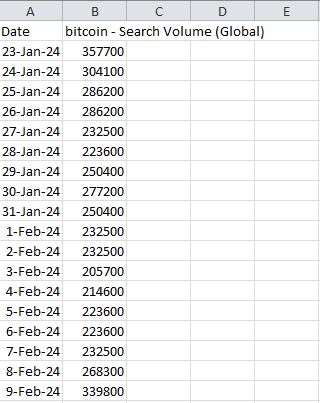
You can click the Copy option on the top to copy the data onto your clipboard. Or, you can export the data in a CSV file. The CSV file will show you the days with their respective search frequency.
As you change the filters in Google Trends, the graph in Keywords Everywhere will change accordingly. For example, if we change the filter from worldwide to the US, Keywords Everywhere will show us the graph for the country.
The same applies to all other filters, too.
Keywords Everywhere In Google Search
You don’t necessarily have to go to Google Trends to see the search volume for relevant trends within Keywords Everywhere. The tool’s widget in Google search also shows you these results.
For example, we searched for ‘’Bitcoin’’ in Google.
The Keywords Everywhere widget showed this trend data for our topic.
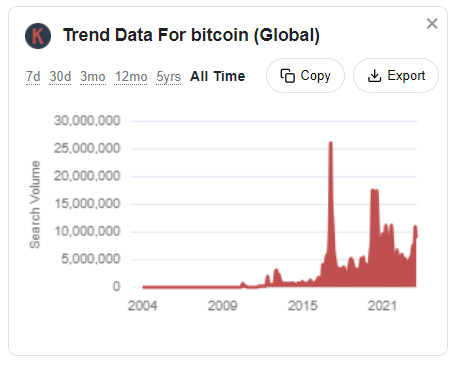
As you can see, there’s a graph showing the trend from 2004 to 2021 with the search volume on the ‘’y’’ axis. If you want, you can copy or export the data as you would in Google Trends.
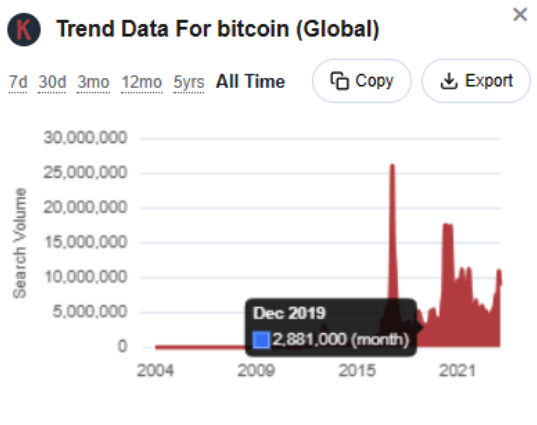
Or you can hover over different points on the graph to see the search volume for individual days or months. For example, the search volume for Bitcoin was 2,881,000 in the month of December in 2019.
You can also filter the results by the following time ranges:
- 7 days
- 30 days
- 3 months
- 12 months
- 5 years
For example, we selected the past 3 months, resulting in the following graph.
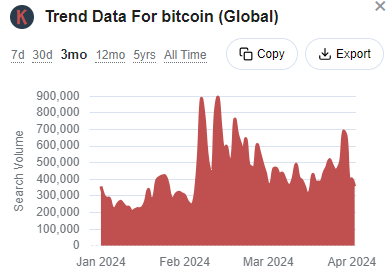
You can use this widget to check your desired trends in different time ranges along with their search volumes during these periods.
Bulk Trends Analysis in Keywords Everywhere
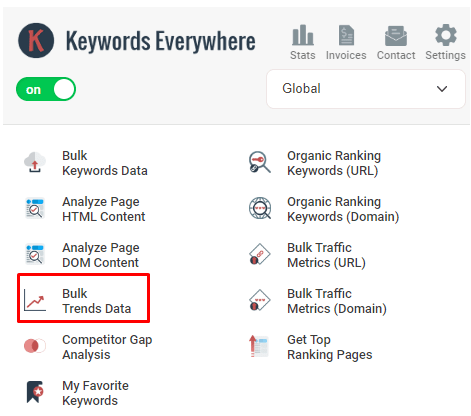
If you want to analyze multiple keywords or queries, you can use Keywords Everywhere’s Bulk analysis option. In the extension, select Bulk.
You will be directed to a new page where you can enter all keywords in a box for analysis. Keywords Everywhere lets you check trend data for 1,000 keywords at once. Make sure to separate your keywords by a semicolon or comma. You can also write them on new lines.
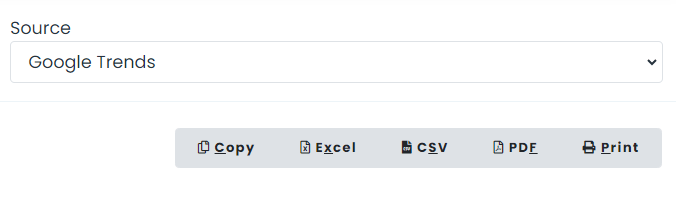
Depending on your analysis, you can change the duration and source from the drop-down menus above. Keywords Everywhere supports two sources: YouTube Trends and Google Trends.
For our example, we searched for Bitcoin on Google, and checked the Keywords Everywhere widget for related keywords.
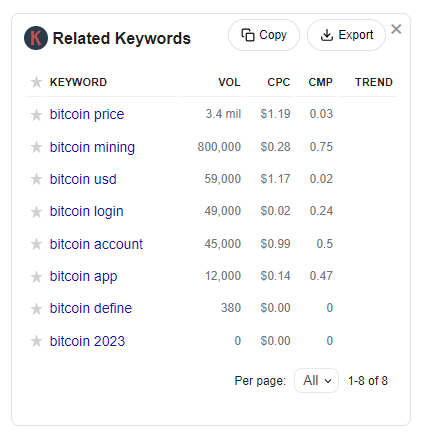
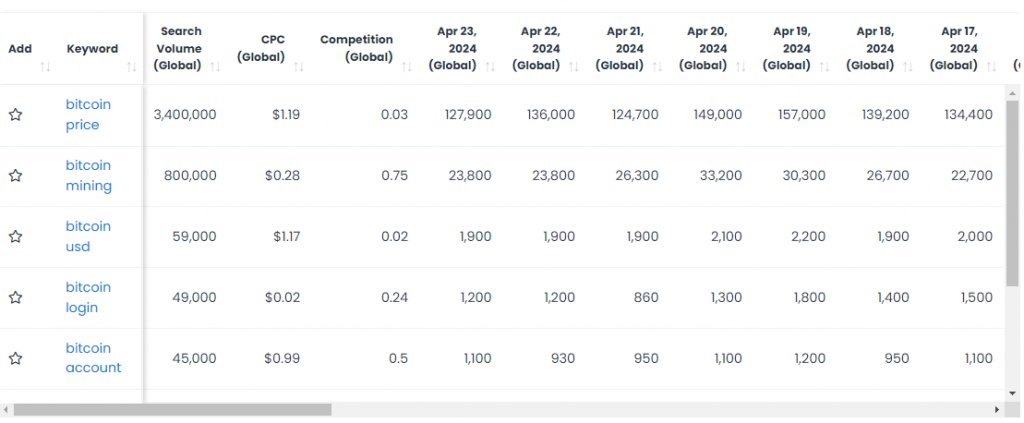
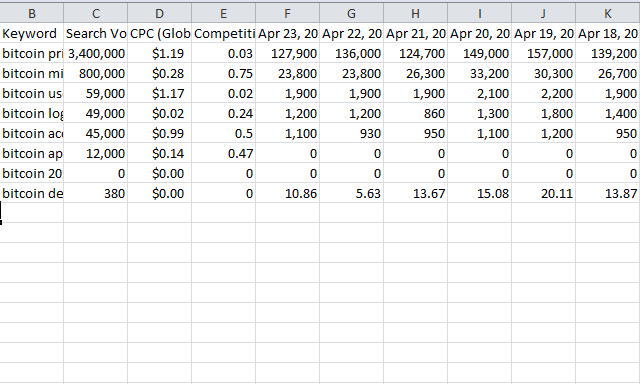
We downloaded these keywords and entered them in the Bulk trend analysis tool. Keywords Everywhere showed us a table with the global keyword search volume, global cost-per-click, competition, and monthly search volume.
If you click on any keywords in the Keyword column, it will direct you to the Google Trends search result for that particular query. You can find more information about the term there.
Since this is a lot of information to process immediately, you’d likely want to view it later. The good news is you can download the table in an Excel, CSV, or PDF file.
The downloaded table will look something like this.
If you want to check the YouTube trends for your query, follow the same steps.
6 Ways to Use Google Trends for Business
Now that you understand how to use Google Trends, let’s go into its use cases.
- Keyword Research
The most obvious use for Google Trends is keyword research. You can simply type in search queries related to your business and see if they’re trending.
Google Trends also shows you related queries and topics, which can give you a better understanding of what your target audience is interested in.
Let’s say you’re a company that makes reusable water bottles. By typing in “reusable water bottle,” you can see the trend around the keyword in your selected region.
Here’s what it looks like in the US.
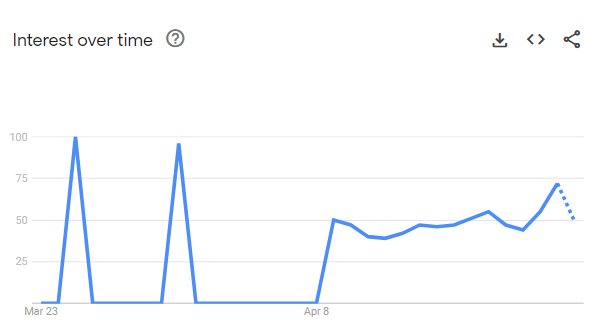
As you can see, there has been quite some interest in the query in the past month. That means it might be a good idea to focus on this keyword in your content and marketing efforts.
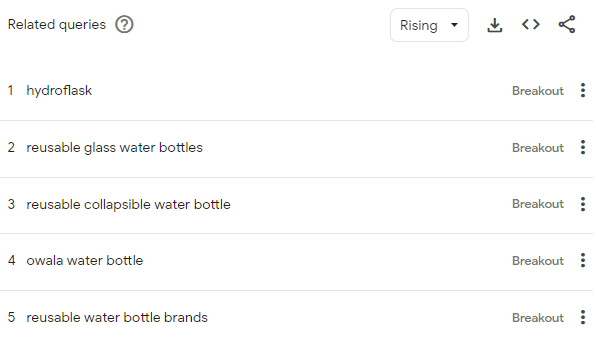
You can also scroll to the bottom to find related queries. As you can see, people are searching for hydro flasks and reusable glass water bottles. Maybe you can include these keywords in your content.
- Topic Clustering
In content marketing, a topic cluster is a group of content pieces that are related to a central topic.
Google Trends can help you identify these topics by showing related topics and queries. Let’s go with the same example that we used earlier.
If we look at the Related Topics section in Google Trends, the following topics are in the top 5:
- Drinking water
- Ice pack
- Plastic pollution
- Bisphenol A
- Drinking
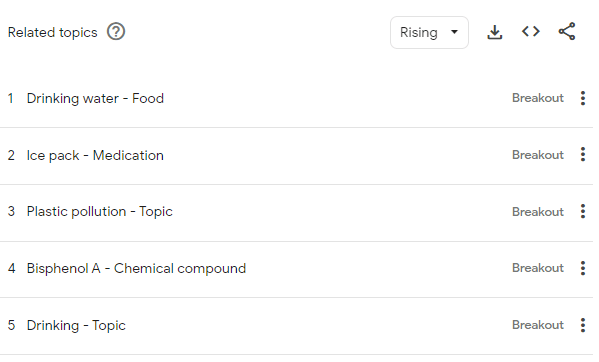
They are a good foundation to start building your topic cluster. For example, you can create blog posts around plastic pollution and discuss how reusable water bottles (such as yours) can help reduce plastic waste.
Similarly, discuss how Bisphenol A, a chemical commonly found in plastic bottles, can be harmful to human health and how switching to reusable water bottles can eliminate this risk.
If you need more inspiration, take a look at the Related Queries section, too. For example, you can see that people are searching for ”reusable water bottle brands.”
Maybe you can create a review blog post or video showcasing the top reusable water bottle brands, with your company as the top pick.
- Local SEO
Google Trends also has a section that shows you the regions in which your query is most popular.
If you’re a local business, this could be helpful for you.
Let’s say you’re an Indian restaurant. You want to see if people around your location are searching for ”Indian food” or related queries.
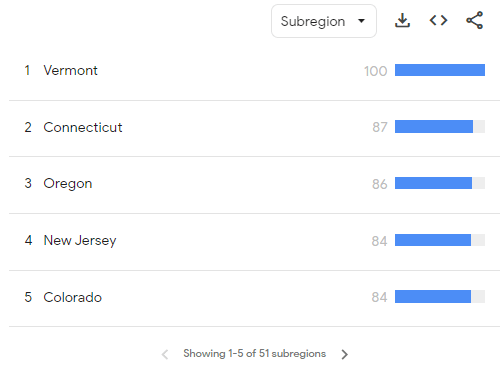
With the help of Google Trends, you can see which regions, metros, and cities search most often for terms relevant to your business.
You can also check related queries and topics in that specific region to create targeted content for your local audience.
- Social Media Marketing
The thing about social media is that trends come and go pretty quickly. Google Trends can help you stay on top of these trends to create timely campaigns.
Let’s say a new Bond movie is coming out. You know people will be talking about it, but you’re not entirely sure which key terms will be popular.
Use Google Trends to find out.
Then, you can create content or run ads around those trending keywords. For example, when the Barbie movie came out, a lot of brands joined the conversation on social media.
The point of using running trends in your social media campaigns is to stay visible and relevant.
Maybe your brand has nothing to do with Bond or Barbie, but by using popular keywords and hashtags, you can tap into a larger audience and potentially gain new followers or customers.
- Seasonal Marketing
Some topics may have a significant peak during certain times of the year, such as holidays or events.
For example, terms like ”Christmas gifts” or ”back to school supplies” will have a spike in searches during the holiday season and right before the start of a new school year.
Suppose you’re an online store selling Christmas decorations. You want to prepare for the peak season, so you use Google Trends to see when people begin searching for Christmas-related terms and what specific searches are popular during that time.
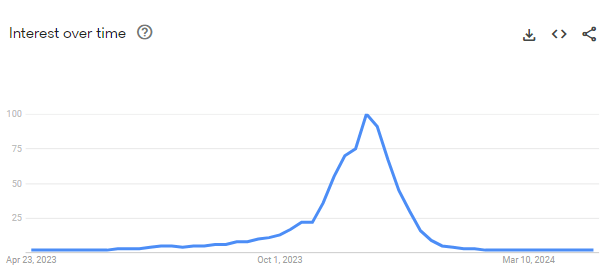
As you can see from the graph below, the searches for Christmas ornaments start coming in during October. They increase in November and December, reaching their peak.
The Keywords Everywhere graph gives a better view of month-by-month analysis compared to Google Trends. You can also check the search volume for each month individually.
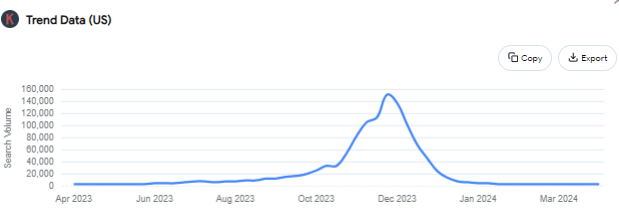
The graph tells you one thing: you need to start your marketing efforts in October.
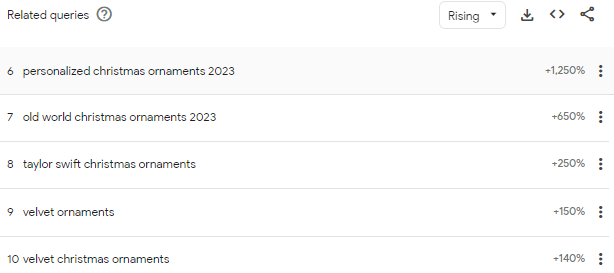
You can also check the related queries at the bottom to get ideas for content marketing topics. Incorporate these popular terms into your blog posts, social media content, and advertisements.
- Competitor Analysis
The comparison feature in Google Trends is a good way to see how your brand stacks up against competitors.
The feature allows you to compare search data from multiple brands or topics within a specific time frame.
Here’s what you need to do:
Enter your brand’s name in the first box, then enter your competitor’s name in the second one. You can add up to five terms.
For example, we’ll use three email marketing tools for our example:
- Zoho
- HubSpot
- Mailchimp
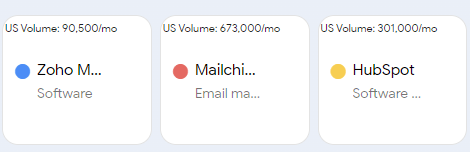
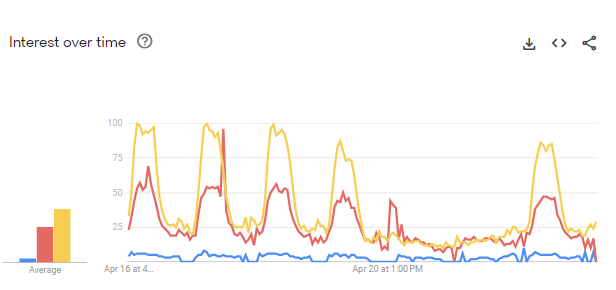
The results show that there’s more interest in HubSpot than the other two companies. Mailchimp gets the second-most interest, while Zoho falls behind in third place.
You can do the same with your company and up to four competitors. See how they fare against your brand in search interest.
Also, in the regional interest section at the bottom, check out which regions have the most interest in your brand and your competitors.
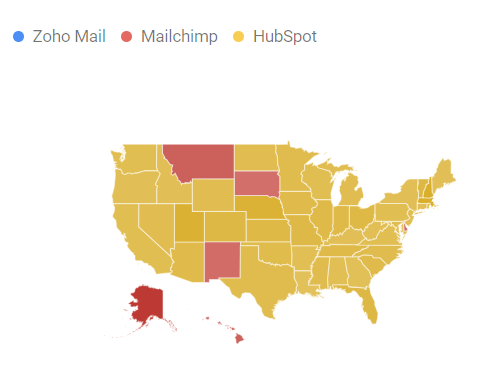
These insights can help you gauge where your brand stands in the market. You can then run a more targeted competitor analysis to see what your competition is doing that you’re not.
Conclusion
There’s no denying that Google Trends is a super handy tool. It keeps you updated on the latest trends in your industry and helps you tailor your marketing efforts accordingly.
Make it a habit to check Google Trends regularly, especially before launching any new campaigns or content.
If you want to amp up its functionality, use Keywords Everywhere in conjunction with Google Trends. The duo will make your campaigns more targeted and effective, resulting in better ROI.